
An official website of the United States government
An official website of the United States government
The .gov means it's official.
Federal government websites often end in .gov or .mil. Before sharing sensitive information,
make sure you're on a federal government site.
The site is secure.
The
https:// ensures that you are connecting to the official website and that any
information you provide is encrypted and transmitted securely.
The Quarterly Census of Employment and Wages (QCEW) program publishes a quarterly count of employment and wages reported by employers covering more than 95 percent of U.S. jobs, available at the county, MSA, state and national levels by industry.
Percent change in employment, average weekly wages, and establishments in 10 largest counties, total covered employment, September 2022 to September 2023
County
Percent change in employment
Percent change in establishments
Percent change in average weekly wages
Los Angeles, CA
-1.0%
2.6%
0.4%
Cook, IL
0.8%
2.1%
-1.7%
New York, NY
1.3%
1.1%
0.8%
Harris, TX
2.5%
-1.2%
0.4%
Maricopa, AZ
2.1%
5.6%
-0.8%
Dallas, TX
0.7%
-1.4%
-0.2%
Orange, CA
0.5%
3.3%
-1.2%
San Diego, CA
0.7%
3.7%
-1.6%
King, WA
-0.4%
0.4%
1.8%
Miami-Dade, FL
2.8%
5.0%
-1.0%
U.S. TOTAL
+1.5%(p) since Dec 2022
![]()
Los Angeles County, California
-0.5%(p) since Dec 2022
![]()
Cook County, Illinois
+0.8%(p) since Dec 2022
![]()
New York County, New York
+1.2%(p) since Dec 2022
![]()
Harris County, Texas
+1.9%(p) since Dec 2022
![]()
Maricopa County, Arizona
+1.8%(p) since Dec 2022
![]()
Dallas County, Texas
+0.9%(p) since Dec 2022
![]()
Orange County, California
+0.7%(p) since Dec 2022
![]()
San Diego County, California
+0.7%(p) since Dec 2022
![]()
King County, Washington
-0.5%(p) since Dec 2022
![]()
Miami-Dade County, Florida
+2.9%(p) since Dec 2022
![]()
U.S. TOTAL
+3.6%(p) since 4th Qtr of 2022
![]()
Los Angeles County, California
+2.4%(p) since 4th Qtr of 2022
![]()
Cook County, Illinois
+3.4%(p) since 4th Qtr of 2022
![]()
New York County, New York
+3.2%(p) since 4th Qtr of 2022
![]()
Harris County, Texas
+3.6%(p) since 4th Qtr of 2022
![]()
Maricopa County, Arizona
+3.8%(p) since 4th Qtr of 2022
![]()
Dallas County, Texas
+4.2%(p) since 4th Qtr of 2022
![]()
Orange County, California
+4.2%(p) since 4th Qtr of 2022
![]()
San Diego County, California
+2.4%(p) since 4th Qtr of 2022
![]()
King County, Washington
+7.3%(p) since 4th Qtr of 2022
![]()
Miami-Dade County, Florida
+2.8%(p) since 4th Qtr of 2022
![]()
05/22/2024
From fourth quarter 2022 to fourth quarter 2023, Snohomish, WA, had the largest county percentage increase in average weekly wages at 18.6 percent. Hays, TX, had the largest county over-the-year percentage increase in employment in December 2023 at 5.0 percent.
HTML
|
PDF
|
RSS
03/06/2024
BLS updated the full Quarterly Census of Employment and Wages (QCEW) database through the third quarter of 2023. Links to updated databases, files, and tables can be found at www.bls.gov/web/cewdat.supp.toc.htm.
HTML
|
PDF
|
RSS
|
Charts
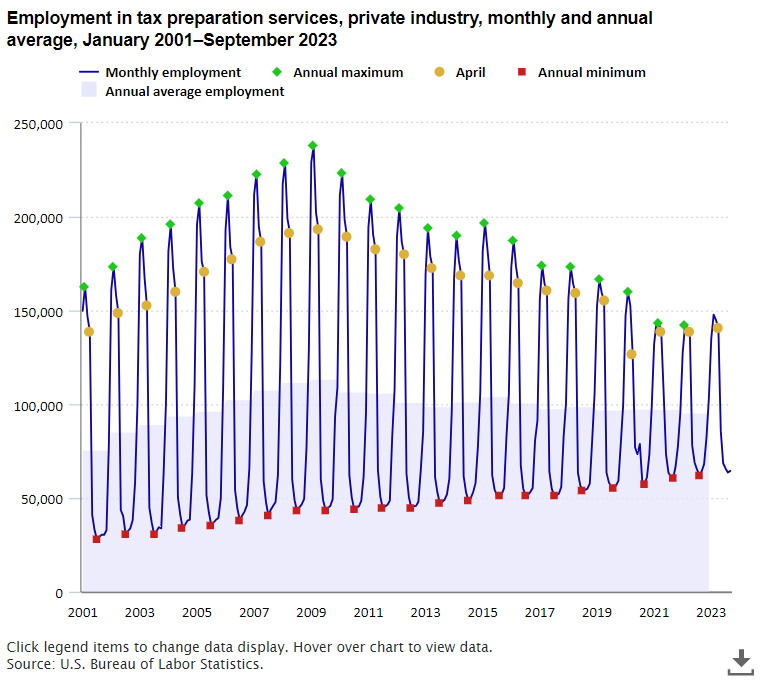
Average annual employment in tax preparation services was between approximately 95,000 and 98,000 from 2017 to 2022, after being above 100,000 most years from 2006 to 2016 and peaking at 113,000 in 2009. read more »

Nonprofit and for-profit establishments have different growth rates and levels of employment. read more »

This Spotlight on Statistics reviews historical employment trends for distilleries and other components of the beverage manufacturing industry. Additionally, the Spotlight looks at trends in the number of establishments and wages for the distillery industry and compares them to trends among breweries and wineries. Finally, a look at consumer prices for distilled spirits is reviewed. read more »