
An official website of the United States government
An official website of the United States government
The .gov means it's official.
Federal government websites often end in .gov or .mil. Before sharing sensitive information,
make sure you're on a federal government site.
The site is secure.
The
https:// ensures that you are connecting to the official website and that any
information you provide is encrypted and transmitted securely.
Both the C-CPI-U and the CPI-U use the same elementary price indexes as inputs. The differences between the two measures are a result of different upper level aggregation formulas and different expenditure weights (C-CPI-U weights are updated monthly and the CPI-U weights are fixed for a two year period).
The use of a superlative formula (Tornqvist) for upper-level aggregation, used in the final C-CPI-U, is designed to address consumer substitution across item categories. In contrast, the CPI-U uses a formula (Lowe) that assumes consumers do not substitute across item categories. Information on the Tornqvist and Lowe formulas is available in the CPI section of the BLS Handbook of Methods.
In general, the C-CPI-U and the CPI-U will diverge to the extent that:
Component elementary indexes have rates of price change that differ from each other, and
Expenditure shares reflect a shift in consumer purchases. For example, if consumer purchase chicken instead of steak when the price of steak rises.
Consequently, when there is more variation in price movement among elementary indexes, there is more room for divergence of these two indexes.
The relative importance (weight) of a component is its expenditure weight expressed as a percentage of all expenditures. Changes to relative importances can therefore be caused by changes in expenditures on a given component as well as changes to total expenditures.
Many changes to expenditure weights in the first half of 2020 were likely a result of the COVID-19 pandemic. Several notable expenditure categories are included in the table below (see table 1). Total expenditures by the U.S. urban population declined 6.2 percent in March 2020, 16.8 percent in April 2020, 11.1 percent in May 2020, and 6.1 percent in June 2020 compared to the previous year.
| Item category | CPI-U relative importance data (2017-2018 weights) | C-CPI-U Relative Importance Data (monthly weights) | |||||
|---|---|---|---|---|---|---|---|
| Dec-19 | Jan-20 | Feb-20 | Mar-20 | Apr-20 | May-20 | Jun-20 | |
|
Gasoline (all types) |
3.362 | 2.970 | 2.690 | 2.505 | 2.440 | 2.423 | 2.575 |
|
Airline fares |
0.786 | 0.902 | 0.637 | 0.489 | 0.021 | 0.056 | 0.126 |
|
Other lodging away from home including hotels and motels |
0.807 | 0.787 | 0.732 | 0.772 | 0.079 | 0.177 | 0.575 |
|
Food away from home |
6.191 | 6.127 | 6.702 | 3.990 | 2.786 | 3.103 | 3.485 |
|
Food at home |
7.579 | 7.693 | 8.319 | 9.585 | 9.237 | 9.376 | 7.563 |
|
Household paper products |
0.221 | 0.243 | 0.249 | 0.424 | 0.203 | 0.209 | 0.165 |
|
Haircuts and other personal care services |
0.666 | 0.583 | 0.469 | 0.341 | 0.291 | 0.336 | 0.429 |
|
Note: BLS publishes relative importance data for the CPI-U once a year, using December data. Additional details including relative importance values for additional components can be found on the Archived Relative Importance page. |
|||||||
The final C-CPI-U was higher than its initial estimate in April, May, and June of 2020, though the magnitude of the revision size was relatively small (see table 2). From 2015 to 2019 the average revision size was -0.182 index points.
| Month | Initial | Final | Revision size |
|---|---|---|---|
|
Jan-20 |
145.200 | 144.813 | -0.388 |
|
Feb-20 |
145.596 | 145.193 | -0.403 |
|
Mar-30 |
145.210 | 144.913 | -0.298 |
|
Apr-20 |
143.976 | 144.142 | 0.166 |
|
May-20 |
143.928 | 144.018 | 0.090 |
|
Jun-20 |
144.780 | 144.847 | 0.067 |
|
Jul-20 |
145.405 | 145.747 | 0.342 |
|
Aug-20 |
145.853 | 146.270 | 0.418 |
|
Sep-20 |
146.072 | 146.417 | 0.345 |
|
Oct-20 |
145.927 | 146.382 | 0.455 |
|
Nov-20 |
145.819 | 146.242 | 0.423 |
|
Dec-20 |
145.944 | 146.408 | 0.465 |
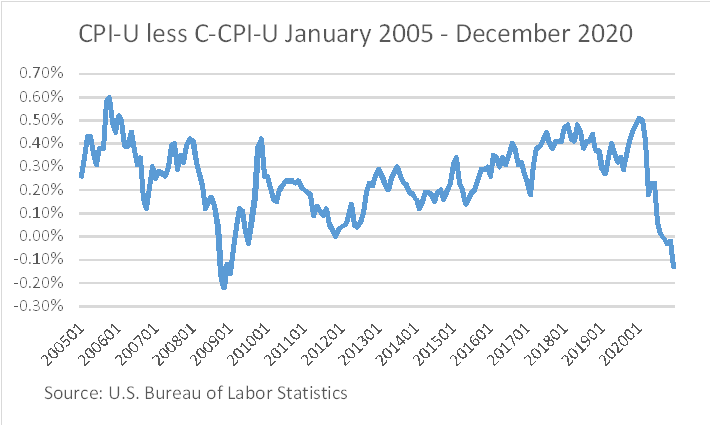
Chart 1 displays the difference in the 12-month change in the C-CPI-U from the CPI-U, often referred to as upper level substitution bias in the CPI-U.
The average difference between the CPI-U and the C-CPI-U in 2020 was 0.16 percent per annum.
Last Modified Date: December 3, 2021