
For Release: Monday, October 26, 2020
20-1835-CHI
| Technical information: | (312) 353-1880 | BLSInfoChicago@bls.gov | www.bls.gov/regions/midwest |
| Media contact: | (312) 353-1138 |
Consumer Expenditures for the Minneapolis Metropolitan Area: 2018-19
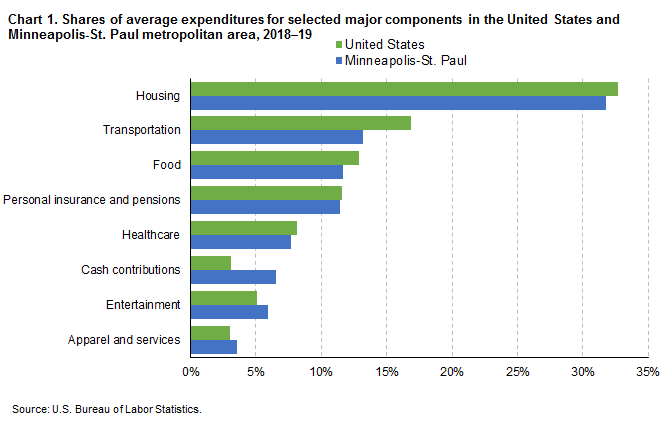
Households in the Minneapolis-St. Paul-Bloomington, MN-WI, metropolitan area spent an average of $84,006 per year in 2018–19, the U.S. Bureau of Labor Statistics reported today. Regional Commissioner Jason Palmer noted that this figure was significantly higher than the $62,395 average expenditure level for households in the United States. Minneapolis-area households allocated their dollars similarly to the nation in nine major components, while shares for five components differed significantly from their respective U.S. averages. For example, the share of expenditures for cash contributions, which accounted for 6.5 percent of the average household’s budget in the Minneapolis area, was higher than the national average of 3.1 percent. (See chart 1 and table 1.)
Highlights of the Minneapolis-area’s 2018–19 spending patterns:
Housing: This was the largest expenditure component for Minneapolis-area households and averaged $26,654. Housing accounted for 31.7 percent of the area’s household budget, not significantly different from the 32.7-percent U.S. average. (See table 1.) Housing expenditure shares among the 22 published metropolitan areas ranged from 38.0 percent in New York to 30.3 percent in Detroit. (See table 2.)
Transportation: Minneapolis-area households spent 13.2 percent of their budget on transportation, significantly lower than the national average of 16.8 percent. Of the $11,049 in annual transportation expenditures in Minneapolis, 86.7 percent was spent buying and maintaining private vehicles; this compared to the national average of 92.4 percent.
Food: The portion of a Minneapolis household’s budget spent on food, 11.6 percent, was significantly lower than the 12.9-percent U.S. average. Minneapolis-area households spent $5,497, or 56.3 percent, of their food dollars on food at home and $4,271 (43.7 percent) on food away from home. In comparison, the average U.S. household spent 56.6 percent of its food budget on food at home and 43.4 percent on food away from home.
Additional Information
Data in this release are from the Consumer Expenditure Survey (CE), which the U.S. Census Bureau conducts for the U.S. Bureau of Labor Statistics. The data in this release were averaged over a 2-year period, 2018 and 2019.
A household in the CE survey is defined as a consumer unit which includes families, single persons living alone or sharing a household with others but who are financially independent, or two or more persons living together who share expenses. The terms household or consumer unit are used interchangeably for convenience.
Differences in spending among metropolitan areas may reflect differences in the cost of living, but they also may reflect other causes. Spending differences may result from different consumer preferences or variations in demographic characteristics, such as household size, age, or income levels. However, expenditure shares, or the percentage of a household’s budget spent on a particular component, can be used to compare spending patterns across areas. Sample sizes for the metropolitan areas are much smaller than for the nation, so the U.S. estimates and year-to-year changes are more reliable than those for the metropolitan areas. Users should also keep in mind that prices for many goods and services have changed since the survey was conducted.
A value that is statistically different from another does not necessarily mean that the difference has economic or practical significance. Statistical significance is concerned with our ability to make confident statements about a universe based on a sample. A large difference between two values may not be statistically significant, while a small difference could be significant; both the sample size and the variation among the values in the sample affect the relative error of the estimates.
For additional technical and related information, see www.bls.gov/opub/hom/cex/home.htm. Data for the nation, the four geographic regions of the United States, and 22 metropolitan areas nationwide are available at www.bls.gov/cex/tables.htm. Metropolitan definitions used in the survey are available at www.bls.gov/cex/ce_msa_201516.htm. The metropolitan area discussed in this release is the Minneapolis-St. Paul-Bloomington, MN-WI Metropolitan Statistical Area, which is comprised of Anoka, Carver, Chisago, Dakota, Hennepin, Isanti, Le Sueur, Mille Lacs, Ramsey, Scott, Sherburne, Sibley, Washington, and Wright Counties in Minnesota; and Pierce and St. Croix Counties in Wisconsin. Metropolitan area news releases for the Consumer Expenditure Survey are available at www.bls.gov/regions/subjects/consumer-spending.htm.
Information in this release will be made available to sensory impaired individuals upon request. Voice phone: 202-691-5200; Federal Relay Service: 800-877-8339.
| Table 1. Average annual expenditures, characteristics, and percent distributions, United States and Minneapolis-St. Paul metropolitan area, 2018–19 | ||
|---|---|---|
| Category | United States | Minneapolis-St. Paul |
| - Continued | ||
Consumer unit characteristics: | ||
Income before taxes | $80,750 | $108,799 |
Age of reference person | 51.3 | 49.4 |
Average number in consumer unit: | ||
People | 2.5 | 2.3 |
Children under 18 | 0.6 | 0.5 |
Adults 65 and over | 0.4 | 0.3 |
Earners | 1.3 | 1.4 |
Vehicles | 1.9 | 2.3 |
Percent homeowner | 64 | 65 |
Average annual expenditures | $62,395 | $84,006* |
Percent distribution | ||
Total | 100.0 | 100.0 |
Food | 12.9 | 11.6* |
Alcoholic beverages | 0.9 | 1.3* |
Housing | 32.7 | 31.7 |
Apparel and services | 3.0 | 3.6 |
Transportation | 16.8 | 13.2* |
Healthcare | 8.1 | 7.7 |
Entertainment | 5.1 | 5.9 |
Personal care products and services | 1.2 | 1.1 |
Reading | 0.2 | 0.3* |
Education | 2.3 | 3.5 |
Tobacco products and smoking supplies | 0.5 | 0.5 |
Miscellaneous | 1.5 | 1.6 |
Cash contributions | 3.1 | 6.5* |
Personal insurance and pensions | 11.6 | 11.4 |
Note: An asterisk (*) represents a statistically significant difference from the U.S. average at the 95-percent confidence level. | ||
Note: An asterisk (*) represents a statistically significant difference from the U.S. average at the 95-percent confidence level.
| Table 2. Percent share of average annual expenditures for housing, transportation, and food, United States and 22 metropolitan areas, 2018–19 | |||
|---|---|---|---|
| Area | Housing | Transportation | Food |
| - Continued | |||
United States | 32.7 | 16.8 | 12.9 |
Anchorage | 30.5* | 17.3 | 13.4 |
Atlanta | 33.1 | 15.4 | 12.8 |
Baltimore | 31.7 | 17.1 | 10.9* |
Boston | 36.1* | 14.1* | 12.0 |
Chicago | 36.5* | 14.0* | 13.7 |
Dallas-Fort Worth | 37.6* | 15.6 | 11.4* |
Denver | 33.5 | 16.2 | 11.5* |
Detroit | 30.3* | 17.3 | 12.7 |
Honolulu | 36.4* | 13.2* | 18.9* |
Houston | 32.1 | 16.4 | 11.4* |
Los Angeles | 35.3* | 15.7 | 13.1 |
Miami | 35.6* | 19.0 | 11.0* |
Minneapolis-St. Paul | 31.7 | 13.2* | 11.6* |
New York | 38.0* | 12.5* | 13.3 |
Philadelphia | 35.3* | 15.4 | 12.2 |
Phoenix | 32.3 | 18.8 | 12.4 |
San Diego | 35.8* | 15.1 | 13.8 |
San Francisco | 36.6* | 12.7* | 13.2 |
Seattle | 36.0* | 14.2* | 12.7 |
St. Louis | 32.8 | 17.2 | 12.0 |
Tampa | 33.9 | 18.1 | 15.3* |
Washington, DC | 33.2 | 14.3* | 12.2 |
Note: An asterisk (*) represents a statistically significant difference from the U.S. average at the 95-percent confidence level. | |||
Note: An asterisk (*) represents a statistically significant difference from the U.S. average at the 95-percent confidence level.