An official website of the United States government
An official website of the United States government
The .gov means it's official.
Federal government websites often end in .gov or .mil. Before sharing sensitive information,
make sure you're on a federal government site.
The site is secure.
The
https:// ensures that you are connecting to the official website and that any
information you provide is encrypted and transmitted securely.
Businesses come in all sizes, from the smallest, with only one employee, to the largest multilocation business, with hundreds of thousands of employees. Each business contributes to the U.S. labor market in its own way, whether by fulfilling the American dream of business ownership or providing job security and benefits to its employees. Data from the Job Openings and Labor Turnover Survey (JOLTS) at the U.S. Bureau of Labor Statistics (BLS) have been used to produce two sets of size class estimates: establishment based and firm based. These data series can answer questions such as whether the size of the business affects patterns of posting and filling job openings, whether different-sized businesses manage labor in different ways using hires and layoffs, and whether employees join or separate differently at businesses of different sizes. The JOLTS program has received regular requests for size class estimates from economic organizations, media, government agencies, and universities.
This article profiles the recently released JOLTS experimental firm-based size class estimates in the context of business and worker behaviors over the business cycle. This article also compares these firm-based estimates with the JOLTS establishment-based size class estimates and also with the Business Employment Dynamics (BED) size class estimates (also produced by BLS).
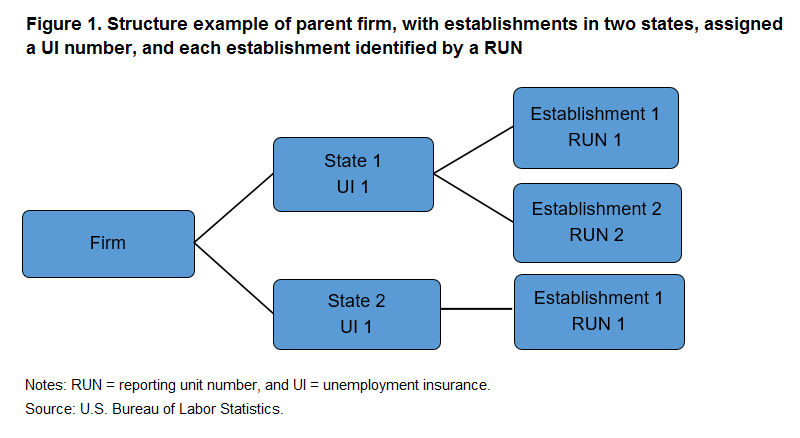
Before we explore the firm size estimates, we need to review some terminology. An “establishment” is a single business entity residing at a specific geographic location. Because JOLTS samples and collects data from establishments, we are able to easily calculate establishment-based size class estimates. But many establishments are part of a larger entity called a “firm” or an even larger entity called an “enterprise.” An establishment can be a stand-alone store, such as a “mom-and-pop” store, or it can be one location of a chain. For example, a hotel chain can be nationwide and is identified by an employer identification number (EIN) issued by the U.S. Internal Revenue Service. Each of the chain’s hotels in a given state typically has the same state-assigned unemployment insurance (UI) number, with each individual worksite within the hotel chain further identified by a reporting unit number (RUN). With this identification structure, establishments can be linked to their parent UI account, and UI accounts can be linked to their parent firm. (See figure 1.) JOLTS uses this structure to group establishments to their parent firm (EIN) to produce firm-based size class estimates.
Firms with more than one establishment, such as a nationwide hotel brand, may make important decisions at the firm level. Although turnover occurs at the establishment level as employees accept employment offers or quit their jobs, the firm level may be where decisions occur about whether or not to post new positions, backfill vacated jobs, lay off workers, or close locations.
Consider a small establishment with 10 employees. If it is a stand-alone business and the business cycle softens, there are limited options at the establishment level—borrowing money, laying off workers, or the owner going unpaid. But an establishment of the same size that is part of a larger firm may have more options, such as transferring employees to other better performing locations or receiving infusions of cash from other parts of the firm to keep it afloat until the business cycle improves. One can reasonably expect that job openings, hires, and separations for these two same-sized establishments might be different if one belongs to a larger firm and one does not. These two sets of size class data let us explore these questions.
The BED, another BLS program as just mentioned, provides measures of employment by size of establishment and firm. However, the BED program uses a large-scale business universe to produce statistics. Because the BED uses a universe, the program produces very detailed data by industry, geography, and size class. The downside is that because the universe list takes time to compile, the statistics are produced quarterly for past reference periods on a lag. The JOLTS program, however, is a monthly survey and, as such, can produce these size class statistics monthly.
Although the level of detail is not the same as that of the BED because of being a small sample, the JOLTS data represent the current economy, including changes that predate turning points in the business cycle. Before the Great Recession of 2007–09, the job openings peaked in April 2007, hires in September 2005, and quits in November 2006, each many months before the declared beginning of the recession. Employment, measured by the Current Employment Statistics program at BLS, continued to rise until the beginning of the recession. (See figure 2.)
Size class measurement methods are complicated. For many years, BLS has investigated alternative methods for calculating data by employment size. A February 2006 Monthly Labor Review article by Shail J. Butani and colleagues introduces the different sizing methodologies rather well,1 and another Monthly Labor Review article from March 2007 by Jessica Helfand and colleagues discusses in detail how firms of different sizes changed throughout the business cycle.2 In a more recent article, Katherine Bauer Klemmer explores the early firm-based size class data produced by JOLTS.3 In addition, an interesting article by Brian Headd discusses how employees of small businesses differ from those of larger businesses.4
Both the JOLTS establishment-based size class estimates published since 2010 and the JOLTS firm-based size class estimates published for the first time in 2017 provide estimates of job openings, hires, and separations for the private sector, beginning with December 2000. Both the establishment and firm size series are classified as experimental. Note that neither series provides size class data by industry because of sample-size constraints.
In the published establishment-based size class estimates, the size classes are 1–9 employees, 10–49 employees, 50–249 employees, 250–999 employees, 1,000–4,999 employees, and 5,000-plus employees.5 These experimental data are updated quarterly and are available upon request from the JOLTS program.6 The methodology statement is posted on the JOLTS webpage.7
In the newly published firm-based size class estimates, the size classes are slightly different: 1–49 employees, 50–499 employees, and 500-plus employees. The 50–499 size class overlaps two of the JOLTS size classes used for sampling, but these breaks were created to match the breaks used by the BED program, creating uniformity across BLS data series. The firm size methodology and data are available on the JOLTS webpage.8
To allow for comparison of establishment and firm size class estimates in this article, the JOLTS program retabulated the establishment size data through 2016 using the firm size breaks. For convenience, these sizes will be referred to as small (1–49 employees), medium (50–499 employees), and large (500-plus employees) in this article.
Both sets (establishment and firm) of JOLTS size class data provide series for job openings, hires, quits, layoffs and discharges, other separations, and total separations (the sum of quits, layoffs and discharges, and other separations).9 Job openings, hires, and layoffs and discharges reflect the firm anticipation of and reaction to changes in the business cycle. The business decides whether to post openings, to hire new workers or replace separated workers, and to lay off workers. The one caveat is that for a hire to occur, both the employer and the employee must act. That is, although the firm decides whether to extend a job offer, a hire occurs only if the applicant accepts the offer. In this article, hires are considered to be employer actions.
JOLTS data items that reflect the employees’ actions are quits and other separations. The employees decide whether changing jobs, leaving the labor market, or retiring is in their best interest. The other separations data item is a mixture of actions. This data item includes separations that are due to retirement (typically employee activated), transfers to other locations of the same business (employer activated), and separations because of disability or death (neither employee nor employer activated). Therefore, the other separations data reflect both the firm’s thinking and the employee’s thinking and will be analyzed in its own section.
Data from the Quarterly Census of Employment and Wages (QCEW) at BLS show that the distribution of firms by size is quite steady over time, with just under half of firms employing 500 or more employees and the remaining portion of employment split fairly evenly between small- and medium-sized firms.10 In 2001, the beginning of the JOLTS firm-based time series, the portions were 29-percent small firms, 26-percent medium firms, and 45-percent large firms. By 2017, the current end of the JOLTS firm-based time series, the distribution was similar with 28-percent small firms, 25-percent medium firms, and 47-percent large firms. (See table 1.)
| Firm size | 2001 | 2017 | ||
|---|---|---|---|---|
| Average employment | Percent of total employment | Average employment | Percent of total employment | |
Small (1–49 employees) | 31,563 | 29 | 33,464 | 28 |
Medium (50–499 employees) | 28,227 | 26 | 30,259 | 25 |
Large (500+ employees) | 48,866 | 45 | 56,412 | 47 |
All establishments | 108,656 | 100 | 120,135 | 100 |
Source: U.S. Bureau of Labor Statistics. | ||||
Here, we look at the employer-action data items: job openings, hires, and layoffs and discharges. For job openings, we see that throughout the time series, the largest firms posted considerably more job openings than the small- and medium-sized firms. (See figures 3a–e and 4a–e at the end of this article.) Before the start of the 2007–09 recession, firms of all sizes reduced job openings, but the job openings at the largest firms peaked in December 2006, followed by medium firms in April 2007 and by small firms in September 2007. During the recession, all sizes of firms steeply cut job openings. In addition, they all hit their end-of-recession trough within a few months of each other, with medium and large firms hitting their turning point in April 2009. Postrecession, the largest firms showed the strongest recovery, surpassing prerecession levels of job postings by mid-2014. Small and medium firms also recovered postrecession, but more slowly, and capped job openings at just slightly above prerecession peak levels. The postrecession surge in job openings at the largest firms indicates that larger firms had more confidence and could immediately resume expansion efforts once the recession ended. The small and medium firms were more cautious in their expansion, increasing job openings much more slowly. In 2016, all sizes of firms leveled off the number of job openings, but increased job openings modestly in 2017. The job openings rates, as given in figure 4a, show the same trends, but with a smaller gap between the job openings rates of large firms and those rates of small and medium firms.
As figure 3b shows, the firm-based hires data are slightly different from the job openings data. The largest firms again had the most hires, steepest recessionary decline, and strongest postrecession recovery. However, opposite of job openings, the small and medium firms cut hiring well before the largest firms did before the 2007–09 recession. Hires peaked in August 2005 in small firms, in September 2005 in medium firms, and not until November 2006 in large firms. In addition, unlike job openings, hires at medium-sized firms diverged from those of small firms in the second half of the recession, falling even further. Postrecession, the number of hires again converged for small and medium firms.
Different from firm-based job openings rates, the hires rates reverse the size classes with lower rates (rather than higher) for the largest firms for about three-fourths of the time series. (See figure 4b.) All firm sizes experienced a deep drop in the hires rate during the 2007–09 recession, but the hires rate at medium and large firms declined until the end of the recession, whereas hires rates at small firms stabilized mid-recession. Postrecession, the medium and large firms’ hires rates began trending back up. The small firms’ hires rates, however, flattened and then began trending downward from 2010 through the first quarter 2014. All firm sizes stabilized hiring rates by the second half of 2014. The smallest firms’ hires rate was more volatile—it declined in the second half of 2016 before recovering again in the first half of 2017 and then declined again at the end of 2017.
Looking at the job openings and hires rates together, we see that although large firms had the highest job openings rate, they had the lowest hires rate for most of the series. In addition, the smallest firms did not experience as much decline in their hiring rates as larger firms, so although small firms cut postings of new jobs during the recession, their hiring rate did not decline as steeply.
The layoffs and discharges data show us how firms manage downturns. Although the largest firms had the most layoffs, they had the lowest rate for the full series. As the 2007–09 recession approached, the smallest and largest firms increased layoffs after December 2005 and January 2006, respectively. Medium firms increased layoffs after September 2006. (See figures 3c and 4c.) Once the recession began, large firms immediately increased layoffs, whereas small firms increased layoffs again after April 2008 and medium firms increased layoffs after June 2008. The layoffs rates show that the largest firms’ layoffs did not spike as high as the smaller firm’s layoffs. Despite the different timing for increasing layoffs, layoffs peaked at firms of all sizes about three-fourths of the way through the recession, after which point they quickly decreased. After the recession, layoffs in all sizes of firms oscillated. The largest firms again increased layoffs after October 2010 until May 2015, decreased until August 2016, and then increased again. Small firms decreased layoffs until June 2014 before raising and lowering layoffs through 2017. Medium firms held layoffs relatively steady overall from 2010 onward, with some oscillation.
The quits data element reflects employee-initiated action. As figure 3d (at the end of this article) shows, the quits levels moved similarly to the hires levels, with the largest firms having the most quits, steepest decline, and strongest recovery. Also similar to hires levels, quits peaked first in medium firms (February 2006), then in small firms (May 2006), and then in large firms nearly a year later (March 2007). Quits levels at small and medium firms moved almost identically during the recession rather than diverging as they did with hires. The quits rates, shown in figure 4d (at the end of this article), are similar to the hires rates before the recession, with largest firms having the lowest rate and small and medium firms quite close to each other. Unlike hires rates, though, the quits rates converged for all sized firms before the recession and stayed extremely close until fourth quarter 2013 when the small firms’ quits rate began to lag a bit. Since mid-2016, quits rates at small firms fell behind a little more. The convergence of the quits rates tells us that, heading into, throughout, and following the recession, a smaller portion of employees of any size firm was willing to risk quitting their jobs to change jobs or to leave the workforce.
The other separations data element of JOLTS is often overlooked because the number of other separations is quite small compared with quits and with layoffs and discharges. But this data item is important since it includes, among other things, retirements and transfers between locations of the same business. Retirement is an extremely important milestone for most employees, and transfers between locations can be a useful management tool for multilocation firms. Larger firms are more likely to offer retirement benefits,11 and they are much more likely to have multiple locations to shift employees among.
The JOLTS firm size data support these factors with double the number of other separations at the largest firms. (See figure 3e at the end of this article.) Other separations peaked in June 2006 for large firms and in July 2006 for small and medium firms, well before the 2007–09 recession began. However, as the recession approached, other separations declined, perhaps reflecting hesitancy of workers at any size firm to retire as the economy softened. Other separations declined slightly for all firm sizes during both the 2001–03 and 2007–09 recessions. Once the 2007–09 recession passed, other separations increased steadily at large firms until November 2013 and then declined and rose twice more by the end of 2017. The level of other separations did not change much over time in small and medium firms, although some oscillation occurred after the recession.
Because smaller firms are less likely to offer retirement benefits and are less likely to have multiple locations to transfer among, the change in the business cycle regarding other separations did not affect workers as much at the smaller firms. The other separations rates, as shown in figure 4e (at the end of this article), have a small range, but the trends in the rates match those in the levels, especially the widening of the gap between the rates of other separations of employees at large firms in 2013 onward and those rates at small or medium firms.
The JOLTS firm-based size class data show that the largest firms readily altered job postings and layoffs as needed throughout the business cycle and had a harder time filling positions for most of the time series than the smaller firms. Employees seemed to be equal-opportunity quitters from firms of all sizes, quitting at similar rates heading into, throughout, and leaving the 2007–09 recession. For retirements and transfers, we see that employees had more opportunity for retirement and transfers at the largest firms.
The job openings, hires, and quits data series are potentially leading indicators going into a recession. As we saw in figure 2 earlier, the downward trends in these data series at the total nonfarm and total private levels began well before the onset of the 2007–09 recession. However, the turning points are different for the different firm sizes. For job openings, the largest firms held job openings steady at the beginning of 2006, peaked job openings in December 2006, and then decreased job openings through most of the recession. (See figure 3a at the end of this article.) The medium firms, however, peaked job openings in April 2007, and small firms kept increasing job openings, peaking in September 2007, just 3 months before the recession began. Given the different timing of the peaks, the more specific leading indicator of the 2007–09 downturn was the level of job openings at large firms.
Hires, however, moved in the opposite direction, with small and medium firms decreasing their hires at the beginning of 2006, while large firms did not decrease hiring until the end of 2006. (See figure 3b at the end of this article.) The employee quits patterns match those of hires, with employee quits declining sooner at small and medium firms than at large firms. (See figure 3d at the end of this article.) Therefore, the more specific leading indicators of the 2007–09 downturn were the hires and quits at small and medium firms.
Comparing data across firm size classes reveals a number of interesting findings. But looking at each size class by itself is informative too. In particular, how do job openings, hires, and quits—the three potential leading indicators—move relative to each other within firms of the same size class?
Before the 2007–09 recession, small and medium firms exhibited the same trends—job openings and quits moved together while hires moved in the opposite direction. (See figures 5 and 6.) Hires and quits peaked about the same time while job openings continued to increase until just before the recession. It makes sense that hires would decline as quits declined since less replacement hiring was occurring. And it makes sense that job openings would increase as hires decreased, but only to a point. If workers quit less often, fewer jobs would need to be filled. Yet, the number of job openings kept rising.
Postrecession, small and medium firms behaved somewhat differently. Small firms kept hiring flat through 2010, whereas medium firms increased hiring as soon as the recession ended. Quits began to trend up in both small and medium firms soon after the recession ended. Job openings differed between small and medium firms as well. Openings at small firms remained flat postrecession through 2010 before rising. At medium firms, job openings rose steeply as soon as the recession ended. In both small and medium firms, the number of hires remained above the number of job openings for the full series, although by the end of 2016, job openings and hires were close to each other in small firms. In medium firms, the hires and job openings converged sooner—by mid-2015.
Large firms have a different pattern, as figure 7 shows, with job openings, hires, and quits moving together before the 2007–09 recession, although job openings and hires peaked a few months sooner than quits. Postrecession, all three data series increased. However, unlike small and medium firms, large firms saw their number of job openings catch up with the number of hires by the end of 2011 and then surpass the hires by the end of 2014. Therefore, when we see job openings outnumbering hires at the total nonfarm and total private level, the largest firms are driving this phenomenon.
The JOLTS establishment-based size class data assign the employment size class on the basis of the employment at the individual business establishment locations rather than the employment at the whole firm. How do firm-based size class estimates compare with establishment-based size class estimates? Do they explain the U.S. labor market in different ways? Does being part of a larger firm change how businesses of different sizes manage their labor?
We saw earlier from the QCEW data that the distribution of employment by firm size class was fairly steady over time, with just under half of firms employing 500 or more employees.12 The QCEW data show that the distribution of employment by establishment size class is also fairly steady over time. Looking again at 2001 and 2017 (the beginning and end of the firm size series), in March 2001, we find that 43 percent of employees were at small establishments, 39 percent at medium, and 19 percent at large. By March 2017, the distributions were 44 percent small firms, 39 percent medium firms, and 17 percent large firms. (See table 2.)
| Establishment size | March 2001 | March 2017 | ||
|---|---|---|---|---|
| Employment | Percent of employment | Employment | Percent of employment | |
Small (1–49 employees) | 45,212,370 | 43 | 52,877,193 | 44 |
Medium (50–499 employees) | 43,092,892 | 39 | 46,820,063 | 39 |
Large (500+ employees) | 20,627,542 | 19 | 20,741,532 | 17 |
All establishments | 108,932,804 | 100 | 120,438,788 | 100 |
Note: Quarterly Census of Employment and Wages establishment employment data are available only for January, February, and March of each year. Source: U.S. Bureau of Labor Statistics. | ||||
First, we compare job openings. The establishment-based data show, as depicted in table 2, that most job openings were at establishments with fewer than 500 employees, primarily reflecting that over 80 percent of employment were at small and medium establishments. Figure 8a (at the end of this article) shows that, together, small and medium establishments posted about four times as many job openings as large establishments. Grouping those establishments by firms shows that many small- and medium-sized establishments belonged to a larger entity, causing large firms to have the most job openings. Next, we look at hires, quits, layoffs and discharges, and other separations and see the same pattern (see figures 8b–8e at the end of this article). That is, when we consider individual establishments, figures 8b and 8e reveal that the small- and medium-sized establishments had the most hires and other separations. However, once the establishments are grouped by firm, the largest firms had the most hires and separations.
Whether one uses establishment-based or firm-based estimates, the movement of the rates is very similar over time, although the rates are much closer together when the firms are grouped by size. From figures 9a–9d (at the end of this article), we see that the largest establishments and firms had the highest rate of job openings but had mostly lower rates of hires, quits, and layoffs and discharges.
The main difference in hires rates between establishments and firms is that by 2013, the largest firms had a higher hires rate than that of small and medium firms. In the establishment data, the hires rate at the largest establishments remained below smaller establishments. (See figure 9b.) This difference shows that when an establishment is part of a larger firm, more hiring (as a portion of employment) occurs.
In general, the quits rates trend the same between the establishment and firm series, but large firms have higher quits rates than large establishments. The establishment data shown in figure 9d indicate that employees were more likely to quit their jobs if they worked at a small- or medium-sized location. However, many of those establishments were part of a larger entity, so when we grouped them within their parent firm, the proportion of quits at the larger firm size increased. The end result is that since 2006, employees quit their jobs at basically the same rate regardless of the size of the firm.
As the layoffs and discharges data show in figure 8c, large establishments had considerably fewer layoffs but large firms had considerably more layoffs (December 2000–16). The layoffs and discharges rates in figure 9c, however, reveal a different finding between establishments and firms. The largest establishments and the largest firms had the lowest layoffs rate, and they started to increase layoffs a few months earlier than smaller establishments and firms. Both series show the same timing of the peak and depict rates very close for small and medium establishments and firms. What does this tell us? It tells us that the largest establishments and firms more often turned to layoffs and discharges as a labor management tool.
Other separations is the one JOLTS data element in which firm size data provide more information than establishment data. As with the other data elements, we see in the establishment data that most other separations were at small and medium establishments. However, when we grouped those small and medium establishments within their parent firm, we see that other separations were much more prominent at the largest firms. The levels differ more between small and medium establishments in the establishment data than in the firm data. We found that the other separations rates are nearly all between 0.2 percent and 0.4 percent in the establishment data, making analysis difficult. But the firm-based data series show differences in rates over time. They show that between size classes, the largest firms had the highest other separations rates, whereas small and medium firms had nearly equal rates.
As mentioned earlier, the BED program is another BLS program that publishes size class data for the private sector.13 Its data measure quarterly employment change, and published data series include gross job gains and gross job losses. Gross job gains measure the total positive employment change at businesses that increase employment between quarters. Similarly, gross job losses measure the total negative employment change at businesses that decrease employment between quarters.
Since changes in employment are the result of workers being hired and separated, comparing the BED job gains and losses with JOLTS hires and separations is natural. For comparison with the annual BED data, the JOLTS monthly data can be summed by year.
Looking first at the total private level, in figure 10, we find that the BED net employment change and the JOLTS implied net employment change (hires minus separations) trended nearly identically. Both series increased after the end of the 2001–03 recession, decreased before and during the 2007–09 recession, increased 2009–11, and then plateaued from 2011 onward. The trends, shown in figure 11, also track well for gross job gains and losses and hires and separations. When JOLTS hires outnumbered separations, BED gains outnumbered losses, such as between the two recessions and after the second recession. During the recessions, JOLTS separations outnumbered hires while BED losses outnumbered gains. The BED losses and JOLTS separations shown in the figure exhibit the same steep decline after 2009, after the recession ended.
Next, we look at decomposing data by size class. By decomposing data shown in figures 12a–c and 13a–c (at the end of this article) of both programs into three firm size classes, we find that the data continue to track well. In the smallest firm size (1–49 employees), the series trend together well, although the JOLTS net employment change is lower than the BED net change (see figure 12a). The hires and separations trends, in figure 13a, match the BED gains and losses, with losses exceeding gains essentially during the same time in which separations outnumbered hires.
The series of medium firms (50–499 employees) for JOLTS and BED trend well too, as figure 12b shows, but with a much smaller gap between the BED and JOLTS net employment change. Both series had their largest negative net employment change in 2009 and then rose until 2011 before plateauing. Separations outnumbered hires at the same time that losses outnumbered gains after the 2007–09 recession, and both had the same turning point in 2009 when hires were at a minimum and losses peaked. (See figure 13b.)
The large firms’ (500-plus employees) series also trended well. However, we see (in figure 12c) that the JOLTS net employment change was higher than the BED net employment change (the reverse of that for small firms). As with the medium firms, both large-firm series had the largest negative net employment change in 2009 before rising. The large firms, however, plateaued a little later, in 2012 rather than in 2011. In addition, separations outnumbered hires at the same time that losses outnumbered gains after the 2007–09 recession; however, the BED losses peaked in 2009, before the JOLTS hires hit their low point in 2010. (See figure 13c.)
This very basic analysis shows that the JOLTS and BED data display similar trends by firm size. If the data series were tabulated by quarter, they may match more closely. The BED estimates are based on a much larger dataset, and the program publishes much more detail than JOLTS. The BED program also has base sizing, end sizing, and dynamic sizing of firms. The JOLTS firm-based size class estimates are based on a base-sizing approach.
The official JOLTS estimates of job openings, hires, and separations by industry and by region provide useful data for analyzing the U.S. labor market. The experimental establishment size class data added in 2010 provided a new perspective on how employers and employees react to business cycle changes. The new firm size data, first released in September 2017 and updated in September 2018, are more informative tools for determining how employers manage labor through job openings, hires, and layoffs and discharges and how employees navigate changes in the business cycle through quitting or not quitting. We also see the effects of the business cycle on the employer transfers between locations and employee retirement or retirement postponement.
Charlotte Oslund, "An analysis of the new job openings and labor turnover data by size of firm," Monthly Labor Review, U.S. Bureau of Labor Statistics, May 2019, https://doi.org/10.21916/mlr.2019.8
1 Shail J. Butani, Richard L. Clayton, Vinod Kapani, James R. Spletzer, David M. Talan, and George S. Werking, Jr., “Business employment dynamics: tabulations by employer size,” Monthly Labor Review, February 2006, https://www.bls.gov/opub/mlr/2006/02/art1full.pdf.
2 Jessica Helfand, Akbar Sadeghi, and David M. Talan, “Employment dynamics: small and large firms over the business cycle,” Monthly Labor Review, March 2007, https://www.bls.gov/opub/mlr/2007/03/art3full.pdf.
3 Katherine Bauer Klemmer, “Analysis of JOLTS research estimates by size of firm” (paper presented at a meeting of the American Statistical Association, San Diego, CA, July 31, 2012), https://www.bls.gov/jlt/joltsfirmsizeanalysis.pdf.
4 Brian Headd, “The characteristics of small-business employees,” Monthly Labor Review, April 2000, https://www.bls.gov/opub/mlr/2000/04/art3full.pdf.
5 The JOLTS sample is allocated by region, industry, and six size classes: 1–9 employees, 10–49 employees, 50–249 employees, 250–999 employees, 1,000–4,999 employees, and 5,000-plus employees. For size class estimates, the six sampling size classes are collapsed into three estimation size classes (1–49, 50–499, and 500 plus).
6 For more information on the JOLTS program, go to the homepage at https://www.bls.gov/jlt, call 202-691-5870, or email BLS at JoltsInfo@bls.gov.
7 You can find more information about the methodology statement at “Job Openings and Labor Turnover Survey, Experimental JOLTS estimates by establishment size class,” U.S. Bureau of Labor Statistics, last modified February 12, 2019, https://www.bls.gov/jlt/sizeclassmethodology.htm.
8 For more information on the firm size methodology and data, go to https://www.bls.gov/jlt/.
9 The total separations data series is not analyzed in this article since it is the sum of quits, layoffs and discharges, and other separations that move in different directions, obscuring movement at the total separations level.
10 For more data on firm size, see BLS table F, “Distribution of private sector employment by firm size class: 1993/Q1 through 2018/Q1, not seasonally adjusted,” at https://www.bls.gov/web/cewbd/table_f.txt.
11 Data for 2010–17 from the National Compensation Survey at BLS show that, on average, retirement benefits are offered by 44 percent of establishments with fewer than 50 employees, 75 percent of establishments with 50–99 employees, 85 percent of establishments with 100–499 employees, and 94 percent of establishments with 500-plus employees.
12 QCEW establishment employment data are available only for January, February, and March of each year. See https://www.bls.gov/cew for more information on the QCEW program.
13 For more information on the BED program, see https://www.bls.gov/bdm/.