
An official website of the United States government
An official website of the United States government
The .gov means it's official.
Federal government websites often end in .gov or .mil. Before sharing sensitive information,
make sure you're on a federal government site.
The site is secure.
The
https:// ensures that you are connecting to the official website and that any
information you provide is encrypted and transmitted securely.
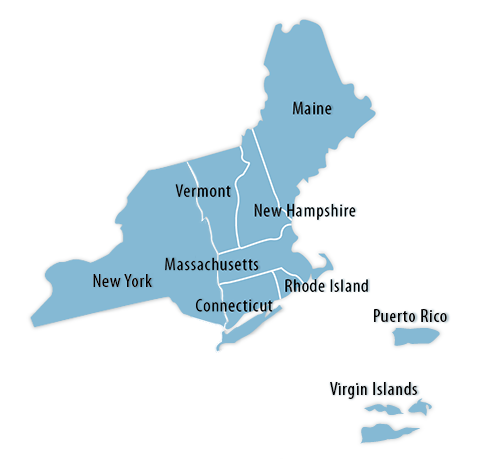
Click a state from the map or pick a state from the list:
Connecticut | Maine | Massachusetts | New Hampshire | New York | Puerto Rico | Rhode Island | Vermont | Virgin Islands
 Economic Summaries:
Economic Summaries are specialized products that combine data graphically from subjects such as unemployment, inflation, and wages into a single document for selected metropolitan areas. To view a specific area in this region, use the dropdown list below or click here.
From June 2023 to September 2023, gross job losses among private-sector establishments in Maine were 41,735, while gross job gains were 36,676.
Total compensation costs for private industry workers increased 4.1 percent in the New York-Newark, NY-NJ-CT-PA, metropolitan area for the year ended March 2024.
In February 2024, Vermont had 17,000 job openings, at a rate of 5.2 percent. The unemployed-per-job-opening ratio was 0.5.
In 2023, the broadest measure of labor underutilization, designated U-6, was 8.1 percent in New York State and 9.8 percent in New York City.
Prices in the Boston area, as measured by the Consumer Price Index for All Urban Consumers (CPI-U), rose 1.5 percent for the two months ending in March 2024.