
An official website of the United States government
An official website of the United States government
The .gov means it's official.
Federal government websites often end in .gov or .mil. Before sharing sensitive information,
make sure you're on a federal government site.
The site is secure.
The
https:// ensures that you are connecting to the official website and that any
information you provide is encrypted and transmitted securely.
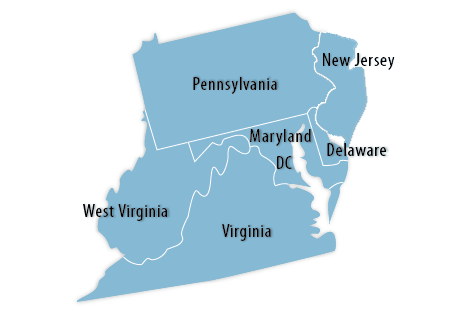
Click a state from the map or pick a state from the list:
Delaware | District of Columbia | Maryland | New Jersey | Pennsylvania | Virginia | West Virginia
 Economic Summaries:
Economic Summaries are specialized products that combine data graphically from subjects such as unemployment, inflation, and wages into a single document for selected metropolitan areas. To view a specific area in this region, use the dropdown list below or click here.
Total compensation costs for private industry workers increased 4.1 percent in the New York-Newark, NY-NJ-CT-PA, metropolitan area for the year ended March 2024.
Total compensation costs for private industry workers increased 4.5 percent in the Washington-Baltimore-Arlington, DC-MD-VA-WV-PA, Combined Statistical Area (CSA) for the year ended March 2024.
From June 2023 to September 2023, gross job losses from closing and contracting private-sector establishments in Maryland were 140,643.
Total compensation costs for private industry workers increased 2.8 percent in the Philadelphia-Reading-Camden, PA-NJ, metropolitan area for the year ended March 2024.
Total nonfarm employment for the Washington-Arlington-Alexandria, DC-VA-MD-WV, metropolitan area stood at 3,361,300 in March.