
An official website of the United States government
An official website of the United States government
The .gov means it's official.
Federal government websites often end in .gov or .mil. Before sharing sensitive information,
make sure you're on a federal government site.
The site is secure.
The
https:// ensures that you are connecting to the official website and that any
information you provide is encrypted and transmitted securely.
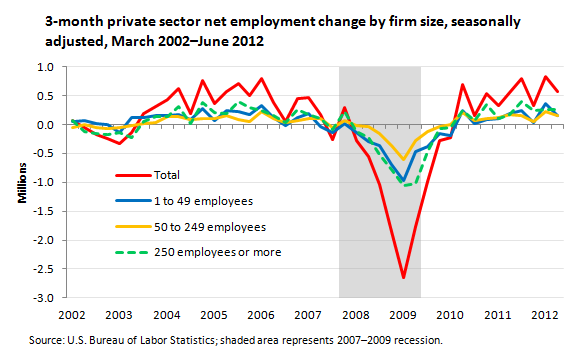
From March 2012 to June 2012, gross job losses increased among firms with 1–49 employees, 50–249 employees, and 250 employees or more. Additionally, gross job gains in the smallest size class decreased by 115,000. Firms with 250 employees or more accounted for 44 percent of the total net gain in employment for the second quarter of 2012.
| 3 months ended | Total | 1 to 49 employees | 50 to 249 employees | 250 employees or more |
|---|---|---|---|---|
Mar 2002 | 70,000 | 54,000 | -52,000 | 68,000 |
Jun 2002 | -61,000 | 69,000 | -7,000 | -123,000 |
Sep 2002 | -176,000 | 20,000 | -46,000 | -150,000 |
Dec 2002 | -247,000 | -3,000 | -73,000 | -171,000 |
Mar 2003 | -326,000 | -135,000 | -56,000 | -135,000 |
Jun 2003 | -137,000 | 112,000 | -26,000 | -223,000 |
Sep 2003 | 193,000 | 120,000 | 21,000 | 52,000 |
Dec 2003 | 310,000 | 146,000 | 32,000 | 132,000 |
Mar 2004 | 430,000 | 153,000 | 137,000 | 140,000 |
Jun 2004 | 621,000 | 169,000 | 141,000 | 311,000 |
Sep 2004 | 197,000 | 88,000 | 88,000 | 21,000 |
Dec 2004 | 759,000 | 274,000 | 101,000 | 384,000 |
Mar 2005 | 368,000 | 66,000 | 97,000 | 205,000 |
Jun 2005 | 570,000 | 243,000 | 146,000 | 181,000 |
Sep 2005 | 701,000 | 218,000 | 85,000 | 398,000 |
Dec 2005 | 506,000 | 169,000 | 45,000 | 292,000 |
Mar 2006 | 788,000 | 334,000 | 222,000 | 232,000 |
Jun 2006 | 375,000 | 117,000 | 110,000 | 148,000 |
Sep 2006 | 43,000 | -14,000 | 27,000 | 30,000 |
Dec 2006 | 447,000 | 117,000 | 74,000 | 256,000 |
Mar 2007 | 466,000 | 189,000 | 99,000 | 178,000 |
Jun 2007 | 174,000 | -31,000 | 108,000 | 97,000 |
Sep 2007 | -269,000 | -132,000 | -53,000 | -84,000 |
Dec 2007 | 298,000 | 8,000 | 63,000 | 227,000 |
Mar 2008 | -277,000 | -138,000 | -11,000 | -128,000 |
Jun 2008 | -547,000 | -287,000 | -37,000 | -223,000 |
Sep 2008 | -1,035,000 | -359,000 | -160,000 | -516,000 |
Dec 2008 | -1,850,000 | -693,000 | -370,000 | -787,000 |
Mar 2009 | -2,643,000 | -967,000 | -611,000 | -1,065,000 |
Jun 2009 | -1,766,000 | -475,000 | -275,000 | -1,016,000 |
Sep 2009 | -979,000 | -388,000 | -127,000 | -464,000 |
Dec 2009 | -277,000 | -161,000 | -42,000 | -74,000 |
Mar 2010 | -231,000 | -185,000 | -1,000 | -45,000 |
Jun 2010 | 689,000 | 233,000 | 211,000 | 245,000 |
Sep 2010 | 157,000 | 11,000 | 71,000 | 75,000 |
Dec 2010 | 534,000 | 86,000 | 99,000 | 349,000 |
Mar 2011 | 329,000 | 108,000 | 122,000 | 99,000 |
Jun 2011 | 550,000 | 195,000 | 178,000 | 177,000 |
Sep 2011 | 793,000 | 247,000 | 152,000 | 394,000 |
Dec 2011 | 332,000 | 39,000 | 46,000 | 247,000 |
Mar 2012 | 830,000 | 362,000 | 216,000 | 252,000 |
Jun 2012 | 572,000 | 158,000 | 161,000 | 253,000 |
Note: The net employment change is the difference between total gross job gains and total gross job losses. | ||||
Although the number of gross job gains declined among the smallest firms in the second quarter, the number increased among firms with 50–249 employees and firms with 250 employees or more.
Firms in all three size classes had a net employment gain in every quarter from the second quarter of 2010 to the second quarter of 2012. Over that period, firms with 1–49 employees gained 1.4 million jobs, while firms with 50–249 employees gained about 1.3 million jobs and firms with 250 employees or more gained 2.1 million jobs.
These data are from the Business Employment Dynamics (BED) program. The change in the number of jobs over time is the net result of gross gains and gross losses in employment that occur at all businesses in the economy. To learn more, see "Business Employment Dynamics — Second Quarter 2012" (HTML) (PDF), news release USDL‑13‑0140.
Bureau of Labor Statistics, U.S. Department of Labor, The Economics Daily, Employment change by firm size, second quarter of 2012 at https://www.bls.gov/opub/ted/2013/ted_20130207.htm (visited May 19, 2024).

