
An official website of the United States government
An official website of the United States government
The .gov means it's official.
Federal government websites often end in .gov or .mil. Before sharing sensitive information,
make sure you're on a federal government site.
The site is secure.
The
https:// ensures that you are connecting to the official website and that any
information you provide is encrypted and transmitted securely.
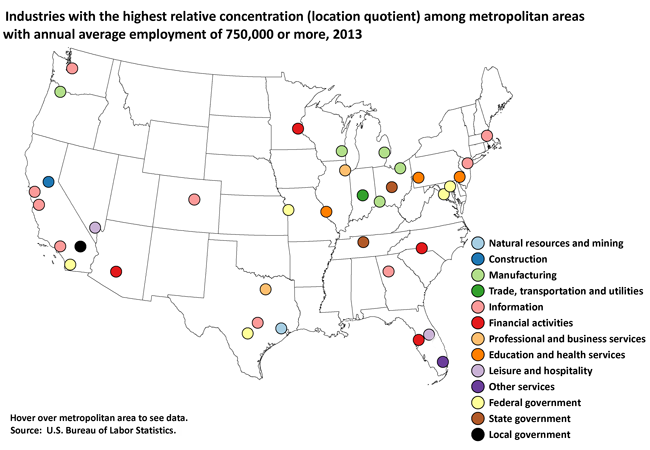
Among the 37 U.S. metropolitan areas with annual average employment greater than 750,000 in 2013, a total of 9 areas had the highest concentration of their employment in the information industry. San Jose-Sunnyvale-Santa Clara, California, had the highest location quotient in that industry (3.05), followed by Seattle-Tacoma-Bellevue, Washington, and Los Angeles-Long Beach-Santa Ana, California.
| Area | Industry | Employment location quotient relative to that of the United States |
|---|---|---|
|
Atlanta-Sandy Springs-Roswell, GA |
Information | 1.77 |
|
Austin-Round Rock, TX |
Information | 1.37 |
|
Baltimore-Columbia-Towson, MD |
Federal government | 1.98 |
|
Boston-Cambridge-Newton, MA-NH |
Information | 1.51 |
|
Charlotte-Concord-Gastonia, NC-SC |
Financial activities | 1.34 |
|
Chicago-Naperville-Elgin, IL-IN-WI |
Professional and business services | 1.24 |
|
Cincinnati, OH-KY-IN |
Manufacturing | 1.21 |
|
Cleveland-Elyria, OH |
Manufacturing | 1.40 |
|
Columbus, OH |
State government | 1.77 |
|
Dallas-Fort Worth-Arlington, TX |
Professional and business services | 1.15 |
|
Denver-Aurora-Lakewood, CO |
Information | 1.71 |
|
Detroit-Warren-Dearborn, MI |
Manufacturing | 1.41 |
|
Houston-The Woodlands-Sugar Land, TX |
Natural resources and mining | 2.65 |
|
Indianapolis-Carmel-Anderson, IN |
Trade, transportation, and utilities | 1.12 |
|
Kansas City, MO-KS |
Federal government | 1.33 |
|
Las Vegas-Henderson-Paradise, NV |
Leisure and hospitality | 3.01 |
|
Los Angeles-Long Beach-Anaheim, CA |
Information | 1.97 |
|
Miami-Fort Lauderdale-West Palm Beach, FL |
Other services | 1.24 |
|
Milwaukee-Waukesha-West Allis, WI |
Manufacturing | 1.67 |
|
Minneapolis-St. Paul-Bloomington, MN-WI |
Financial activities | 1.39 |
|
Nashville-Davidson--Murfreesboro--Franklin, TN |
State government | 1.39 |
|
New York-Newark-Jersey City, NY-NJ-PA |
Information | 1.50 |
|
Orlando-Kissimmee-Sanford, FL |
Leisure and hospitality | 2.00 |
|
Philadelphia-Camden-Wilmington, PA-NJ-DE-MD |
Education and health services | 1.37 |
|
Phoenix-Mesa-Scottsdale, AZ |
Financial activities | 1.49 |
|
Pittsburgh, PA |
Education and health services | 1.35 |
|
Portland-Vancouver-Hillsboro, OR-WA |
Manufacturing | 1.25 |
|
Riverside-San Bernardino-Ontario, CA |
Local government | 1.45 |
|
Sacramento--Roseville--Arden-Arcade, CA |
Construction | 1.12 |
|
San Antonio-New Braunfels, TX |
Federal government | 1.90 |
|
San Diego-Carlsbad, CA |
Federal government | 1.73 |
|
San Francisco-Oakland-Hayward, CA |
Information | 1.74 |
|
San Jose-Sunnyvale-Santa Clara, CA |
Information | 3.05 |
|
Seattle-Tacoma-Bellevue, WA |
Information | 2.60 |
|
St. Louis, MO-IL |
Education and health services | 1.17 |
|
Tampa-St. Petersburg-Clearwater, FL |
Financial activities | 1.45 |
|
Washington-Arlington-Alexandria, DC-VA-MD-WV |
Federal government | 6.09 |
In 2013, Washington-Arlington-Alexandria, DC-VA-MD-WV, had the highest concentration of its employment in the federal government. Other areas with the highest concentration of their employment in the federal government included Baltimore-Columbia-Towson, Maryland; San Antonio-New Braunfels, Texas; San Diego-Carlsbad, California; and Kansas City, Missouri-Kansas.
Milwaukee-Waukesha-West Allis, Wisconsin, Detroit-Warren-Dearborn, Michigan, and Cleveland-Elyria, Ohio, were among those areas with the highest concentration of their employment in manufacturing in 2013.
In 2013, Las Vegas-Henderson-Paradise, Nevada, and Orlando-Kissimmee-Sanford, Florida, were the only two areas with the highest concentration of employment in the leisure and hospitality industry.
These data are from the Quarterly Census of Employment and Wages program. Location quotients are ratios that allow an area's distribution of employment by industry to be compared to a reference or base area's distribution (in this case, the United States). A location quotient greater than 1 indicates an industry with a greater share of area employment than the United States. For example, Las Vegas had a location quotient greater than 1 in the leisure and hospitality industry because this industry made up a larger share of the Las Vegas employment total than it did for the country as a whole.
Bureau of Labor Statistics, U.S. Department of Labor, The Economics Daily, Industries with the highest concentration of employment among large areas, 2013 at https://www.bls.gov/opub/ted/2014/ted_20141120.htm (visited May 19, 2024).

