
Consumer spending increased 4.7 percent in 2014. This increase reverses the 2013 decline of 0.7 percent. These figures are based on annual data from the Consumer Expenditure Survey (CE). Consumer units’ (CUs) average annual expenditures increased from $51,100 in 2013 to $53,495 in 2014.1 Accompanying the increase in expenditures was an increase in average income before taxes of 4.8 percent between 2014 ($66,877) and 2013 ($63,784). Prices, as measured by the average annual change in the Consumer Price Index for All Urban Consumers (CPI-U, U.S. city average, all items, base period 1982–1984=100) rose by 1.6 percent in 2014, compared with the 4.7 percent increase in spending.2 In 2013, prices increased by 1.5 percent, compared with the 0.7 percent decrease in spending. This report highlights spending patterns for 2014 from the CE.
Developments in 2014
During 2014, spending increased across the six largest categories of expenditures tracked by CE: food, housing, transportation, healthcare, entertainment, and personal insurance and pensions. (See table A). Expenditures on transportation, food, personal insurance and pensions, and housing rose modestly ranging from a 0.8-percent increase to a 3.8-percent increase. During the same time period, expenditures on entertainment, apparel and services, and healthcare increased substantially, ranging from a 9.9-percent increase to an 18.1-percent increase.3 In 2013, changes in spending varied among these major categories.
Consumer confidence levels also increased in 2014, as reflected by the Consumer Confidence Index of the Conference Board, which registered an index value of 87 (86.900), up from 73 in 2013.4 (The level is an index, with 1985 =100. Levels of 100 or higher reflect greater consumer optimism compared with the base year.) The improvement in consumer confidence coincides with the gradual decline in the unemployment rate in 2014. The annual average monthly unemployment rate fell steadily throughout the year, but still remained above prerecession levels of 4.6 percent in 2006 and 2007.5 According to the Current Population Survey, the 2014 monthly rate fell from 6.6 percent in January to 5.6 percent in December, with an average of 6.2 percent. This compares to an average of 7.4 percent in 2013.6 The number of long-term (27 weeks or more) unemployed individuals, although declining from 4.3 million in 2013 to 3.2 million in 2014, was still higher than prerecession levels (1.2 million in 2007). In addition, consumer confidence may also be reflective of the gradual economic recovery, as evidenced by the 1.2 percent increase in real GDP in 2014.7
| Table A. Average annual expenditures by major category of all consumer units and percent changes, Consumer Expenditure Survey, 2011–14 | |||||||
|---|---|---|---|---|---|---|---|
| Item | 2011 | 2012 | 2013 | 2014 | Percent change | ||
| 2011–12 | 2012–13 | 2013–14 | |||||
| Number of consumer units (in thousands) | 122,287 | 124,416 | 125,670 | 127,006 | - | - | - |
| Consumer unit characteristics: | |||||||
Income before taxes | $63,685 | $65,596 | $63,784 | $66,877 | 3.0 | -2.8 | 4.8 |
Age of reference person | 49.7 | 50.0 | 50.1 | 50.3 | - | - | - |
Average number in consumer unit: | |||||||
People | 2.5 | 2.5 | 2.5 | 2.5 | - | - | - |
Children under 18 | 0.6 | 0.6 | 0.6 | 0.6 | - | - | - |
Adults 65 and older | 0.3 | 0.3 | 0.3 | 0.4 | - | - | - |
Earners | 1.3 | 1.3 | 1.3 | 1.3 | - | - | - |
Vehicles | 1.9 | 1.9 | 1.9 | 1.9 | - | - | - |
Percent homeowner | 65 | 64 | 64 | 63 | - | - | - |
| Average annual expenditures | $49,705 | $51,442 | $51,100 | $53,495 | 3.5 | -0.7 | 4.7 |
Food | 6,458 | 6,599 | 6,602 | 6,759 | 2.2 | 0.0 | 2.4 |
Food at home | 3,838 | 3,921 | 3,977 | 3,971 | 2.2 | 1.4 | -0.2 |
Cereals and bakery products | 531 | 538 | 544 | 519 | 1.3 | 1.1 | -4.6 |
Meats, poultry, fish, and eggs | 832 | 852 | 856 | 892 | 2.4 | 0.5 | 4.2 |
Dairy products | 407 | 419 | 414 | 423 | 2.9 | -1.2 | 2.2 |
Fruits and vegetables | 715 | 731 | 751 | 756 | 2.2 | 2.7 | 0.7 |
Other food at home | 1,353 | 1,380 | 1,412 | 1,382 | 2.0 | 2.3 | -2.1 |
Food away from home | 2,620 | 2,678 | 2,625 | 2,787 | 2.2 | -2.0 | 6.2 |
Alcoholic beverages | 456 | 451 | 445 | 463 | -1.1 | -1.3 | 4.0 |
Housing | 16,803 | 16,887 | 17,148 | 17,798 | 0.5 | 1.5 | 3.8 |
Shelter | 9,825 | 9,891 | 10,080 | 10,491 | 0.7 | 1.9 | 4.1 |
Owned dwellings | 6,148 | 6,056 | 6,108 | 6,149 | -1.5 | 0.9 | 0.7 |
Rented dwellings | 3,029 | 3,186 | 3,324 | 3,631 | 5.2 | 4.3 | 9.2 |
Other lodging | 648 | 649 | 649 | 710 | 0.2 | 0.0 | 9.4 |
Utilities, fuels, and public services | 3,727 | 3,648 | 3,737 | 3,921 | -2.1 | 2.4 | 4.9 |
Household operations | 1,122 | 1,159 | 1,144 | 1,174 | 3.3 | -1.3 | 2.6 |
Housekeeping supplies | 615 | 610 | 645 | 632 | -0.8 | 5.7 | -2.0 |
Household furnishings and equipment | 1,514 | 1,580 | 1,542 | 1,581 | 4.4 | -2.4 | 2.5 |
Apparel and services | 1,740 | 1,736 | 1,604 | 1,786 | -0.2 | -7.6 | 11.3 |
Transportation | 8,293 | 8,998 | 9,004 | 9,073 | 8.5 | 0.1 | 0.8 |
Vehicle purchases (net outlay) | 2,669 | 3,210 | 3,271 | 3,301 | 20.3 | 1.9 | 0.9 |
Gasoline and motor oil | 2,655 | 2,756 | 2,611 | 2,468 | 3.8 | -5.3 | -5.5 |
Other vehicle expenses | 2,454 | 2,490 | 2,584 | 2,723 | 1.5 | 3.8 | 5.4 |
Public and other transportation | 516 | 542 | 537 | 581 | 5.0 | -0.9 | 8.2 |
Healthcare | 3,313 | 3,556 | 3,631 | 4,290 | 7.3 | 2.1 | 18.1 |
Entertainment | 2,572 | 2,605 | 2,482 | 2,728 | 1.3 | -4.7 | 9.9 |
Personal care products and services | 634 | 628 | 608 | 645 | -0.9 | -3.2 | 6.1 |
Reading | 115 | 109 | 102 | 103 | -5.2 | -6.4 | 1.0 |
Education | 1,051 | 1,207 | 1,138 | 1,236 | 14.8 | -5.7 | 8.6 |
Tobacco products and smoking supplies | 351 | 332 | 330 | 319 | -5.4 | -0.6 | -3.3 |
Miscellaneous | 775 | 829 | 645 | 782 | 7.0 | -22.2 | 21.2 |
Cash contributions | 1,721 | 1,913 | 1,834 | 1,788 | 11.2 | -4.1 | -2.5 |
Personal insurance and pensions | 5,424 | 5,591 | 5,528 | 5,726 | 3.1 | -1.1 | 3.6 |
Life and other personal insurance | 317 | 353 | 319 | 327 | 11.4 | -9.6 | 2.5 |
Pensions and Social Security | 5,106 | 5,238 | 5,209 | 5,399 | 2.6 | -0.6 | 3.6 |
| Source: U.S. Bureau of Labor Statistics. | |||||||
Expenditure shares
Table B provides the percent distribution of total annual expenditures by major expenditure categories for all CUs from 2010 to 2014. Expenditure shares usually do not fluctuate much in the short term and thus are more useful for identifying spending trends over time. As in previous years, housing was the largest component of overall expenditures, accounting for 33.3 percent of total expenditures in 2014. Housing expenditures were followed by transportation (17.0 percent) and food expenditures (12.6 percent). The most notable changes in expenditure shares between 2013 and 2014 were in healthcare and transportation, with healthcare increasing to 8.0 percent from 7.1 percent of expenditures. Transportation decreased to 17.0 percent from 17.6 percent, in part due to lower expenditures on gasoline and motor oil. Also of note, apparel and services, whose share of household expenditures shrunk over the 2011–12 and 2012–13 periods, increased in 2014 to 3.3 percent. Personal insurance and pensions continued a downward trend as a percentage of total expenditures decreasing to 10.7 percent from 10.8 percent.
| Table B. Percent distribution of total annual expenditures by major category for all consumer units, Consumer Expenditure Survey, 2010–14 | |||||
|---|---|---|---|---|---|
| Spending category | 2010 | 2011 | 2012 | 2013 | 2014 |
| Average annual expenditures | 100.0 | 100.0 | 100.0 | 100.0 | 100.0 |
Food | 12.7 | 13.0 | 12.8 | 12.9 | 12.6 |
Food at home | 7.5 | 7.7 | 7.6 | 7.8 | 7.4 |
Food away from home | 5.2 | 5.3 | 5.2 | 5.1 | 5.2 |
Alcoholic beverages | 0.9 | 0.9 | 0.9 | 0.9 | 0.9 |
Housing | 34.4 | 33.8 | 32.8 | 33.6 | 33.3 |
Shelter | 20.4 | 19.8 | 19.2 | 19.7 | 19.6 |
Utilities, fuels, and public services | 7.6 | 7.5 | 7.1 | 7.3 | 7.3 |
Household operations | 2.1 | 2.3 | 2.3 | 2.2 | 2.2 |
Housekeeping supplies | 1.3 | 1.2 | 1.2 | 1.3 | 1.2 |
Household furnishings and equipment | 3.0 | 3.0 | 3.1 | 3.0 | 3.0 |
Apparel and services | 3.5 | 3.5 | 3.4 | 3.1 | 3.3 |
Transportation | 16.0 | 16.7 | 17.5 | 17.6 | 17.0 |
Vehicle purchases (net outlay) | 5.4 | 5.4 | 6.2 | 6.4 | 6.2 |
Gasoline and motor oil | 4.4 | 5.3 | 5.4 | 5.1 | 4.6 |
Other vehicle expenses | 5.1 | 4.9 | 4.8 | 5.1 | 5.1 |
Public and other transportation | 1.0 | 1.0 | 1.1 | 1.1 | 1.1 |
Healthcare | 6.6 | 6.7 | 6.9 | 7.1 | 8.0 |
Entertainment | 5.2 | 5.2 | 5.1 | 4.9 | 5.1 |
Personal care products and services | 1.2 | 1.3 | 1.2 | 1.2 | 1.2 |
Reading | 0.2 | 0.2 | 0.2 | 0.2 | 0.2 |
Education | 2.2 | 2.1 | 2.3 | 2.2 | 2.3 |
Tobacco products and smoking supplies | 0.8 | 0.7 | 0.6 | 0.6 | 0.6 |
Miscellaneous | 1.8 | 1.6 | 1.6 | 1.3 | 1.5 |
Cash contributions | 3.4 | 3.5 | 3.7 | 3.6 | 3.3 |
Personal insurance and pensions | 11.2 | 10.9 | 10.9 | 10.8 | 10.7 |
Life and other personal insurance | 0.7 | 0.6 | 0.7 | 0.6 | 0.6 |
Pensions and Social Security | 10.5 | 10.3 | 10.2 | 10.2 | 10.1 |
| Source: U.S. Bureau of Labor Statistics. | |||||
Housing
Average expenditures on mortgage interest and charges for homeowners decreased in 2014. Homeowners spent 19.1 percent less on this component of housing in 2014 ($4,691) than they did in 2007 ($5,799). This is likely the result of the continuing trend of lower interest rates, which has been in place since the recession that began in December 2007 and ended in June 2009.
In addition, while the recession led to an overall trend of fewer CUs owning homes, the CE reported a reversal of this trend in 2013, as the number of homeowners increased from 79.9 million in 2012 to 80.1 million in 2013. However, the declining trend of homeownership reasserted itself in 2014 as the number of homeowners declined to 79.6 million. This level was below the prerecession level of 80.2 million homeowners in 2007 (66.8 percent of all CUs in that year). In percentage terms, homeownership dropped from 63.7 percent in 2013 to 62.7 percent in 2014. Declining homeownership is even more evident from the increase in the number of renters since 2007. In 2007, there were 39.9 million renters, compared with 47.4 million in 2014. According to the CPI-U, rents for primary residences have increased 17.7 percent since 2007. During the 2007–14 time span, the average annual rental payments reported in the CE increased 23.6 percent ($9,559 in 2014, compared with $7,732 in 2007), reflecting the increase in demand for rental units.
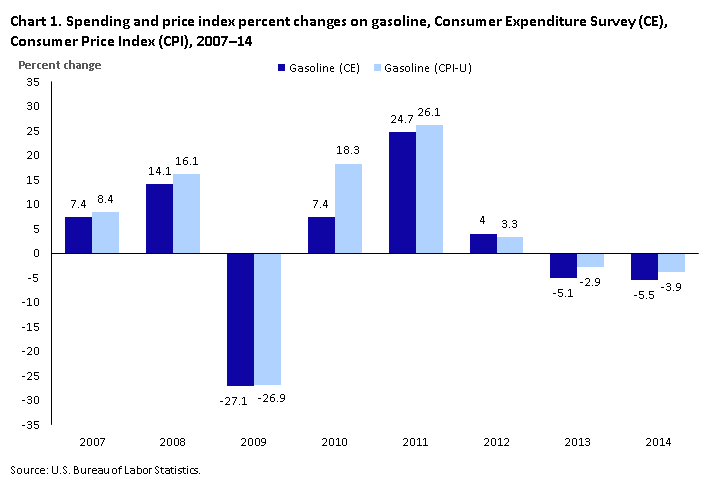
Gasoline
Average expenditures on gasoline decreased again in 2014. CUs spent 5.5 percent less in 2014 ($2,284) than they did in 2013 ($2,418), reflecting the declining oil and gasoline prices of the second half of 2014. Chart 1 shows the percentage change in expenditures on gasoline and the price of gasoline between 2007 and 2014. With the exception of 2010, the change in consumer spending is similar to the change in prices. For 2014, the percentage decline in spending on gasoline was larger (5.5 percent) than the drop in the CPI index for gasoline (3.9 percent). For a more detailed discussion of gasoline prices and consumption, see https://www.bls.gov/opub/btn/volume-5/using-gasoline-data-to-explain-inelasticity.htm.
Gasoline expenditures decreased in every income quintile in 2014. The fifth (highest) quintile had the largest percentage decrease in expenditures from 2013 to 2014, a decline of 7.0 percent to $3,438 from $3,699. By age of reference person, all but one age group (75 years and older, up 4.4 percent to $1,180) decreased spending in 2014. The largest percentage decrease was in the 25–34 age group (down 8.1 percent to $2,299), followed by the 55–64 age group (down 7.9 percent to $2,381).
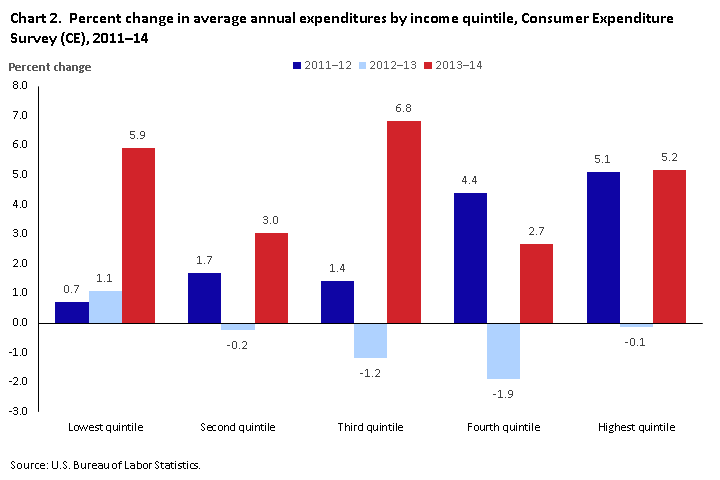
Expenditures by income quintile
Spending increased across all five income quintiles between 2013 and 2014. This reversed the declines seen in four of the five income quintiles in 2013. (See chart 2). The lowest quintile increased spending by 5.9 percent in 2014, while the second through fifth quintiles increased spending between 2.7 and 6.8 percent. Further details on spending by income quintile can be seen in table C.
All income quintiles showed higher spending on food away from home, housing, healthcare, and entertainment in 2014 relative to 2013. (See table C). Among these categories, healthcare expenditures increased most significantly, with the four highest quintiles reporting percent increases between 14.1 and 25.4 percent. Apparel and services spending declined for the fourth income quintile, and spending on personal insurance and pensions declined for the second quintile, but all other quintiles increased spending on both these categories. Results were more mixed for the categories of food at home, transportation, and cash contributions, with three of five quintiles in each showing decreases in spending. The category of all other expenditures increased for all quintiles.
| Table C. Dollar change and percent change in average annual expenditures on major categories by income quintile, Consumer Expenditure Survey, 2013–14 | ||||||||||
|---|---|---|---|---|---|---|---|---|---|---|
| Item | Lowest | Second | Third | Fourth | Highest | |||||
| Dollar | Percent | Dollar | Percent | Dollar | Percent | Dollar | Percent | Dollar | Percent | |
| Average annual expenditure change | ||||||||||
| Total | $1,320 | 5.9 | $987 | 3.0 | $2,900 | 6.8 | $1,575 | 2.7 | $5,126 | 5.2 |
| Food | 12 | 0.3 | -27 | -0.6 | 264 | 4.6 | 124 | 1.6 | 411 | 3.7 |
At home | -8 | -0.3 | -83 | -2.6 | 64 | 1.8 | 19 | 0.4 | -19 | -0.3 |
Away from home | 20 | 1.8 | 55 | 3.5 | 200 | 9.4 | 104 | 3.3 | 430 | 8.4 |
| Housing | 680 | 7.6 | 514 | 4.3 | 640 | 4.3 | 484 | 2.5 | 911 | 2.9 |
| Apparel and services | 62 | 8.6 | 82 | 7.9 | 202 | 15.2 | -9 | -0.5 | 569 | 18.6 |
| Transportation | 228 | 6.9 | -160 | -2.7 | 404 | 5.0 | -64 | -0.6 | -72 | -0.4 |
| Healthcare | 78 | 4.4 | 402 | 14.1 | 651 | 19.3 | 696 | 15.9 | 1464 | 25.4 |
| Entertainment | 106 | 10.6 | 150 | 10.6 | 368 | 18.4 | 102 | 3.6 | 496 | 9.7 |
| Cash contributions | -71 | -12.3 | 80 | 7.6 | 115 | 8.8 | -182 | -8.7 | -177 | -4.3 |
| Personal insurance and pensions | 38 | 8.2 | -59 | -3.6 | 57 | 1.6 | 152 | 2.3 | 789 | 5.1 |
| All other expenditures | 186 | 9.8 | 7 | 0.4 | 199 | 8.3 | 273 | 8.1 | 733 | 10.8 |
| Source: U.S. Bureau of Labor Statistics. | ||||||||||
Food
Food expenditures increased for all but the second quintile in 2014. This differs from 2013, where food expenditures increased for only the lowest two quintiles. The third quintile registered the largest percentage increase in food expenditures, an increase of 4.6 percent from $5,728 in 2013 to $5,992 in 2014. This reflected a 1.8-percent increase in food at home spending and a 9.4-percent increase in food away from home expenditures. The upper two quintiles had increases in overall food expenditures of 1.6 and 3.7 percent, respectively. This contrasts with decreases of 2.2 percent and 1.3 percent in 2013. Again, these were due to larger increases in food away from home expenditures of 3.3 percent and 8.4 percent, reversing the declines of 2.0 percent and 4.5 percent in 2013. Food at home expenditures for the lowest two quintiles did not change much, down 0.3 and 2.6 percent respectively, but like the upper three quintiles, food away from home expenditure increased, up 1.8 percent and 3.5 percent.
There was an increase in food expenditures in all but the youngest (under 25, which declined 5.9 percent) age group in 2014. The 25–34 age group had the highest percentage increase in overall food expenditures from 2013, with spending rising 7.0 percent in 2014. Middle-age groups exhibited relatively modest increases in spending—1.8 percent (age 35–44), 1.7 percent (age 45–54), and 1.3 (age 54–65)—while the older age groups experienced larger increases of 4.7 percent (age 65–74) and 4.9 percent (age 75 and older). Results were more mixed for 2013, with three age groups showing declines.
Notes
Statistical Tables
| Table 1. Quintiles of income before taxes: Average annual expenditures and characteristics, Consumer Expenditure Survey, 2014 | ||||||
|---|---|---|---|---|---|---|
| Item | All consumer units | Lowest 20 percent | Second 20 percent | Third 20 percent | Fourth 20 percent | Highest 20 percent |
Number of consumer units (in thousands) | 127,006 | 25,364 | 25,384 | 25,499 | 25,349 | 25,410 |
Lower limit | (1) | (1) | $18,362 | $35,681 | $59,549 | $99,620 |
Consumer unit characteristics: | ||||||
Income before taxes | $66,877 | $10,308 | $27,028 | $47,056 | $76,988 | $172,952 |
Age of reference person | 50.3 | 51.1 | 53.6 | 49.8 | 48.3 | 48.5 |
Average number in consumer unit: | ||||||
People | 2.5 | 1.7 | 2.2 | 2.5 | 2.8 | 3.2 |
Children under 18 | .6 | .4 | .5 | .6 | .7 | .8 |
Adults 65 and older | .4 | .4 | .5 | .4 | .3 | .2 |
Earners | 1.3 | .5 | .8 | 1.3 | 1.7 | 2.1 |
Vehicles | 1.9 | .9 | 1.4 | 1.9 | 2.3 | 2.8 |
Percent homeowner | 63 | 39 | 53 | 61 | 74 | 86 |
Average annual expenditures | $53,495 | $23,713 | $33,546 | $45,395 | $60,417 | $104,363 |
Food | 6,759 | 3,667 | 4,754 | 5,992 | 7,779 | 11,595 |
Food at home | 3,971 | 2,506 | 3,138 | 3,670 | 4,501 | 6,039 |
Cereals and bakery products | 519 | 344 | 411 | 479 | 577 | 783 |
Meats, poultry, fish, and eggs | 892 | 574 | 738 | 835 | 1,023 | 1,288 |
Dairy products | 423 | 268 | 327 | 410 | 476 | 635 |
Fruits and vegetables | 756 | 452 | 590 | 690 | 856 | 1,190 |
Other food at home | 1,382 | 867 | 1,073 | 1,257 | 1,569 | 2,143 |
Food away from home | 2,787 | 1,162 | 1,616 | 2,322 | 3,277 | 5,555 |
Alcoholic beverages | 463 | 178 | 211 | 341 | 533 | 1,049 |
Housing | 17,798 | 9,643 | 12,508 | 15,448 | 19,568 | 31,812 |
Shelter | 10,491 | 5,873 | 7,243 | 8,913 | 11,286 | 19,133 |
Owned dwellings | 6,149 | 1,925 | 3,017 | 4,436 | 7,175 | 14,190 |
Rented dwellings | 3,631 | 3,779 | 3,979 | 4,098 | 3,450 | 2,849 |
Other lodging | 710 | 169 | 248 | 379 | 660 | 2,095 |
Utilities, fuels, and public services | 3,921 | 2,387 | 3,230 | 3,805 | 4,505 | 5,674 |
Household operations | 1,174 | 465 | 638 | 802 | 1,229 | 2,736 |
Housekeeping supplies | 632 | 325 | 501 | 545 | 757 | 1,032 |
Household furnishings and equipment | 1,581 | 593 | 896 | 1,384 | 1,792 | 3,236 |
Apparel and services | 1,786 | 786 | 1,122 | 1,534 | 1,858 | 3,625 |
Transportation | 9,073 | 3,555 | 5,696 | 8,475 | 10,844 | 16,788 |
Vehicle purchases (net outlay) | 3,301 | 1,149 | 1,737 | 3,207 | 3,905 | 6,503 |
Gasoline and motor oil | 2,468 | 1,160 | 1,842 | 2,437 | 3,111 | 3,789 |
Other vehicle expenses | 2,723 | 1,040 | 1,868 | 2,419 | 3,245 | 5,039 |
Public and other transportation | 581 | 207 | 250 | 412 | 583 | 1,456 |
Healthcare | 4,290 | 1,868 | 3,252 | 4,026 | 5,082 | 7,219 |
Entertainment | 2,728 | 1,108 | 1,566 | 2,365 | 2,968 | 5,629 |
Personal care products and services | 645 | 297 | 432 | 542 | 724 | 1,230 |
Reading | 103 | 48 | 71 | 84 | 112 | 201 |
Education | 1,236 | 922 | 416 | 592 | 1,022 | 3,227 |
Tobacco products and smoking supplies | 319 | 275 | 330 | 348 | 363 | 280 |
Miscellaneous | 782 | 360 | 459 | 676 | 904 | 1,510 |
Cash contributions | 1,788 | 506 | 1,134 | 1,419 | 1,913 | 3,966 |
Personal insurance and pensions | 5,726 | 501 | 1,594 | 3,553 | 6,746 | 16,232 |
Life and other personal insurance | 327 | 87 | 172 | 206 | 344 | 828 |
Pensions and Social Security | 5,399 | 414 | 1,423 | 3,348 | 6,402 | 15,403 |
(1) Not applicable Source: U.S. Bureau of Labor Statistics. | ||||||
(1) Not applicable
Source: U.S. Bureau of Labor Statistics.
| Table 2. Income before taxes: Average annual expenditures and characteristics, Consumer Expenditure Survey, 2014 | ||||||||||
|---|---|---|---|---|---|---|---|---|---|---|
| Item | All consumer units | Less than $5,000 | $5,000 to $9,999 | $10,000 to $14,999 | $15,000 to $19,999 | $20,000 to $29,999 | $30,000 to $39,999 | $40,000 to $49,999 | $50,000 to $69,999 | $70,000 and more |
Number of consumer units (in thousands) | 127,006 | 6,115 | 4,980 | 8,243 | 8,243 | 14,916 | 13,122 | 11,086 | 18,036 | 42,265 |
Consumer unit characteristics: | ||||||||||
Income before taxes | $66,877 | $2,392 | $7,987 | $12,876 | $17,411 | $24,946 | $34,701 | $44,679 | $59,111 | $137,249 |
Age of reference person | 50.3 | 45.6 | 46.0 | 54.8 | 56.6 | 53.7 | 52.0 | 49.3 | 49.1 | 48.4 |
Average number in consumer unit: | ||||||||||
People | 2.5 | 1.6 | 1.8 | 1.6 | 1.8 | 2.1 | 2.3 | 2.5 | 2.6 | 3.0 |
Children under 18 | .6 | .3 | .5 | .3 | .4 | .5 | .6 | .6 | .6 | .8 |
Adults 65 and older | .4 | .2 | .2 | .4 | .5 | .5 | .5 | .4 | .4 | .2 |
Earners | 1.3 | .5 | .5 | .4 | .5 | .8 | 1.0 | 1.3 | 1.5 | 1.9 |
Vehicles | 1.9 | .8 | .8 | .8 | 1.1 | 1.4 | 1.6 | 1.8 | 2.1 | 2.6 |
Percent homeowner | 63 | 33 | 30 | 41 | 51 | 51 | 57 | 59 | 67 | 82 |
Average annual expenditures | $53,495 | $23,570 | $20,818 | $22,862 | $27,324 | $32,048 | $37,846 | $43,775 | $51,242 | $87,962 |
Food | 6,759 | 3,618 | 3,314 | 3,473 | 3,939 | 4,432 | 5,194 | 5,936 | 6,486 | 10,116 |
Food at home | 3,971 | 2,390 | 2,305 | 2,470 | 2,647 | 2,951 | 3,339 | 3,688 | 3,925 | 5,427 |
Cereals and bakery products | 519 | 306 | 298 | 354 | 377 | 385 | 444 | 486 | 503 | 700 |
Meats, poultry, fish, and eggs | 892 | 577 | 536 | 582 | 570 | 710 | 755 | 833 | 898 | 1,185 |
Dairy products | 423 | 245 | 239 | 262 | 298 | 313 | 337 | 416 | 439 | 568 |
Fruits and vegetables | 756 | 458 | 406 | 429 | 480 | 557 | 627 | 706 | 734 | 1,055 |
Other food at home | 1,382 | 804 | 826 | 842 | 921 | 986 | 1,176 | 1,248 | 1,352 | 1,919 |
Food away from home | 2,787 | 1,227 | 1,009 | 1,003 | 1,293 | 1,481 | 1,855 | 2,247 | 2,561 | 4,689 |
Alcoholic beverages | 463 | 221 | 133 | 140 | 198 | 192 | 252 | 323 | 385 | 850 |
Housing | 17,798 | 9,543 | 8,959 | 9,426 | 10,814 | 12,129 | 13,539 | 15,138 | 17,028 | 27,290 |
Shelter | 10,491 | 6,048 | 5,589 | 5,687 | 6,290 | 7,061 | 7,790 | 8,882 | 9,799 | 16,233 |
Owned dwellings | 6,149 | 1,924 | 1,617 | 1,867 | 2,402 | 2,795 | 3,581 | 4,198 | 5,556 | 11,606 |
Rented dwellings | 3,631 | 3,981 | 3,858 | 3,639 | 3,676 | 4,054 | 3,878 | 4,273 | 3,812 | 3,072 |
Other lodging | 710 | 144 | 114 | 181 | 212 | 211 | 331 | 410 | 431 | 1,555 |
Utilities, fuels, and public services | 3,921 | 2,256 | 2,065 | 2,416 | 2,818 | 3,169 | 3,477 | 3,735 | 4,113 | 5,258 |
Household operations | 1,174 | 371 | 405 | 465 | 615 | 639 | 681 | 745 | 960 | 2,172 |
Housekeeping supplies | 632 | 278 | 264 | 361 | 358 | 449 | 535 | 527 | 630 | 920 |
Household furnishings and equipment | 1,581 | 590 | 635 | 496 | 731 | 810 | 1,056 | 1,249 | 1,527 | 2,708 |
Apparel and services | 1,786 | 930 | 667 | 741 | 791 | 960 | 1,321 | 1,518 | 1,602 | 2,928 |
Transportation | 9,073 | 3,276 | 3,090 | 3,538 | 4,203 | 5,749 | 6,435 | 8,289 | 9,488 | 14,579 |
Vehicle purchases (net outlay) | 3,301 | 980 | 1,179 | 1,253 | 1,195 | 1,906 | 1,970 | 3,151 | 3,442 | 5,582 |
Gasoline and motor oil | 2,468 | 1,117 | 1,045 | 1,125 | 1,392 | 1,737 | 2,175 | 2,388 | 2,739 | 3,558 |
Other vehicle expenses | 2,723 | 988 | 694 | 987 | 1,350 | 1,863 | 1,969 | 2,336 | 2,829 | 4,325 |
Public and other transportation | 581 | 191 | 172 | 173 | 267 | 244 | 320 | 414 | 479 | 1,114 |
Healthcare | 4,290 | 1,568 | 1,300 | 1,822 | 2,816 | 3,124 | 3,539 | 3,709 | 4,702 | 6,417 |
Entertainment | 2,728 | 1,085 | 991 | 1,047 | 1,284 | 1,407 | 1,969 | 2,131 | 2,548 | 4,655 |
Personal care products and services | 645 | 295 | 238 | 293 | 344 | 411 | 482 | 528 | 570 | 1,048 |
Reading | 103 | 37 | 32 | 42 | 75 | 62 | 80 | 78 | 92 | 171 |
Education | 1,236 | 1,547 | 862 | 798 | 504 | 367 | 530 | 444 | 764 | 2,394 |
Tobacco products and smoking supplies | 319 | 267 | 287 | 257 | 291 | 336 | 345 | 331 | 356 | 315 |
Miscellaneous | 782 | 498 | 240 | 203 | 489 | 391 | 577 | 726 | 833 | 1,248 |
Cash contributions | 1,788 | 444 | 373 | 489 | 800 | 1,108 | 1,216 | 1,340 | 1,643 | 3,193 |
Personal insurance and pensions | 5,726 | 240 | 332 | 594 | 775 | 1,380 | 2,366 | 3,284 | 4,743 | 12,758 |
Life and other personal insurance | 327 | 84 | 45 | 81 | 127 | 131 | 227 | 206 | 251 | 648 |
Pensions and Social Security | 5,399 | 156 | 288 | 514 | 648 | 1,249 | 2,139 | 3,078 | 4,492 | 12,111 |
Source: U.S. Bureau of Labor Statistics. | ||||||||||
Source: U.S. Bureau of Labor Statistics.
| Table 3. Higher income before taxes: Average annual expenditures and characteristics, Consumer Expenditure Survey, 2014 | ||||||||
|---|---|---|---|---|---|---|---|---|
| Item | All consumer units | Less than $70,000 | $70,000 to $79,999 | $80,000 to $99,999 | $100,000 and more | $100,000to $119,999 | $120,000 to $149,999 | $150,000 and more |
Number of consumer units (in thousands) | 127,006 | 84,741 | 6,771 | 9,869 | 25,625 | 8,271 | 6,332 | 11,022 |
Consumer unit characteristics: | ||||||||
Income before taxes | $66,877 | $31,778 | $74,748 | $88,881 | $172,392 | $108,773 | $133,145 | $242,681 |
Age of reference person | 50.3 | 51.2 | 48.6 | 48.1 | 48.5 | 47.9 | 48.4 | 48.9 |
Average number in consumer unit: | ||||||||
People | 2.5 | 2.2 | 2.8 | 2.8 | 3.2 | 3.1 | 3.2 | 3.2 |
Children under 18 | .6 | .5 | .7 | .7 | .8 | .8 | .8 | .8 |
Adults 65 and older | .4 | .4 | .3 | .3 | .2 | .2 | .2 | .2 |
Earners | 1.3 | .9 | 1.7 | 1.8 | 2.1 | 1.9 | 2.1 | 2.1 |
Vehicles | 1.9 | 1.5 | 2.2 | 2.5 | 2.8 | 2.6 | 2.8 | 2.8 |
Percent homeowner | 63 | 53 | 72 | 78 | 86 | 81 | 88 | 89 |
Average annual expenditures | $53,495 | $36,081 | $58,466 | $67,058 | $104,244 | $78,461 | $92,162 | $130,513 |
Food | 6,759 | 4,983 | 7,325 | 8,630 | 11,598 | 9,540 | 10,722 | 13,659 |
Food at home | 3,971 | 3,196 | 4,022 | 5,006 | 6,036 | 5,306 | 6,054 | 6,555 |
Cereals and bakery products | 519 | 423 | 511 | 639 | 784 | 684 | 797 | 848 |
Meats, poultry, fish, and eggs | 892 | 735 | 927 | 1,144 | 1,281 | 1,191 | 1,287 | 1,343 |
Dairy products | 423 | 346 | 432 | 506 | 638 | 567 | 649 | 682 |
Fruits and vegetables | 756 | 596 | 749 | 958 | 1,191 | 1,031 | 1,193 | 1,304 |
Other food at home | 1,382 | 1,097 | 1,403 | 1,759 | 2,143 | 1,833 | 2,127 | 2,377 |
Food away from home | 2,787 | 1,787 | 3,303 | 3,624 | 5,562 | 4,234 | 4,668 | 7,105 |
Alcoholic beverages | 463 | 258 | 541 | 596 | 1,056 | 770 | 791 | 1,435 |
Housing | 17,798 | 13,037 | 19,193 | 21,340 | 31,760 | 24,198 | 27,921 | 39,632 |
Shelter | 10,491 | 7,627 | 11,142 | 12,291 | 19,096 | 14,139 | 16,167 | 24,498 |
Owned dwellings | 6,149 | 3,427 | 6,917 | 8,252 | 14,136 | 9,928 | 12,270 | 18,367 |
Rented dwellings | 3,631 | 3,910 | 3,586 | 3,231 | 2,875 | 3,310 | 2,616 | 2,698 |
Other lodging | 710 | 289 | 639 | 807 | 2,084 | 901 | 1,281 | 3,433 |
Utilities, fuels, and public services | 3,921 | 3,253 | 4,548 | 4,696 | 5,662 | 5,029 | 5,447 | 6,261 |
Household operations | 1,174 | 676 | 1,210 | 1,407 | 2,723 | 1,689 | 2,202 | 3,799 |
Housekeeping supplies | 632 | 478 | 599 | 888 | 1,030 | 968 | 948 | 1,129 |
Household furnishings and equipment | 1,581 | 1,003 | 1,694 | 2,058 | 3,249 | 2,373 | 3,157 | 3,945 |
Apparel and services | 1,786 | 1,184 | 1,624 | 2,203 | 3,629 | 2,489 | 3,222 | 4,718 |
Transportation | 9,073 | 6,306 | 10,673 | 11,593 | 16,815 | 13,816 | 15,950 | 19,544 |
Vehicle purchases (net outlay) | 3,301 | 2,163 | 3,933 | 4,310 | 6,508 | 5,597 | 6,256 | 7,337 |
Gasoline and motor oil | 2,468 | 1,925 | 2,986 | 3,325 | 3,799 | 3,607 | 3,849 | 3,914 |
Other vehicle expenses | 2,723 | 1,903 | 3,259 | 3,308 | 5,051 | 3,819 | 4,804 | 6,102 |
Public and other transportation | 581 | 315 | 496 | 649 | 1,457 | 794 | 1,041 | 2,192 |
Healthcare | 4,290 | 3,226 | 4,841 | 5,470 | 7,205 | 5,878 | 7,155 | 8,232 |
Entertainment | 2,728 | 1,748 | 3,111 | 3,301 | 5,625 | 4,183 | 4,884 | 7,112 |
Personal care products and services | 645 | 438 | 686 | 848 | 1,234 | 939 | 1,176 | 1,483 |
Reading | 103 | 69 | 111 | 132 | 202 | 155 | 181 | 249 |
Education | 1,236 | 657 | 822 | 1,352 | 3,215 | 1,691 | 2,272 | 4,903 |
Tobacco products and smoking supplies | 319 | 321 | 378 | 350 | 284 | 366 | 304 | 210 |
Miscellaneous | 782 | 548 | 665 | 989 | 1,505 | 1,109 | 1,401 | 1,868 |
Cash contributions | 1,788 | 1,088 | 1,760 | 2,233 | 3,941 | 2,752 | 2,816 | 5,479 |
Personal insurance and pensions | 5,726 | 2,218 | 6,735 | 8,021 | 16,175 | 10,574 | 13,367 | 21,990 |
Life and other personal insurance | 327 | 167 | 323 | 426 | 818 | 520 | 694 | 1,114 |
Pensions and Social Security | 5,399 | 2,051 | 6,412 | 7,595 | 15,356 | 10,054 | 12,673 | 20,876 |
Source: U.S. Bureau of Labor Statistics. | ||||||||
Source: U.S. Bureau of Labor Statistics.
| Table 4. Age of reference person: Average annual expenditures and characteristics, Consumer Expenditure Survey, 2014 | |||||||||
|---|---|---|---|---|---|---|---|---|---|
| Item | All consumer units | Under 25 years | 25-34 years | 35-44 years | 45-54 years | 55-64 years | 65 years and older | 65-74 years | 75 years and older |
Number of consumer units (in thousands) | 127,006 | 8,405 | 20,594 | 21,778 | 23,556 | 23,466 | 29,207 | 16,648 | 12,559 |
Consumer unit characteristics: | |||||||||
Income before taxes | $66,877 | $30,081 | $61,042 | $84,094 | $87,859 | $75,241 | $45,100 | $52,366 | $35,467 |
Age of reference person | 50.3 | 21.6 | 29.7 | 39.6 | 49.8 | 59.3 | 74.2 | 68.8 | 81.4 |
Average number in consumer unit: | |||||||||
People | 2.5 | 2.1 | 2.8 | 3.3 | 2.8 | 2.2 | 1.8 | 1.9 | 1.6 |
Children under 18 | .6 | .4 | 1.0 | 1.4 | .6 | .2 | .1 | .1 | (1) |
Adults 65 and older | .4 | (1) | (1) | (1) | .1 | .1 | 1.4 | 1.4 | 1.4 |
Earners | 1.3 | 1.3 | 1.5 | 1.6 | 1.7 | 1.3 | .5 | .7 | .3 |
Vehicles | 1.9 | 1.1 | 1.6 | 1.9 | 2.2 | 2.1 | 1.7 | 1.9 | 1.4 |
Percent homeowner | 63 | 11 | 39 | 58 | 70 | 77 | 80 | 81 | 80 |
Average annual expenditures | $53,495 | $32,179 | $49,547 | $62,512 | $65,651 | $56,267 | $43,635 | $48,885 | $36,673 |
Food | 6,759 | 4,423 | 6,632 | 8,063 | 8,038 | 6,800 | 5,463 | 6,303 | 4,349 |
Food at home | 3,971 | 2,497 | 3,711 | 4,675 | 4,644 | 4,109 | 3,399 | 3,735 | 2,952 |
Cereals and bakery products | 519 | 367 | 460 | 622 | 611 | 503 | 468 | 504 | 419 |
Meats, poultry, fish, and eggs | 892 | 547 | 852 | 1,046 | 1,079 | 923 | 725 | 810 | 611 |
Dairy products | 423 | 263 | 399 | 498 | 484 | 431 | 376 | 404 | 340 |
Fruits and vegetables | 756 | 449 | 719 | 882 | 848 | 778 | 685 | 742 | 609 |
Other food at home | 1,382 | 872 | 1,283 | 1,626 | 1,623 | 1,475 | 1,145 | 1,275 | 973 |
Food away from home | 2,787 | 1,926 | 2,921 | 3,388 | 3,394 | 2,691 | 2,064 | 2,567 | 1,397 |
Alcoholic beverages | 463 | 303 | 529 | 505 | 559 | 457 | 354 | 455 | 219 |
Housing | 17,798 | 11,459 | 17,404 | 21,222 | 20,781 | 18,006 | 14,779 | 15,838 | 13,375 |
Shelter | 10,491 | 7,893 | 10,726 | 12,873 | 12,397 | 10,183 | 8,005 | 8,498 | 7,350 |
Owned dwellings | 6,149 | 1,106 | 4,210 | 7,667 | 8,293 | 6,973 | 5,444 | 5,945 | 4,781 |
Rented dwellings | 3,631 | 6,568 | 6,144 | 4,615 | 3,143 | 2,098 | 1,907 | 1,732 | 2,139 |
Other lodging | 710 | 219 | 372 | 592 | 961 | 1,112 | 653 | 821 | 431 |
Utilities, fuels, and public services | 3,921 | 1,949 | 3,319 | 4,309 | 4,644 | 4,311 | 3,726 | 3,966 | 3,408 |
Household operations | 1,174 | 450 | 1,433 | 1,722 | 1,076 | 951 | 1,048 | 939 | 1,192 |
Housekeeping supplies | 632 | 229 | 492 | 629 | 734 | 782 | 652 | 723 | 557 |
Household furnishings and equipment | 1,581 | 939 | 1,434 | 1,690 | 1,930 | 1,778 | 1,348 | 1,711 | 868 |
Apparel and services | 1,786 | 1,285 | 1,914 | 2,250 | 2,247 | 1,789 | 1,101 | 1,417 | 683 |
Transportation | 9,073 | 6,167 | 8,908 | 10,617 | 11,230 | 9,321 | 6,942 | 8,338 | 5,091 |
Vehicle purchases (net outlay) | 3,301 | 2,642 | 3,551 | 3,981 | 4,126 | 3,128 | 2,282 | 2,922 | 1,434 |
Gasoline and motor oil | 2,468 | 1,687 | 2,447 | 2,986 | 3,044 | 2,594 | 1,757 | 2,117 | 1,279 |
Other vehicle expenses | 2,723 | 1,521 | 2,386 | 2,967 | 3,383 | 2,967 | 2,400 | 2,657 | 2,059 |
Public and other transportation | 581 | 317 | 523 | 683 | 678 | 633 | 503 | 642 | 320 |
Healthcare | 4,290 | 1,103 | 2,659 | 4,033 | 4,497 | 4,958 | 5,849 | 5,956 | 5,708 |
Entertainment | 2,728 | 1,319 | 2,418 | 3,372 | 3,184 | 2,852 | 2,403 | 2,988 | 1,626 |
Personal care products and services | 645 | 307 | 533 | 741 | 793 | 674 | 609 | 692 | 499 |
Reading | 103 | 44 | 75 | 86 | 93 | 123 | 145 | 152 | 135 |
Education | 1,236 | 2,721 | 1,087 | 1,233 | 2,283 | 1,044 | 225 | 318 | 102 |
Tobacco products and smoking supplies | 319 | 250 | 281 | 324 | 408 | 401 | 225 | 307 | 116 |
Miscellaneous | 782 | 204 | 571 | 858 | 1,086 | 802 | 780 | 807 | 745 |
Cash contributions | 1,788 | 325 | 1,066 | 1,591 | 2,074 | 1,941 | 2,512 | 2,155 | 2,985 |
Personal insurance and pensions | 5,726 | 2,269 | 5,472 | 7,617 | 8,378 | 7,098 | 2,249 | 3,160 | 1,040 |
Life and other personal insurance | 327 | 29 | 131 | 335 | 420 | 520 | 315 | 372 | 240 |
Pensions and Social Security | 5,399 | 2,240 | 5,341 | 7,281 | 7,958 | 6,578 | 1,933 | 2,788 | 800 |
(1) Value is too small to display. Source: U.S. Bureau of Labor Statistics. | |||||||||
(1) Value is too small to display.
Source: U.S. Bureau of Labor Statistics.
| Table 5. Size of consumer unit: Average annual expenditures and characteristics, Consumer Expenditure Survey, 2014 | |||||||
|---|---|---|---|---|---|---|---|
| Item | All consumer units | One person | Two or more people | ||||
| Total | Two people | Three people | Four people | Five or more people | |||
Number of consumer units (in thousands) | 127,006 | 37,884 | 89,122 | 41,647 | 18,777 | 16,126 | 12,571 |
Consumer unit characteristics: | |||||||
Income before taxes | $66,877 | $33,487 | $81,071 | $73,312 | $80,481 | $94,003 | $91,067 |
Age of reference person | 50.3 | 53.3 | 49.0 | 54.9 | 46.1 | 42.2 | 42.3 |
Average number in consumer unit: | |||||||
People | 2.5 | 1.0 | 3.1 | 2.0 | 3.0 | 4.0 | 5.7 |
Children under 18 | .6 | (1) | .8 | .1 | .7 | 1.5 | 2.7 |
Adults 65 and older | .4 | .3 | .4 | .6 | .2 | .1 | .1 |
Earners | 1.3 | .6 | 1.6 | 1.2 | 1.7 | 1.9 | 2.2 |
Vehicles | 1.9 | 1.0 | 2.2 | 2.1 | 2.2 | 2.2 | 2.4 |
Percent homeowner | 63 | 49 | 69 | 73 | 65 | 64 | 65 |
Average annual expenditures | $53,495 | $31,987 | $62,528 | $57,429 | $61,526 | $71,481 | $69,505 |
Food | 6,759 | 3,637 | 8,029 | 6,905 | 7,911 | 9,641 | 9,921 |
Food at home | 3,971 | 2,101 | 4,730 | 3,860 | 4,723 | 5,765 | 6,354 |
Cereals and bakery products | 519 | 279 | 616 | 487 | 596 | 781 | 874 |
Meats, poultry, fish, and eggs | 892 | 418 | 1,084 | 849 | 1,108 | 1,320 | 1,539 |
Dairy products | 423 | 232 | 501 | 415 | 490 | 618 | 656 |
Fruits and vegetables | 756 | 396 | 902 | 744 | 903 | 1,103 | 1,171 |
Other food at home | 1,382 | 776 | 1,628 | 1,365 | 1,627 | 1,944 | 2,114 |
Food away from home | 2,787 | 1,536 | 3,299 | 3,045 | 3,189 | 3,876 | 3,567 |
Alcoholic beverages | 463 | 322 | 520 | 603 | 455 | 527 | 323 |
Housing | 17,798 | 12,348 | 20,102 | 18,280 | 19,924 | 23,217 | 22,405 |
Shelter | 10,491 | 8,057 | 11,525 | 10,582 | 11,322 | 13,406 | 12,539 |
Owned dwellings | 6,149 | 3,600 | 7,233 | 6,640 | 7,061 | 8,415 | 7,938 |
Rented dwellings | 3,631 | 4,098 | 3,433 | 2,925 | 3,630 | 4,140 | 3,913 |
Other lodging | 710 | 359 | 859 | 1,017 | 631 | 851 | 688 |
Utilities, fuels, and public services | 3,921 | 2,448 | 4,546 | 4,070 | 4,596 | 4,980 | 5,494 |
Household operations | 1,174 | 639 | 1,401 | 1,060 | 1,471 | 2,014 | 1,639 |
Housekeeping supplies | 632 | 359 | 743 | 691 | 708 | 834 | 852 |
Household furnishings and equipment | 1,581 | 844 | 1,887 | 1,877 | 1,828 | 1,983 | 1,881 |
Apparel and services | 1,786 | 802 | 2,187 | 1,754 | 2,285 | 2,691 | 2,847 |
Transportation | 9,073 | 4,617 | 10,957 | 10,094 | 10,547 | 12,631 | 12,286 |
Vehicle purchases (net outlay) | 3,301 | 1,470 | 4,079 | 3,807 | 3,576 | 4,998 | 4,552 |
Gasoline and motor oil | 2,468 | 1,300 | 2,965 | 2,552 | 3,006 | 3,406 | 3,705 |
Other vehicle expenses | 2,723 | 1,510 | 3,227 | 2,994 | 3,346 | 3,516 | 3,457 |
Public and other transportation | 581 | 337 | 686 | 741 | 618 | 710 | 571 |
Healthcare | 4,290 | 2,517 | 5,043 | 5,398 | 4,704 | 4,829 | 4,646 |
Entertainment | 2,728 | 1,622 | 3,191 | 2,991 | 3,025 | 3,631 | 3,542 |
Personal care products and services | 645 | 400 | 747 | 718 | 729 | 876 | 698 |
Reading | 103 | 71 | 117 | 140 | 100 | 95 | 94 |
Education | 1,236 | 849 | 1,400 | 984 | 1,733 | 1,785 | 1,787 |
Tobacco products and smoking supplies | 319 | 232 | 356 | 336 | 407 | 361 | 341 |
Miscellaneous | 782 | 602 | 859 | 751 | 1,052 | 1,011 | 728 |
Cash contributions | 1,788 | 1,428 | 1,941 | 2,259 | 1,547 | 1,609 | 1,900 |
Personal insurance and pensions | 5,726 | 2,540 | 7,080 | 6,214 | 7,108 | 8,577 | 7,987 |
Life and other personal insurance | 327 | 136 | 409 | 413 | 396 | 469 | 337 |
Pensions and Social Security | 5,399 | 2,405 | 6,671 | 5,802 | 6,712 | 8,108 | 7,649 |
(1) Not applicable. Source: U.S. Bureau of Labor Statistics. | |||||||
(1) Not applicable.
Source: U.S. Bureau of Labor Statistics.
| Table 6. Composition of consumer unit: Average annual expenditures and characteristics, Consumer Expenditure Survey, 2014 | ||||||||||
|---|---|---|---|---|---|---|---|---|---|---|
| Item | All consumer units | Married couple consumer units | One parent, at least one child under 18 | Single person and other consumer units | ||||||
| Total | Married couple only | Married couple with children | Other married couple consumer units | |||||||
| Total | Oldest child under 6 | Oldest child 6 to 17 | Oldest child 18 or older | |||||||
Number of consumer units (in thousands) | 127,006 | 61,051 | 27,386 | 28,169 | 5,423 | 13,852 | 8,894 | 5,495 | 7,355 | 58,601 |
Consumer unit characteristics: | ||||||||||
Income before taxes | $66,877 | $93,538 | $82,947 | $104,480 | $93,320 | $104,633 | $111,047 | $90,225 | $36,552 | $42,908 |
Age of reference person | 50.3 | 51.1 | 59.1 | 43.3 | 32.3 | 41.1 | 53.4 | 51.3 | 39.1 | 50.8 |
Average number in consumer unit: | ||||||||||
People | 2.5 | 3.2 | 2.0 | 4.0 | 3.5 | 4.2 | 3.9 | 4.9 | 3.0 | 1.7 |
Children under 18 | .6 | .8 | (1) | 1.5 | 1.5 | 2.2 | .6 | 1.4 | 1.8 | .2 |
Adults 65 and older | .4 | .4 | .8 | .1 | (1) | (1) | .2 | .6 | (1) | .3 |
Earners | 1.3 | 1.6 | 1.2 | 2.0 | 1.6 | 1.7 | 2.5 | 2.3 | 1.0 | .9 |
Vehicles | 1.9 | 2.5 | 2.4 | 2.5 | 2.0 | 2.3 | 3.0 | 2.7 | 1.1 | 1.3 |
Percent homeowner | 63 | 78 | 84 | 74 | 63 | 72 | 83 | 74 | 33 | 50 |
Average annual expenditures | $53,495 | $70,196 | $63,462 | $77,072 | $70,115 | $78,763 | $78,398 | $68,909 | $39,979 | $37,696 |
Food | 6,759 | 8,816 | 7,491 | 9,923 | 8,538 | 10,364 | 9,910 | 10,014 | 5,920 | 4,679 |
Food at home | 3,971 | 5,130 | 4,168 | 5,864 | 4,968 | 6,059 | 5,971 | 6,381 | 3,837 | 2,758 |
Cereals and bakery products | 519 | 668 | 527 | 783 | 588 | 841 | 778 | 811 | 531 | 359 |
Meats, poultry, fish, and eggs | 892 | 1,160 | 911 | 1,353 | 1,039 | 1,384 | 1,454 | 1,470 | 938 | 601 |
Dairy products | 423 | 550 | 445 | 637 | 598 | 654 | 627 | 642 | 389 | 293 |
Fruits and vegetables | 756 | 996 | 823 | 1,118 | 1,029 | 1,145 | 1,115 | 1,274 | 651 | 513 |
Other food at home | 1,382 | 1,756 | 1,462 | 1,973 | 1,714 | 2,034 | 1,997 | 2,184 | 1,327 | 992 |
Food away from home | 2,787 | 3,686 | 3,323 | 4,059 | 3,570 | 4,306 | 3,938 | 3,634 | 2,083 | 1,921 |
Alcoholic beverages | 463 | 576 | 670 | 511 | 449 | 497 | 570 | 417 | 225 | 371 |
Housing | 17,798 | 21,896 | 19,358 | 24,533 | 25,810 | 25,295 | 22,607 | 21,029 | 15,175 | 13,843 |
Shelter | 10,491 | 12,338 | 10,812 | 13,999 | 13,922 | 14,888 | 12,662 | 11,429 | 9,077 | 8,743 |
Owned dwellings | 6,149 | 8,650 | 7,659 | 9,848 | 9,151 | 10,422 | 9,379 | 7,446 | 3,337 | 3,897 |
Rented dwellings | 3,631 | 2,638 | 1,916 | 3,223 | 4,315 | 3,424 | 2,244 | 3,233 | 5,465 | 4,436 |
Other lodging | 710 | 1,051 | 1,237 | 928 | 456 | 1,043 | 1,039 | 750 | 276 | 410 |
Utilities, fuels, and public services | 3,921 | 4,861 | 4,382 | 5,205 | 4,156 | 5,177 | 5,887 | 5,484 | 3,500 | 2,994 |
Household operations | 1,174 | 1,618 | 1,122 | 2,145 | 4,275 | 2,035 | 1,017 | 1,390 | 1,074 | 724 |
Housekeeping supplies | 632 | 864 | 814 | 899 | 829 | 870 | 984 | 944 | 500 | 402 |
Household furnishings and equipment | 1,581 | 2,215 | 2,228 | 2,285 | 2,628 | 2,323 | 2,057 | 1,782 | 1,023 | 981 |
Apparel and services | 1,786 | 2,395 | 1,880 | 2,837 | 2,701 | 3,143 | 2,396 | 2,787 | 1,762 | 1,143 |
Transportation | 9,073 | 12,293 | 11,128 | 13,327 | 11,949 | 12,725 | 15,121 | 12,834 | 6,793 | 5,995 |
Vehicle purchases (net outlay) | 3,301 | 4,610 | 4,192 | 4,990 | 4,980 | 4,633 | 5,554 | 4,739 | 2,576 | 2,029 |
Gasoline and motor oil | 2,468 | 3,247 | 2,762 | 3,657 | 2,937 | 3,675 | 4,070 | 3,559 | 1,949 | 1,722 |
Other vehicle expenses | 2,723 | 3,646 | 3,319 | 3,923 | 3,346 | 3,629 | 4,744 | 3,897 | 1,978 | 1,843 |
Public and other transportation | 581 | 790 | 855 | 756 | 686 | 789 | 753 | 639 | 291 | 401 |
Healthcare | 4,290 | 6,026 | 6,549 | 5,642 | 4,746 | 5,517 | 6,383 | 5,389 | 2,042 | 2,761 |
Entertainment | 2,728 | 3,689 | 3,381 | 4,077 | 3,082 | 4,689 | 3,648 | 3,240 | 1,779 | 1,837 |
Personal care products and services | 645 | 835 | 808 | 870 | 704 | 933 | 856 | 797 | 555 | 456 |
Reading | 103 | 133 | 159 | 115 | 74 | 122 | 128 | 92 | 65 | 77 |
Education | 1,236 | 1,635 | 1,076 | 2,275 | 1,051 | 2,218 | 3,105 | 1,139 | 862 | 867 |
Tobacco products and smoking supplies | 319 | 322 | 305 | 295 | 224 | 232 | 434 | 546 | 247 | 325 |
Miscellaneous | 782 | 943 | 809 | 1,078 | 842 | 1,211 | 1,000 | 921 | 599 | 636 |
Cash contributions | 1,788 | 2,313 | 2,793 | 1,960 | 1,597 | 2,104 | 1,956 | 1,732 | 962 | 1,345 |
Personal insurance and pensions | 5,726 | 8,325 | 7,053 | 9,631 | 8,347 | 9,712 | 10,286 | 7,973 | 2,992 | 3,361 |
Life and other personal insurance | 327 | 526 | 546 | 520 | 307 | 531 | 634 | 461 | 123 | 145 |
Pensions and Social Security | 5,399 | 7,799 | 6,507 | 9,110 | 8,040 | 9,182 | 9,652 | 7,512 | 2,868 | 3,216 |
(1) Value is too small to display. Source: U.S. Bureau of Labor Statistics. | ||||||||||
(1) Value is too small to display.
Source: U.S. Bureau of Labor Statistics.
| Table 7. Number of earners in consumer unit: Average annual expenditures and characteristics, Consumer Expenditure Survey, 2014 | |||||||
|---|---|---|---|---|---|---|---|
| Item | All consumer units | Single consumers | Consumer units of two or more people | ||||
| No earner | One earner | No earner | One earner | Two earners | Three or more earners | ||
Number of consumer units (in thousands) | 127,006 | 15,880 | 22,004 | 13,107 | 26,814 | 38,766 | 10,434 |
Consumer unit characteristics: | |||||||
Income before taxes | $66,877 | $19,064 | $43,895 | $33,860 | $62,019 | $100,216 | $118,209 |
Age of reference person | 50.3 | 66.6 | 43.8 | 65.2 | 48.3 | 44.4 | 47.4 |
Average number in consumer unit: | |||||||
People | 2.5 | 1.0 | 1.0 | 2.3 | 3.0 | 3.0 | 4.4 |
Children under 18 | .6 | (1) | (1) | .3 | 1.1 | .8 | 1.0 |
Adults 65 and older | .4 | .6 | .1 | 1.3 | .4 | .1 | .1 |
Earners | 1.3 | (1) | 1.0 | n.a. | 1.0 | 2.0 | 3.4 |
Vehicles | 1.9 | .9 | 1.1 | 1.8 | 1.9 | 2.3 | 3.0 |
Percent homeowner | 63 | 57 | 43 | 75 | 61 | 70 | 75 |
Average annual expenditures | $53,495 | $25,565 | $36,585 | $43,418 | $54,929 | $69,785 | $79,382 |
Food | 6,759 | 3,135 | 3,982 | 6,140 | 7,415 | 8,542 | 10,218 |
Food at home | 3,971 | 2,080 | 2,115 | 4,060 | 4,608 | 4,713 | 6,075 |
Cereals and bakery products | 519 | 291 | 271 | 534 | 599 | 620 | 764 |
Meats, poultry, fish, and eggs | 892 | 428 | 411 | 942 | 1,070 | 1,055 | 1,440 |
Dairy products | 423 | 226 | 236 | 429 | 497 | 499 | 616 |
Fruits and vegetables | 756 | 400 | 394 | 770 | 888 | 894 | 1,155 |
Other food at home | 1,382 | 734 | 804 | 1,385 | 1,554 | 1,647 | 2,099 |
Food away from home | 2,787 | 1,056 | 1,866 | 2,080 | 2,808 | 3,828 | 4,143 |
Alcoholic beverages | 463 | 148 | 442 | 322 | 394 | 660 | 566 |
Housing | 17,798 | 10,628 | 13,588 | 14,654 | 18,480 | 22,305 | 22,920 |
Shelter | 10,491 | 6,434 | 9,228 | 7,649 | 10,529 | 13,124 | 13,012 |
Owned dwellings | 6,149 | 3,089 | 3,968 | 4,830 | 5,964 | 8,553 | 8,607 |
Rented dwellings | 3,631 | 3,052 | 4,853 | 2,090 | 3,829 | 3,608 | 3,449 |
Other lodging | 710 | 293 | 407 | 729 | 736 | 963 | 956 |
Utilities, fuels, and public services | 3,921 | 2,458 | 2,442 | 3,922 | 4,231 | 4,619 | 5,873 |
Household operations | 1,174 | 701 | 594 | 1,008 | 1,141 | 1,772 | 1,181 |
Housekeeping supplies | 632 | 373 | 350 | 677 | 758 | 721 | 880 |
Household furnishings and equipment | 1,581 | 663 | 974 | 1,398 | 1,821 | 2,069 | 1,974 |
Apparel and services | 1,786 | 632 | 920 | 1,203 | 2,065 | 2,424 | 2,882 |
Transportation | 9,073 | 3,030 | 5,764 | 7,589 | 9,283 | 12,070 | 15,458 |
Vehicle purchases (net outlay) | 3,301 | 695 | 2,030 | 2,747 | 3,426 | 4,525 | 5,778 |
Gasoline and motor oil | 2,468 | 828 | 1,641 | 1,915 | 2,564 | 3,240 | 4,291 |
Other vehicle expenses | 2,723 | 1,244 | 1,704 | 2,379 | 2,732 | 3,518 | 4,593 |
Public and other transportation | 581 | 263 | 389 | 548 | 562 | 788 | 796 |
Healthcare | 4,290 | 3,045 | 2,136 | 6,079 | 4,517 | 4,934 | 5,506 |
Entertainment | 2,728 | 1,316 | 1,837 | 2,469 | 2,933 | 3,435 | 3,859 |
Personal care products and services | 645 | 333 | 447 | 576 | 668 | 811 | 929 |
Reading | 103 | 82 | 62 | 146 | 97 | 121 | 117 |
Education | 1,236 | 674 | 975 | 441 | 1,177 | 1,552 | 2,615 |
Tobacco products and smoking supplies | 319 | 201 | 253 | 297 | 341 | 351 | 490 |
Miscellaneous | 782 | 578 | 619 | 687 | 829 | 929 | 884 |
Cash contributions | 1,788 | 1,466 | 1,401 | 2,238 | 1,768 | 2,004 | 1,781 |
Personal insurance and pensions | 5,726 | 295 | 4,161 | 578 | 4,962 | 9,647 | 11,155 |
Life and other personal insurance | 327 | 149 | 126 | 293 | 353 | 455 | 525 |
Pensions and Social Security | 5,399 | 146 | 4,035 | 285 | 4,609 | 9,192 | 10,630 |
(1) Not applicable. Source: U.S. Bureau of Labor Statistics. | |||||||
(1) Not applicable.
Source: U.S. Bureau of Labor Statistics.
| Table 8. Housing tenure and type of area: Average annual expenditures and characteristics, Consumer Expenditure Survey, 2014 | |||||||||
|---|---|---|---|---|---|---|---|---|---|
| Item | All consumer units | Housing tenure | Type of area | ||||||
| Homeowner | Renter | Urban | Rural | ||||||
| Total | Homeowner with mortgage | Homeowner without mortgage | Total | Central City | Other Urban | ||||
Number of consumer units (in thousands) | 127,006 | 79,596 | 46,379 | 33,218 | 47,409 | 116,192 | 38,608 | 77,584 | 10,813 |
Consumer unit characteristics: | |||||||||
Income before taxes | $66,877 | $82,233 | $97,309 | $61,184 | $41,095 | $68,306 | $58,929 | $72,972 | $51,525 |
Age of reference person | 50.3 | 55.3 | 49.7 | 63.1 | 41.9 | 49.9 | 46.9 | 51.4 | 54.2 |
Average number in consumer unit: | |||||||||
People | 2.5 | 2.6 | 2.8 | 2.2 | 2.3 | 2.5 | 2.3 | 2.5 | 2.5 |
Children under 18 | .6 | .6 | .8 | .3 | .7 | .6 | .5 | .6 | .6 |
Adults 65 and older | .4 | .5 | .3 | .8 | .2 | .3 | .3 | .4 | .5 |
Earners | 1.3 | 1.3 | 1.6 | .9 | 1.2 | 1.3 | 1.2 | 1.3 | 1.2 |
Vehicles | 1.9 | 2.3 | 2.4 | 2.1 | 1.2 | 1.8 | 1.4 | 2.0 | 2.4 |
Percent homeowner | 63 | 100 | 100 | 100 | n.a. | 61 | 47 | 68 | 79 |
Average annual expenditures | $53,495 | $62,226 | $70,807 | $49,737 | $38,749 | $54,436 | $48,454 | $57,358 | $43,212 |
Food | 6,759 | 7,604 | 8,139 | 6,583 | 5,305 | 6,852 | 6,319 | 7,095 | 5,669 |
Food at home | 3,971 | 4,414 | 4,643 | 3,955 | 3,208 | 4,003 | 3,703 | 4,139 | 3,594 |
Cereals and bakery products | 519 | 579 | 602 | 532 | 416 | 521 | 478 | 540 | 499 |
Meats, poultry, fish, and eggs | 892 | 987 | 1,041 | 877 | 727 | 893 | 821 | 925 | 875 |
Dairy products | 423 | 471 | 492 | 428 | 341 | 424 | 388 | 440 | 415 |
Fruits and vegetables | 756 | 839 | 876 | 765 | 612 | 772 | 752 | 780 | 570 |
Other food at home | 1,382 | 1,539 | 1,632 | 1,353 | 1,112 | 1,394 | 1,265 | 1,453 | 1,235 |
Food away from home | 2,787 | 3,190 | 3,496 | 2,628 | 2,097 | 2,848 | 2,616 | 2,956 | 2,075 |
Alcoholic beverages | 463 | 548 | 613 | 423 | 316 | 476 | 467 | 481 | 306 |
Housing | 17,798 | 19,666 | 23,762 | 13,936 | 14,646 | 18,287 | 17,241 | 18,795 | 12,522 |
Shelter | 10,491 | 10,820 | 14,208 | 6,090 | 9,937 | 10,907 | 10,830 | 10,945 | 6,014 |
Owned dwellings | 6,149 | 9,744 | 13,083 | 5,082 | 114 | 6,313 | 4,940 | 6,996 | 4,392 |
Rented dwellings | 3,631 | 100 | 86 | 121 | 9,559 | 3,863 | 5,395 | 3,101 | 1,140 |
Other lodging | 710 | 976 | 1,039 | 888 | 264 | 732 | 496 | 849 | 482 |
Utilities, fuels, and public services | 3,921 | 4,679 | 5,009 | 4,219 | 2,646 | 3,923 | 3,396 | 4,185 | 3,895 |
Household operations | 1,174 | 1,455 | 1,665 | 1,159 | 702 | 1,218 | 1,113 | 1,271 | 694 |
Housekeeping supplies | 632 | 759 | 766 | 744 | 413 | 635 | 532 | 681 | 597 |
Household furnishings and equipment | 1,581 | 1,952 | 2,114 | 1,724 | 948 | 1,604 | 1,369 | 1,713 | 1,322 |
Apparel and services | 1,786 | 2,030 | 2,294 | 1,545 | 1,365 | 1,837 | 1,766 | 1,869 | 1,191 |
Transportation | 9,073 | 10,475 | 11,706 | 8,754 | 6,711 | 9,102 | 7,598 | 9,843 | 8,772 |
Vehicle purchases (net outlay) | 3,301 | 3,722 | 4,261 | 2,969 | 2,595 | 3,309 | 2,732 | 3,596 | 3,220 |
Gasoline and motor oil | 2,468 | 2,851 | 3,201 | 2,362 | 1,826 | 2,436 | 1,920 | 2,694 | 2,810 |
Other vehicle expenses | 2,723 | 3,207 | 3,509 | 2,782 | 1,900 | 2,743 | 2,309 | 2,952 | 2,504 |
Public and other transportation | 581 | 695 | 734 | 642 | 390 | 614 | 637 | 602 | 238 |
Healthcare | 4,290 | 5,567 | 5,495 | 5,674 | 2,144 | 4,290 | 3,402 | 4,731 | 4,289 |
Entertainment | 2,728 | 3,350 | 3,757 | 2,706 | 1,675 | 2,725 | 2,297 | 2,931 | 2,750 |
Personal care products and services | 645 | 760 | 814 | 677 | 450 | 663 | 631 | 677 | 450 |
Reading | 103 | 129 | 124 | 136 | 59 | 104 | 98 | 107 | 94 |
Education | 1,236 | 1,343 | 1,729 | 797 | 1,055 | 1,319 | 1,250 | 1,352 | 342 |
Tobacco products and smoking supplies | 319 | 301 | 287 | 319 | 351 | 303 | 250 | 329 | 494 |
Miscellaneous | 782 | 948 | 1,018 | 866 | 503 | 794 | 661 | 861 | 647 |
Cash contributions | 1,788 | 2,326 | 2,075 | 2,675 | 886 | 1,825 | 1,474 | 2,000 | 1,386 |
Personal insurance and pensions | 5,726 | 7,179 | 8,994 | 4,645 | 3,286 | 5,859 | 5,000 | 6,286 | 4,300 |
Life and other personal insurance | 327 | 447 | 502 | 370 | 126 | 326 | 248 | 365 | 341 |
Pensions and Social Security | 5,399 | 6,732 | 8,492 | 4,275 | 3,160 | 5,533 | 4,752 | 5,921 | 3,959 |
(1) Not applicable. Source: U.S. Bureau of Labor Statistics. | |||||||||
(1) Not applicable.
Source: U.S. Bureau of Labor Statistics.
| Table 9. Race of reference person: Average annual expenditures and characteristics, Consumer Expenditure Survey, 2014 | |||||
|---|---|---|---|---|---|
| Item | All consumer units | White and all other races, and Asian | Black or African-American | ||
| Total | White and all other races(1) | Asian | |||
Number of consumer units (in thousands) | 127,006 | 110,709 | 105,082 | 5,627 | 16,297 |
Consumer unit characteristics: | |||||
Income before taxes | $66,877 | $70,131 | $69,147 | $88,517 | $44,769 |
Age of reference person | 50.3 | 50.6 | 51.0 | 43.9 | 48.1 |
Average number in consumer unit: | |||||
People | 2.5 | 2.5 | 2.5 | 2.8 | 2.5 |
Children under 18 | .6 | .6 | .6 | .7 | .7 |
Adults 65 and older | .4 | .4 | .4 | .3 | .2 |
Earners | 1.3 | 1.3 | 1.3 | 1.5 | 1.2 |
Vehicles | 1.9 | 1.9 | 2.0 | 1.5 | 1.2 |
Percent homeowner | 63 | 65 | 66 | 48 | 44 |
Average annual expenditures | $53,495 | $55,691 | $55,308 | $62,784 | $38,543 |
Food | 6,759 | 7,080 | 7,027 | 8,044 | 4,555 |
Food at home | 3,971 | 4,119 | 4,117 | 4,156 | 2,960 |
Cereals and bakery products | 519 | 540 | 540 | 540 | 377 |
Meats, poultry, fish, and eggs | 892 | 900 | 893 | 1,024 | 833 |
Dairy products | 423 | 450 | 457 | 330 | 240 |
Fruits and vegetables | 756 | 788 | 775 | 1,007 | 537 |
Other food at home | 1,382 | 1,442 | 1,452 | 1,255 | 973 |
Food away from home | 2,787 | 2,961 | 2,910 | 3,888 | 1,595 |
Alcoholic beverages | 463 | 503 | 510 | 372 | 187 |
Housing | 17,798 | 18,299 | 18,078 | 22,445 | 14,383 |
Shelter | 10,491 | 10,792 | 10,548 | 15,341 | 8,442 |
Owned dwellings | 6,149 | 6,529 | 6,450 | 8,005 | 3,565 |
Rented dwellings | 3,631 | 3,485 | 3,332 | 6,336 | 4,626 |
Other lodging | 710 | 778 | 766 | 1,000 | 250 |
Utilities, fuels, and public services | 3,921 | 3,932 | 3,953 | 3,535 | 3,843 |
Household operations | 1,174 | 1,234 | 1,216 | 1,577 | 765 |
Housekeeping supplies | 632 | 661 | 670 | 500 | 431 |
Household furnishings and equipment | 1,581 | 1,680 | 1,690 | 1,492 | 902 |
Apparel and services | 1,786 | 1,823 | 1,775 | 2,683 | 1,531 |
Transportation | 9,073 | 9,406 | 9,413 | 9,279 | 6,812 |
Vehicle purchases (net outlay) | 3,301 | 3,464 | 3,516 | 2,496 | 2,194 |
Gasoline and motor oil | 2,468 | 2,534 | 2,549 | 2,260 | 2,019 |
Other vehicle expenses | 2,723 | 2,795 | 2,785 | 2,975 | 2,232 |
Public and other transportation | 581 | 613 | 563 | 1,548 | 366 |
Healthcare | 4,290 | 4,565 | 4,596 | 3,986 | 2,424 |
Entertainment | 2,728 | 2,866 | 2,903 | 2,205 | 1,782 |
Personal care products and services | 645 | 662 | 659 | 710 | 532 |
Reading | 103 | 112 | 113 | 87 | 43 |
Education | 1,236 | 1,302 | 1,234 | 2,585 | 785 |
Tobacco products and smoking supplies | 319 | 332 | 343 | 136 | 232 |
Miscellaneous | 782 | 829 | 836 | 686 | 465 |
Cash contributions | 1,788 | 1,865 | 1,885 | 1,478 | 1,268 |
Personal insurance and pensions | 5,726 | 6,047 | 5,938 | 8,089 | 3,546 |
Life and other personal insurance | 327 | 342 | 343 | 327 | 225 |
Pensions and Social Security | 5,399 | 5,705 | 5,594 | 7,762 | 3,321 |
(1) All other races includes Native Hawaiian or other Pacific Islander, American Indian or Alaska Native, and approximately 1 percent reporting more than one race. Source: U.S. Bureau of Labor Statistics. | |||||
(1) All other races includes Native Hawaiian or other Pacific Islander, American Indian or Alaska Native, and approximately 1 percent reporting more than one race.
Source: U.S. Bureau of Labor Statistics.
| Table 10. Hispanic or Latino origin of reference person: Average annual expenditures and characteristics, Consumer Expenditure Survey, 2014 | |||||
|---|---|---|---|---|---|
| Item | All consumer units | Hispanic or Latino | Not Hispanic or Latino | ||
| Total | White and all other races | Black or African-American | |||
Number of consumer units (in thousands) | 127,006 | 16,283 | 110,723 | 94,723 | 16,000 |
Consumer unit characteristics: | |||||
Income before taxes | $66,877 | $53,054 | $68,910 | $72,984 | $44,790 |
Age of reference person | 50.3 | 43.9 | 51.2 | 51.7 | 48.1 |
Average number in consumer unit: | |||||
People | 2.5 | 3.2 | 2.4 | 2.3 | 2.5 |
Children under 18 | .6 | 1.0 | .5 | .5 | .7 |
Adults 65 and older | .4 | .2 | .4 | .4 | .2 |
Earners | 1.3 | 1.5 | 1.2 | 1.2 | 1.2 |
Vehicles | 1.9 | 1.6 | 1.9 | 2.0 | 1.2 |
Percent homeowner | 63 | 44 | 65 | 69 | 44 |
Average annual expenditures | $53,495 | $45,561 | $54,661 | $57,403 | $38,356 |
Food | 6,759 | 6,880 | 6,741 | 7,119 | 4,467 |
Food at home | 3,971 | 4,303 | 3,923 | 4,090 | 2,914 |
Cereals and bakery products | 519 | 523 | 518 | 542 | 374 |
Meats, poultry, fish, and eggs | 892 | 1,128 | 857 | 863 | 820 |
Dairy products | 423 | 428 | 423 | 454 | 231 |
Fruits and vegetables | 756 | 869 | 739 | 775 | 523 |
Other food at home | 1,382 | 1,356 | 1,386 | 1,455 | 966 |
Food away from home | 2,787 | 2,577 | 2,818 | 3,029 | 1,553 |
Alcoholic beverages | 463 | 304 | 486 | 537 | 181 |
Housing | 17,798 | 16,207 | 18,031 | 18,649 | 14,365 |
Shelter | 10,491 | 9,909 | 10,576 | 10,940 | 8,423 |
Owned dwellings | 6,149 | 4,065 | 6,455 | 6,939 | 3,592 |
Rented dwellings | 3,631 | 5,591 | 3,343 | 3,135 | 4,577 |
Other lodging | 710 | 253 | 778 | 866 | 254 |
Utilities, fuels, and public services | 3,921 | 3,639 | 3,962 | 3,978 | 3,866 |
Household operations | 1,174 | 883 | 1,217 | 1,296 | 748 |
Housekeeping supplies | 632 | 525 | 648 | 685 | 423 |
Household furnishings and equipment | 1,581 | 1,251 | 1,629 | 1,750 | 905 |
Apparel and services | 1,786 | 1,951 | 1,761 | 1,797 | 1,547 |
Transportation | 9,073 | 8,399 | 9,173 | 9,580 | 6,761 |
Vehicle purchases (net outlay) | 3,301 | 2,894 | 3,361 | 3,565 | 2,151 |
Gasoline and motor oil | 2,468 | 2,584 | 2,451 | 2,523 | 2,027 |
Other vehicle expenses | 2,723 | 2,529 | 2,751 | 2,841 | 2,217 |
Public and other transportation | 581 | 393 | 609 | 650 | 366 |
Healthcare | 4,290 | 2,643 | 4,532 | 4,891 | 2,408 |
Entertainment | 2,728 | 1,695 | 2,879 | 3,064 | 1,778 |
Personal care products and services | 645 | 561 | 657 | 678 | 531 |
Reading | 103 | 57 | 110 | 121 | 43 |
Education | 1,236 | 739 | 1,309 | 1,400 | 771 |
Tobacco products and smoking supplies | 319 | 168 | 341 | 361 | 227 |
Miscellaneous | 782 | 464 | 829 | 890 | 465 |
Cash contributions | 1,788 | 932 | 1,914 | 2,023 | 1,270 |
Personal insurance and pensions | 5,726 | 4,563 | 5,897 | 6,295 | 3,543 |
Life and other personal insurance | 327 | 168 | 351 | 372 | 223 |
Pensions and Social Security | 5,399 | 4,394 | 5,546 | 5,922 | 3,320 |
Source: U.S. Bureau of Labor Statistics. | |||||
Source: U.S. Bureau of Labor Statistics.
| Table 11. Region of residence: Average annual expenditures and characteristics, Consumer Expenditure Survey, 2014 | |||||
|---|---|---|---|---|---|
| Item | All consumer units | Northeast | Midwest | South | West |
Number of consumer units (in thousands) | 127,006 | 23,052 | 28,406 | 47,205 | 28,343 |
Consumer unit characteristics: | |||||
Income before taxes | $66,877 | $75,881 | $65,340 | $61,405 | $70,208 |
Age of reference person | 50.3 | 52.5 | 49.4 | 50.3 | 49.3 |
Average number in consumer unit: | |||||
People | 2.5 | 2.4 | 2.4 | 2.5 | 2.6 |
Children under 18 | .6 | .5 | .6 | .6 | .7 |
Adults 65 and older | .4 | .4 | .3 | .4 | .3 |
Earners | 1.3 | 1.3 | 1.3 | 1.2 | 1.3 |
Vehicles | 1.9 | 1.6 | 2.0 | 1.8 | 1.9 |
Percent homeowner | 63 | 62 | 66 | 65 | 56 |
Average annual expenditures | $53,495 | $59,301 | $51,961 | $49,372 | $57,181 |
Food | 6,759 | 6,854 | 6,898 | 6,378 | 7,175 |
Food at home | 3,971 | 4,090 | 4,123 | 3,709 | 4,164 |
Cereals and bakery products | 519 | 567 | 547 | 487 | 506 |
Meats, poultry, fish, and eggs | 892 | 919 | 884 | 881 | 894 |
Dairy products | 423 | 463 | 473 | 367 | 435 |
Fruits and vegetables | 756 | 800 | 753 | 681 | 847 |
Other food at home | 1,382 | 1,340 | 1,466 | 1,292 | 1,481 |
Food away from home | 2,787 | 2,765 | 2,775 | 2,669 | 3,011 |
Alcoholic beverages | 463 | 523 | 510 | 364 | 531 |
Housing | 17,798 | 21,067 | 16,212 | 16,030 | 19,672 |
Shelter | 10,491 | 13,227 | 9,162 | 8,844 | 12,337 |
Owned dwellings | 6,149 | 7,859 | 5,919 | 5,272 | 6,451 |
Rented dwellings | 3,631 | 4,382 | 2,547 | 2,998 | 5,162 |
Other lodging | 710 | 987 | 697 | 575 | 725 |
Utilities, fuels, and public services | 3,921 | 4,335 | 3,714 | 4,038 | 3,596 |
Household operations | 1,174 | 1,355 | 1,007 | 1,085 | 1,342 |
Housekeeping supplies | 632 | 594 | 705 | 598 | 647 |
Household furnishings and equipment | 1,581 | 1,555 | 1,623 | 1,466 | 1,750 |
Apparel and services | 1,786 | 1,931 | 1,882 | 1,592 | 1,896 |
Transportation | 9,073 | 9,321 | 8,807 | 9,041 | 9,192 |
Vehicle purchases (net outlay) | 3,301 | 3,046 | 3,315 | 3,563 | 3,058 |
Gasoline and motor oil | 2,468 | 2,256 | 2,418 | 2,553 | 2,550 |
Other vehicle expenses | 2,723 | 3,089 | 2,604 | 2,512 | 2,893 |
Public and other transportation | 581 | 931 | 469 | 413 | 691 |
Healthcare | 4,290 | 4,565 | 4,398 | 4,024 | 4,401 |
Entertainment | 2,728 | 2,744 | 2,760 | 2,516 | 3,034 |
Personal care products and services | 645 | 704 | 650 | 577 | 705 |
Reading | 103 | 122 | 111 | 82 | 116 |
Education | 1,236 | 2,129 | 1,158 | 880 | 1,181 |
Tobacco products and smoking supplies | 319 | 313 | 371 | 344 | 231 |
Miscellaneous | 782 | 859 | 769 | 664 | 929 |
Cash contributions | 1,788 | 1,777 | 1,803 | 1,697 | 1,933 |
Personal insurance and pensions | 5,726 | 6,392 | 5,633 | 5,182 | 6,184 |
Life and other personal insurance | 327 | 418 | 339 | 284 | 314 |
Pensions and Social Security | 5,399 | 5,974 | 5,294 | 4,898 | 5,871 |
Source: U.S. Bureau of Labor Statistics. | |||||
Source: U.S. Bureau of Labor Statistics.
| Table 12. Occupation of reference person: Average annual expenditures and characteristics, Consumer Expenditure Survey, 2014 | ||||||||||
|---|---|---|---|---|---|---|---|---|---|---|
| Item | All consumer units | Self employed workers | Wage and salary earners | Retired | All other, including not reporting | |||||
| Total wage and salary earners | Managers and professionals | Technical, sales and clerical workers | Service workers | Construction workers and mechanics | Operators, fabricators and laborers | |||||
Number of consumer units (in thousands) | 127,006 | 8,303 | 75,638 | 28,824 | 19,989 | 15,946 | 3,553 | 7,326 | 24,634 | 18,430 |
Consumer unit characteristics: | ||||||||||
Income before taxes | $66,877 | $108,212 | $77,397 | $107,570 | $65,629 | $51,485 | $62,984 | $54,176 | $39,672 | $41,445 |
Age of reference person | 50.3 | 49.5 | 43.9 | 44.4 | 43.5 | 42.8 | 43.3 | 45.1 | 73.4 | 46.1 |
Average number in consumer unit: | ||||||||||
People | 2.5 | 2.7 | 2.6 | 2.6 | 2.5 | 2.7 | 2.9 | 2.7 | 1.8 | 2.8 |
Children under 18 | .6 | .7 | .7 | .7 | .6 | .8 | .9 | .7 | .1 | .9 |
Adults 65 and older | .4 | .2 | .1 | .1 | .1 | .2 | .1 | .1 | 1.2 | .2 |
Earners | 1.3 | 1.8 | 1.7 | 1.7 | 1.7 | 1.7 | 1.7 | 1.7 | .2 | .6 |
Vehicles | 1.9 | 2.2 | 2.0 | 2.1 | 1.9 | 1.7 | 2.1 | 2.1 | 1.7 | 1.4 |
Percent homeowner | 63 | 72 | 59 | 69 | 56 | 48 | 57 | 55 | 81 | 47 |
Average annual expenditures | $53,495 | $72,838 | $57,904 | $74,277 | $51,508 | $44,543 | $47,539 | $44,795 | $42,715 | $40,930 |
Food | 6,759 | 7,993 | 7,192 | 8,800 | 6,783 | 5,580 | 6,227 | 5,830 | 5,384 | 6,176 |
Food at home | 3,971 | 4,578 | 4,041 | 4,636 | 3,936 | 3,384 | 3,848 | 3,438 | 3,433 | 4,090 |
Cereals and bakery products | 519 | 573 | 526 | 593 | 525 | 449 | 447 | 467 | 459 | 540 |
Meats, poultry, fish, and eggs | 892 | 962 | 909 | 990 | 901 | 777 | 1,021 | 816 | 736 | 985 |
Dairy products | 423 | 506 | 425 | 498 | 409 | 348 | 410 | 347 | 382 | 429 |
Fruits and vegetables | 756 | 909 | 762 | 899 | 721 | 667 | 701 | 565 | 679 | 758 |
Other food at home | 1,382 | 1,627 | 1,419 | 1,654 | 1,380 | 1,143 | 1,268 | 1,243 | 1,178 | 1,378 |
Food away from home | 2,787 | 3,414 | 3,151 | 4,164 | 2,847 | 2,195 | 2,379 | 2,392 | 1,951 | 2,086 |
Alcoholic beverages | 463 | 608 | 534 | 759 | 467 | 298 | 478 | 345 | 324 | 282 |
Housing | 17,798 | 23,345 | 18,968 | 23,881 | 17,036 | 15,307 | 15,652 | 14,458 | 14,894 | 14,374 |
Shelter | 10,491 | 14,291 | 11,385 | 14,573 | 10,040 | 9,300 | 9,372 | 8,028 | 8,080 | 8,328 |
Owned dwellings | 6,149 | 9,466 | 6,556 | 9,442 | 5,372 | 4,303 | 5,048 | 4,066 | 5,463 | 3,901 |
Rented dwellings | 3,631 | 3,308 | 4,152 | 4,007 | 4,153 | 4,655 | 3,953 | 3,726 | 1,877 | 3,983 |
Other lodging | 710 | 1,517 | 677 | 1,124 | 515 | 341 | 371 | 236 | 740 | 444 |
Utilities, fuels, and public services | 3,921 | 4,601 | 4,011 | 4,417 | 3,906 | 3,559 | 3,847 | 3,760 | 3,716 | 3,518 |
Household operations | 1,174 | 1,723 | 1,257 | 1,916 | 1,050 | 730 | 699 | 645 | 1,069 | 726 |
Housekeeping supplies | 632 | 859 | 611 | 721 | 600 | 472 | 369 | 618 | 656 | 582 |
Household furnishings and equipment | 1,581 | 1,870 | 1,704 | 2,253 | 1,440 | 1,246 | 1,365 | 1,406 | 1,372 | 1,220 |
Apparel and services | 1,786 | 2,415 | 1,989 | 2,481 | 1,788 | 1,657 | 1,755 | 1,415 | 1,057 | 1,602 |
Transportation | 9,073 | 10,764 | 10,280 | 12,259 | 9,283 | 8,625 | 9,436 | 9,221 | 6,795 | 6,401 |
Vehicle purchases (net outlay) | 3,301 | 3,665 | 3,879 | 4,629 | 3,315 | 3,380 | 3,524 | 3,720 | 2,249 | 2,173 |
Gasoline and motor oil | 2,468 | 2,955 | 2,780 | 3,018 | 2,668 | 2,450 | 3,083 | 2,724 | 1,727 | 1,958 |
Other vehicle expenses | 2,723 | 3,354 | 3,000 | 3,617 | 2,876 | 2,398 | 2,346 | 2,523 | 2,287 | 1,880 |
Public and other transportation | 581 | 789 | 621 | 994 | 423 | 397 | 482 | 253 | 531 | 390 |
Healthcare | 4,290 | 5,525 | 3,868 | 4,994 | 3,588 | 2,847 | 2,960 | 2,858 | 6,012 | 3,166 |
Entertainment | 2,728 | 3,877 | 2,861 | 3,744 | 2,622 | 1,946 | 2,071 | 2,377 | 2,344 | 2,160 |
Personal care products and services | 645 | 743 | 703 | 913 | 684 | 545 | 423 | 415 | 592 | 432 |
Reading | 103 | 117 | 99 | 142 | 93 | 54 | 62 | 60 | 144 | 59 |
Education | 1,236 | 2,211 | 1,404 | 2,302 | 871 | 1,040 | 435 | 587 | 230 | 1,450 |
Tobacco products and smoking supplies | 319 | 372 | 321 | 207 | 339 | 364 | 454 | 554 | 213 | 431 |
Miscellaneous | 782 | 1,250 | 757 | 1,101 | 545 | 526 | 520 | 599 | 802 | 641 |
Cash contributions | 1,788 | 2,148 | 1,714 | 2,341 | 1,420 | 1,200 | 1,552 | 1,247 | 2,495 | 986 |
Personal insurance and pensions | 5,726 | 11,472 | 7,215 | 10,353 | 5,988 | 4,555 | 5,514 | 4,829 | 1,429 | 2,770 |
Life and other personal insurance | 327 | 646 | 323 | 453 | 273 | 204 | 209 | 262 | 326 | 203 |
Pensions and Social Security | 5,399 | 10,826 | 6,892 | 9,901 | 5,715 | 4,352 | 5,305 | 4,567 | 1,103 | 2,567 |
Source: U.S. Bureau of Labor Statistics. | ||||||||||
Source: U.S. Bureau of Labor Statistics.
| Table 13. Highest education level of any member: Average annual expenditures and characteristics, Consumer Expenditure Survey, 2014 | |||||||||
|---|---|---|---|---|---|---|---|---|---|
| Item | All consumer units | Less than college graduate | College graduate | ||||||
| Total | Less than high school graduate | High school graduate | High school graduate with some college | Associate's degree | Total | Bachelor's degree | Master's, professional, doctoral degree | ||
Number of consumer units (in thousands) | 127,006 | 77,236 | 9,716 | 26,530 | 27,300 | 13,690 | 49,770 | 29,183 | 20,586 |
Consumer unit characteristics: | |||||||||
Income before taxes | $66,877 | $45,037 | $28,031 | $40,260 | $47,891 | $60,671 | $100,770 | $84,628 | $123,654 |
Age of reference person | 50.3 | 51.0 | 55.6 | 53.5 | 48.0 | 48.8 | 49.2 | 47.8 | 51.2 |
Average number in consumer unit: | |||||||||
People | 2.5 | 2.4 | 2.3 | 2.3 | 2.4 | 2.7 | 2.6 | 2.5 | 2.6 |
Children under 18 | .6 | .6 | .7 | .5 | .6 | .7 | .6 | .6 | .6 |
Adults 65 and older | .4 | .4 | .5 | .4 | .3 | .3 | .3 | .3 | .4 |
Earners | 1.3 | 1.1 | .8 | 1.0 | 1.2 | 1.4 | 1.5 | 1.5 | 1.5 |
Vehicles | 1.9 | 1.7 | 1.0 | 1.6 | 1.8 | 2.1 | 2.1 | 2.0 | 2.2 |
Percent homeowner | 63 | 57 | 45 | 58 | 55 | 66 | 72 | 68 | 77 |
Average annual expenditures | $53,495 | $40,403 | $28,180 | $36,286 | $43,749 | $50,300 | $73,672 | $65,483 | $85,434 |
Food | 6,759 | 5,480 | 4,519 | 4,986 | 5,772 | 6,473 | 8,683 | 8,075 | 9,598 |
Food at home | 3,971 | 3,458 | 3,304 | 3,311 | 3,476 | 3,821 | 4,740 | 4,486 | 5,126 |
Cereals and bakery products | 519 | 454 | 442 | 445 | 451 | 487 | 616 | 584 | 666 |
Meats, poultry, fish, and eggs | 892 | 829 | 878 | 802 | 808 | 897 | 985 | 980 | 993 |
Dairy products | 423 | 361 | 352 | 339 | 366 | 399 | 516 | 480 | 571 |
Fruits and vegetables | 756 | 615 | 618 | 577 | 628 | 658 | 966 | 890 | 1,083 |
Other food at home | 1,382 | 1,199 | 1,013 | 1,148 | 1,223 | 1,381 | 1,656 | 1,552 | 1,814 |
Food away from home | 2,787 | 2,021 | 1,215 | 1,675 | 2,296 | 2,652 | 3,943 | 3,588 | 4,472 |
Alcoholic beverages | 463 | 294 | 139 | 245 | 318 | 449 | 716 | 645 | 823 |
Housing | 17,798 | 13,821 | 10,605 | 12,883 | 14,532 | 16,529 | 23,950 | 21,156 | 27,932 |
Shelter | 10,491 | 7,914 | 6,284 | 7,255 | 8,450 | 9,277 | 14,489 | 12,758 | 16,943 |
Owned dwellings | 6,149 | 4,013 | 2,330 | 3,483 | 4,338 | 5,586 | 9,464 | 7,900 | 11,680 |
Rented dwellings | 3,631 | 3,586 | 3,848 | 3,521 | 3,746 | 3,209 | 3,701 | 3,842 | 3,501 |
Other lodging | 710 | 314 | 106 | 251 | 366 | 482 | 1,325 | 1,016 | 1,762 |
Utilities, fuels, and public services | 3,921 | 3,573 | 2,840 | 3,481 | 3,614 | 4,191 | 4,459 | 4,207 | 4,818 |
Household operations | 1,174 | 690 | 332 | 563 | 815 | 941 | 1,924 | 1,441 | 2,610 |
Housekeeping supplies | 632 | 513 | 475 | 506 | 482 | 626 | 810 | 730 | 931 |
Household furnishings and equipment | 1,581 | 1,131 | 675 | 1,078 | 1,171 | 1,493 | 2,268 | 2,019 | 2,631 |
Apparel and services | 1,786 | 1,325 | 1,221 | 1,164 | 1,397 | 1,554 | 2,480 | 2,105 | 3,045 |
Transportation | 9,073 | 7,248 | 4,497 | 6,253 | 8,155 | 9,311 | 11,894 | 11,198 | 12,880 |
Vehicle purchases (net outlay) | 3,301 | 2,587 | 1,536 | 2,020 | 3,087 | 3,433 | 4,410 | 4,153 | 4,773 |
Gasoline and motor oil | 2,468 | 2,224 | 1,467 | 2,045 | 2,401 | 2,756 | 2,847 | 2,823 | 2,881 |
Other vehicle expenses | 2,723 | 2,163 | 1,260 | 1,969 | 2,353 | 2,789 | 3,580 | 3,437 | 3,781 |
Public and other transportation | 581 | 275 | 234 | 219 | 314 | 333 | 1,057 | 784 | 1,445 |
Healthcare | 4,290 | 3,398 | 2,201 | 3,290 | 3,512 | 4,228 | 5,672 | 5,188 | 6,361 |
Entertainment | 2,728 | 2,026 | 1,301 | 1,873 | 2,179 | 2,516 | 3,806 | 3,287 | 4,565 |
Personal care products and services | 645 | 471 | 336 | 418 | 490 | 633 | 910 | 816 | 1,050 |
Reading | 103 | 63 | 32 | 56 | 72 | 83 | 165 | 134 | 209 |
Education | 1,236 | 564 | 147 | 233 | 945 | 740 | 2,278 | 1,762 | 3,011 |
Tobacco products and smoking supplies | 319 | 417 | 329 | 489 | 401 | 370 | 168 | 218 | 97 |
Miscellaneous | 782 | 595 | 286 | 469 | 678 | 889 | 1,072 | 945 | 1,258 |
Cash contributions | 1,788 | 1,168 | 654 | 1,065 | 1,399 | 1,275 | 2,750 | 2,146 | 3,606 |
Personal insurance and pensions | 5,726 | 3,533 | 1,914 | 2,862 | 3,899 | 5,250 | 9,130 | 7,811 | 11,000 |
Life and other personal insurance | 327 | 210 | 104 | 207 | 233 | 245 | 509 | 396 | 669 |
Pensions and Social Security | 5,399 | 3,323 | 1,810 | 2,655 | 3,666 | 5,005 | 8,621 | 7,414 | 10,330 |
Source: U.S. Bureau of Labor Statistics. | |||||||||
Source: U.S. Bureau of Labor Statistics.
| Table 14. Deciles of income before taxes: Average annual expenditures and characteristics, Consumer Expenditure Survey, 2014 | |||||||||||
|---|---|---|---|---|---|---|---|---|---|---|---|
| Item | All consumer units | Lowest 10 percent | Second 10 percent | Third 10 percent | Fourth 10 percent | Fifth 10 percent | Sixth 10 percent | Seventh 10 percent | Eighth 10 percent | Ninth 10 percent | Highest 10 percent |
Number of consumer units (in thousands) | 127,006 | 12,724 | 12,640 | 12,658 | 12,725 | 12,737 | 12,762 | 12,766 | 12,584 | 12,735 | 12,675 |
Lower limit | (1) | (1) | $11,165 | $18,362 | $26,784 | $35,682 | $46,615 | $59,549 | $75,977 | $99,623 | $140,196 |
Consumer unit characteristics: | |||||||||||
Income before taxes | $66,877 | $5,675 | 14,973 | 22,757 | 31,277 | 41,177 | 52,924 | 67,239 | 86,878 | 116,404 | 229,771 |
Age of reference person | 50.3 | 46.6 | 55.7 | 54.2 | 53.0 | 50.0 | 49.7 | 48.5 | 48.2 | 48.2 | 48.9 |
Average number in consumer unit: | |||||||||||
People | 2.5 | 1.7 | 1.7 | 2.1 | 2.3 | 2.5 | 2.6 | 2.8 | 2.8 | 3.1 | 3.2 |
Children under 18 | .6 | .4 | .3 | .5 | .5 | .6 | .6 | .7 | .7 | .8 | .8 |
Adults 65 and older | .4 | .2 | .5 | .5 | .5 | .4 | .4 | .3 | .3 | .2 | .2 |
Earners | 1.3 | .5 | .5 | .8 | .9 | 1.2 | 1.4 | 1.6 | 1.7 | 2.0 | 2.1 |
Vehicles | 1.9 | .8 | 1.0 | 1.3 | 1.5 | 1.8 | 2.0 | 2.2 | 2.4 | 2.7 | 2.9 |
Percent homeowner | 63 | 32 | 46 | 50 | 57 | 58 | 64 | 70 | 78 | 83 | 90 |
Average annual expenditures | $53,495 | $22,488 | $24,943 | $31,317 | $35,766 | $41,728 | $49,056 | $54,797 | $66,105 | $82,911 | $125,893 |
Food | 6,759 | 3,525 | 3,809 | 4,389 | 5,119 | 5,638 | 6,345 | 7,162 | 8,397 | 10,019 | 13,168 |
Food at home | 3,971 | 2,383 | 2,629 | 2,932 | 3,343 | 3,554 | 3,786 | 4,135 | 4,868 | 5,626 | 6,452 |
Cereals and bakery products | 519 | 323 | 366 | 386 | 436 | 479 | 479 | 531 | 624 | 735 | 831 |
Meats, poultry, fish, and eggs | 892 | 555 | 594 | 716 | 759 | 773 | 896 | 944 | 1,102 | 1,244 | 1,332 |
Dairy products | 423 | 251 | 284 | 315 | 338 | 400 | 420 | 459 | 493 | 598 | 672 |
Fruits and vegetables | 756 | 422 | 483 | 548 | 632 | 687 | 692 | 778 | 935 | 1,097 | 1,283 |
Other food at home | 1,382 | 832 | 902 | 967 | 1,178 | 1,215 | 1,299 | 1,423 | 1,714 | 1,952 | 2,334 |
Food away from home | 2,787 | 1,143 | 1,180 | 1,457 | 1,776 | 2,085 | 2,559 | 3,027 | 3,529 | 4,394 | 6,716 |
Alcoholic beverages | 463 | 161 | 195 | 184 | 238 | 310 | 372 | 464 | 602 | 754 | 1,344 |
Housing | 17,798 | 9,290 | 9,999 | 12,026 | 12,988 | 14,371 | 16,523 | 17,952 | 21,205 | 25,439 | 38,213 |
Shelter | 10,491 | 5,784 | 5,962 | 7,041 | 7,445 | 8,286 | 9,538 | 10,393 | 12,192 | 14,801 | 23,486 |
Owned dwellings | 6,149 | 1,782 | 2,069 | 2,688 | 3,344 | 3,871 | 5,000 | 6,269 | 8,095 | 10,651 | 17,746 |
Rented dwellings | 3,631 | 3,877 | 3,680 | 4,146 | 3,813 | 4,036 | 4,160 | 3,607 | 3,291 | 3,127 | 2,570 |
Other lodging | 710 | 124 | 214 | 207 | 288 | 380 | 379 | 517 | 806 | 1,024 | 3,171 |
Utilities, fuels, and public services | 3,921 | 2,200 | 2,576 | 3,082 | 3,377 | 3,622 | 3,987 | 4,317 | 4,696 | 5,141 | 6,209 |
Household operations | 1,174 | 404 | 527 | 590 | 686 | 743 | 860 | 1,057 | 1,403 | 1,825 | 3,651 |
Housekeeping supplies | 632 | 308 | 341 | 462 | 540 | 506 | 583 | 658 | 855 | 955 | 1,109 |
Household furnishings and equipment | 1,581 | 595 | 592 | 852 | 939 | 1,213 | 1,554 | 1,527 | 2,058 | 2,716 | 3,759 |
Apparel and services | 1,786 | 780 | 791 | 958 | 1,287 | 1,429 | 1,640 | 1,607 | 2,110 | 2,838 | 4,412 |
Transportation | 9,073 | 3,367 | 3,744 | 5,579 | 5,813 | 7,801 | 9,147 | 10,046 | 11,656 | 14,520 | 19,065 |
Vehicle purchases (net outlay) | 3,301 | 1,234 | 1,065 | 1,812 | 1,661 | 2,812 | 3,601 | 3,383 | 4,435 | 5,787 | 7,224 |
Gasoline and motor oil | 2,468 | 1,072 | 1,248 | 1,640 | 2,043 | 2,326 | 2,548 | 2,931 | 3,294 | 3,637 | 3,943 |
Other vehicle expenses | 2,723 | 884 | 1,195 | 1,881 | 1,854 | 2,246 | 2,591 | 3,206 | 3,287 | 4,249 | 5,831 |
Public and other transportation | 581 | 178 | 236 | 245 | 255 | 417 | 406 | 526 | 640 | 848 | 2,067 |
Healthcare | 4,290 | 1,486 | 2,252 | 2,989 | 3,514 | 3,609 | 4,442 | 4,786 | 5,382 | 6,144 | 8,299 |
Entertainment | 2,728 | 1,066 | 1,150 | 1,379 | 1,751 | 2,170 | 2,559 | 2,696 | 3,244 | 4,455 | 6,806 |
Personal care products and services | 645 | 261 | 332 | 397 | 466 | 513 | 571 | 632 | 817 | 1,003 | 1,457 |
Reading | 103 | 35 | 60 | 60 | 82 | 73 | 95 | 95 | 129 | 167 | 235 |
Education | 1,236 | 1,162 | 681 | 347 | 486 | 506 | 678 | 736 | 1,311 | 1,898 | 4,563 |
Tobacco products and smoking supplies | 319 | 274 | 275 | 325 | 335 | 340 | 355 | 379 | 347 | 339 | 222 |
Miscellaneous | 782 | 347 | 372 | 410 | 508 | 676 | 676 | 872 | 937 | 1,144 | 1,878 |
Cash contributions | 1,788 | 444 | 570 | 1,058 | 1,211 | 1,306 | 1,532 | 1,678 | 2,151 | 2,811 | 5,126 |
Personal insurance and pensions | 5,726 | 290 | 713 | 1,218 | 1,969 | 2,984 | 4,121 | 5,691 | 7,816 | 11,382 | 21,105 |
Life and other personal insurance | 327 | 67 | 107 | 112 | 231 | 189 | 222 | 308 | 380 | 570 | 1,087 |
Pensions and Social Security | 5,399 | 224 | 605 | 1,105 | 1,738 | 2,795 | 3,899 | 5,384 | 7,436 | 10,811 | 20,018 |
(1) Not applicable. Source: U.S. Bureau of Labor Statistics. | |||||||||||
(1) Not applicable.
Source: U.S. Bureau of Labor Statistics.
Technical Notes
Brief description of the Consumer Expenditure Survey
After being collected approximately every 10 years starting in 1888 until 1973, annual Consumer Expenditure Survey (CE) collection began in 1979. Its principal objective is to collect information on the buying habits of Americans. Consumer expenditure data are used in a variety of research endeavors by government, business, labor, and academic analysts. In addition, the data are required for the regular revision of the Consumer Price Index (CPI) market basket. The CE survey, which is conducted by the U.S. Census Bureau for Bureau of Labor Statistics, consists of two components: A Diary Survey completed by participating consumer units’ (CUs) for two consecutive 1-week periods and an Interview Survey by which expenditures of consumer units is obtained in four interviews conducted at 3-month intervals. Results in this report are based on integrated data from both surveys. Survey participants record dollar amounts for goods and services purchased during the reporting period, regardless of whether payment is made at the time of purchase. Expenditure amounts include all sales and excise taxes for items purchased by the consumer unit. All business-related expenditures are excluded from both surveys, as are expenditures for which the CU is reimbursed.
Each component of the survey queries an independent sample of consumer units that are representative of the U.S. population. For the Diary Survey, about 7,000 consumer units are sampled each year. Each CU keeps a diary for two 1-week periods, yielding approximately 14,000 diaries a year. The Interview Survey, selected on a rotating panel basis, collects data about 7,000 CUs each quarter. With the rotating panel, some CUs drop out of the survey each quarter, while others come in. Each consumer unit is interviewed once per quarter, for four consecutive quarters. Data are collected on an ongoing basis in 91 areas of the United States. The Interview Survey is designed to capture expenditure data that respondents can reasonably recall for a period of 3 months or longer. In general, these expenditures are relatively large, such as expenditures for real property, automobiles, and major appliances, or they occur on a regular basis, such as rent, utility payments, and insurance premiums. The Interview Survey also collects data on expenditures incurred on leisure trips. Including global estimates of spending for food, it is estimated that about 95 percent of expenditures are covered in the Interview Survey. Nonprescription drugs, household supplies, and personal care items are excluded. The Diary Survey is designed to capture expenditures on small, frequently purchased items that are normally more difficult for respondents to recall buying over an extended period. Detailed entries of expenses are kept for food and beverages— consumed either at home or in eating places—and for tobacco, housekeeping supplies, nonprescription drugs, personal care products and services, and any other goods or services purchased within the period. Expenditures incurred by members of the CU while away from home overnight or longer are excluded from the Diary Survey. Although this survey was designed to collect information on expenditures that could not be recalled easily over an extended period, respondents are asked to report all expenses (except those spent while traveling overnight that the consumer unit incurs during the survey week.)
Integrated data from the BLS Diary and Interview Surveys provide a complete accounting of consumer expenditures and income that neither survey is designed to do on its own. Data on some expenditure items are collected in only one of the surveys. For example, the Diary Survey does not collect information on reimbursements, whereas the Interview Survey does. Examples of expenditures for which reimbursements are excluded from the Diary Survey are medical care; automobile repairs; and construction, repairs, alterations, and maintenance of property. For items that are unique to one survey or the other, the choice of which survey to use as the source of data is obvious. However, there is considerable overlap in coverage between the surveys. Consequently, integrating the data involves determining the appropriate survey component from which to select expenditure items. When data are available from both surveys, the more reliable of the two (as determined by statistical methods) is selected. As a result, some items are selected from the Interview Survey, others from the Diary Survey. Because of the overlap in the item coverage between the two surveys, the survey source is reviewed every 2 years and statistical methods are used to select the best source. See, “CE Source Selection for Publication Tables” in the Consumer Expenditure Survey Anthology, 2011 (BLS Report, no. 1030) for source selection details at https://www.bls.gov/cex/anthology11/csxanth3.pdf.
The population and spending coverage of the CE differs from that of the CPI. The CE data cover the total population including rural areas, whereas the CPI covers only the population in urban and metropolitan areas. Definitions of components also differ between the CE and CPI. For example, homeownership is treated differently in the two surveys: actual expenditures of homeownership are reported in the CE, whereas the CPI uses a rental equivalence approach that estimates the change in the cost of obtaining, in the rental marketplace, services equivalent to those provided by owner-occupied homes.
Interpreting the data
Expenditures are averages for CUs with specified characteristics, regardless of whether a particular unit incurred an expense for a specific item during the recordkeeping period. The average expenditure for an item may be considerably lower than the expenditure by the consumer units that purchased the item. The less frequently an item is purchased, the greater the difference between the average for all consumer units and the average for those purchasing the item. Similarly, an individual consumer unit may spend more or less than the average, depending on its particular characteristics. Factors such as income, age of family members, geographic location, and personal preference also influence expenditures. Furthermore, even within groups with similar characteristics, the distribution of expenditures varies substantially. These points should be considered in relating reported averages to individual circumstances. Users of these survey data should also keep in mind that prices for many goods and services have risen since the survey was conducted. For example, all prices, as measured by the CPI-U, increased 0.1 percent from 2014 (annual average index) to 2015 (not seasonally adjusted). In addition, sample surveys are subject to two types of error: sampling and nonsampling. Sampling errors occur because the data are collected from a sample representing the population, rather than from the entire population. Nonsampling errors result from the inability or unwillingness of respondents to provide correct information, differences in interviewers’ abilities, mistakes in recording or coding, and other processing errors.
Tables and data
Tables in this report include integrated data from both the Diary and Interview components of the CE, enabling data users to associate the full range of expenditures with consumers’ demographic characteristics. Tables show data classified by income quintile, income class, age of the reference person, size of the consumer unit, composition of the consumer unit, number of earners, housing tenure, type of area (urban or rural), race, Hispanic origin, region of residence, occupation, and highest education level of any consumer-unit member. Tables for the aforementioned classifications, but with more detail than is given in this report, can be accessed on the CE page of the BLS website (https://www.bls.gov/cex). Also available are tables showing average annual data over a 2-year period for:
- Income before taxes, cross-tabulated by age, consumer unit size, or region
- Single consumers by gender, cross-tabulated by either income or age
- Selected metropolitan statistical areas (MSAs).
Data are available for 1984–2015. Other survey information available on the website includes answers to frequently asked questions, a glossary of terms, and order forms for survey products. Beginning with the 2000 data, estimates of standard errors for integrated Diary and Interview Survey data are also available.
Prepublication tables containing additional detailed subcategories of spending are available upon request to CEXInfo@bls.gov. These detailed level tables have higher variances. Prepublication tables for all CUs are now available at https://www.bls.gov/cex/csxresearchtables.htm.
Other available data
The 2015 CE public-use microdata, including Interview Survey data, Diary Survey data, and paradata (information about the survey process), are available on the CE website for free electronic download. The Interview Survey files contain expenditure data in two different formats: MTBI files that present monthly values in an item-coding framework based on the CPI pricing scheme, and EXPN files that organize expenditures by the section of the Interview Survey questionnaire in which they are collected. Expenditure values on EXPN files cover different time periods depending on the specific questions asked, and the files also contain relevant nonexpenditure information not found on the MTBI files. Beginning with the 2013 public-use microdata, the new estimates of local, state, and federal tax liabilities are included. The CE introduced these estimates to improve the quality of the surveyed tax liabilities, which suffered from low response rates. The surveyed public-use tax data were still available for 2013, after which they will no longer be collected. For more information on the improvements, see Improving Data Quality in the Consumer Expenditure Survey with TAXSIM, https://www.bls.gov/opub/mlr/2015/article/pdf/improving-data-quality-in-ce-with-taxsim.pdf and for new applications of the tax estimates see New and Improved Estimates of Personal Income Taxes have Tripled the Tax Data https://www.bls.gov/spotlight/2015/consumer-expenditures-tax-estimates/pdf/consumer-expenditures-tax-estimates.pdf.
Free public-use microdata are available online from the years 1996 to 2015. (See https://www.bls.gov/cex/pumd.htm.) For releases published before 1996, users can continue to purchase USB flash drives using the public-use microdata order form. (See https://www.bls.gov/cex/csxform.pdf.) Future releases of public-use microdata will be available online for free download.
The Consumer Expenditure program also publishes Beyond the Numbers articles. These reports include analyses of expenditure data as they apply to various topics of interest, as well as methodological and research articles pertaining to a number of survey topics. As of July 2016, the most recent of these reports are Using gasoline data to explain inelasticity (https://www.bls.gov/opub/btn/volume-5/using-gasoline-data-to-explain-inelasticity.htm) , and A closer look at spending patterns of older Americans (https://www.bls.gov/opub/btn/volume-5/spending-patterns-of-older-americans.htm). Additional data also are presented in articles in the Monthly Labor Review. These reports can be found at https://www.bls.gov/cex/home.htm#publications. For more detailed information on the availability of current and earlier data, contact the Division of Consumer Expenditure Surveys, Office of Prices and Living Conditions, Bureau of Labor Statistics, 2 Massachusetts Avenue, NE., Washington, DC 20212-0001; call (202) 691-6900; Email: cexinfo@bls.gov, or visit us online at https://www.bls.gov/cex. Information in this publication is in the public domain and, with appropriate credit, may be reproduced without permission. Upon request, the information in this report will be made available to individuals who are sensory-impaired individuals. Voice phone: (202) 691-5200. Federal Relay Service: 1-800-877-8339.