
An official website of the United States government
An official website of the United States government
The .gov means it's official.
Federal government websites often end in .gov or .mil. Before sharing sensitive information,
make sure you're on a federal government site.
The site is secure.
The
https:// ensures that you are connecting to the official website and that any
information you provide is encrypted and transmitted securely.
The Consumer Price Index (CPI) is a measure of the average change over time in the prices paid by urban consumers for a market basket of consumer goods and services. Indexes are available for the U.S. and various geographic areas. Average price data for select utility, automotive fuel, and food items are also available.
12-month percentage change, Consumer Price Index, selected categories, May 2026, not seasonally adjusted
Category
12-month percent change, May 2026
All items
4.2%
Food
3.1%
Food at home
2.7%
Cereals and bakery products
1.9%
Meats, poultry, fish, and eggs
1.8%
Dairy and related products
-1.0%
Fruits and vegetables
6.1%
Nonalcoholic beverages and beverage materials
5.8%
Other food at home
2.0%
Food away from home
3.5%
Full service meals and snacks
3.8%
Limited service meals and snacks
3.3%
Energy
23.5%
Energy commodities
40.6%
Fuel oil
58.9%
Gasoline (all types)
40.5%
Energy services
5.3%
Electricity
5.9%
Natural gas (piped)
3.0%
All items less food and energy
2.9%
Commodities less food and energy commodities
1.1%
Apparel
4.8%
New vehicles
0.2%
Used cars and trucks
-2.0%
Medical care commodities
-1.8%
Alcoholic beverages
2.1%
Tobacco and smoking products
7.8%
Services less energy services
3.4%
Shelter
3.4%
Rent of primary residence
2.9%
Owners' equivalent rent of residences
3.3%
Medical care services
3.6%
Physicians' services
2.9%
Hospital services
5.7%
Transportation services
4.1%
Motor vehicle maintenance and repair
6.1%
Motor vehicle insurance
-2.0%
Airline fare
26.7%
Consumer Price Index (CPI):
+0.5% in May 2026
![]()
![]()
Unemployment Rate:
4.2% in Jun 2026
![]()
![]()
Payroll Employment:
+57,000(p) in Jun 2026
![]()
![]()
Average Hourly Earnings:
+$0.13(p) in Jun 2026
![]()
![]()
Producer Price Index - Final Demand:
+1.1%(p) in May 2026
![]()
![]()
Employment Cost Index (ECI):
+0.9% in 1st Qtr of 2026
![]()
![]()
Productivity:
+0.3%(r) in 1st Qtr of 2026
![]()
![]()
U.S. Import Price Index:
+1.9% in May 2026
![]()
![]()
U.S. Export Price Index:
+1.3% in May 2026
![]()
![]()
06/10/2026
In May, the Consumer Price Index for All Urban Consumers rose 0.5 percent, seasonally
adjusted, and rose 4.2 percent over the last 12 months, not seasonally adjusted. The index for all
items less food and energy increased 0.2 percent in May (SA); up 2.9 percent over the year (NSA).
HTML
|
PDF
|
RSS
|
Charts
|
Local and Regional CPI

Between December 2023 and December 2024, consumer prices experienced disinflation, where prices still increased but by a smaller amount than before. The Consumer Price Index (CPI) increased 2.9 percent from December 2023 to December 2024. This was a slower rate of increase than in the three previous 12-month periods ending in December. read more »

The U.S. Bureau of Labor Statistics has incorporated used clothing into the Consumer Price Index. read more »
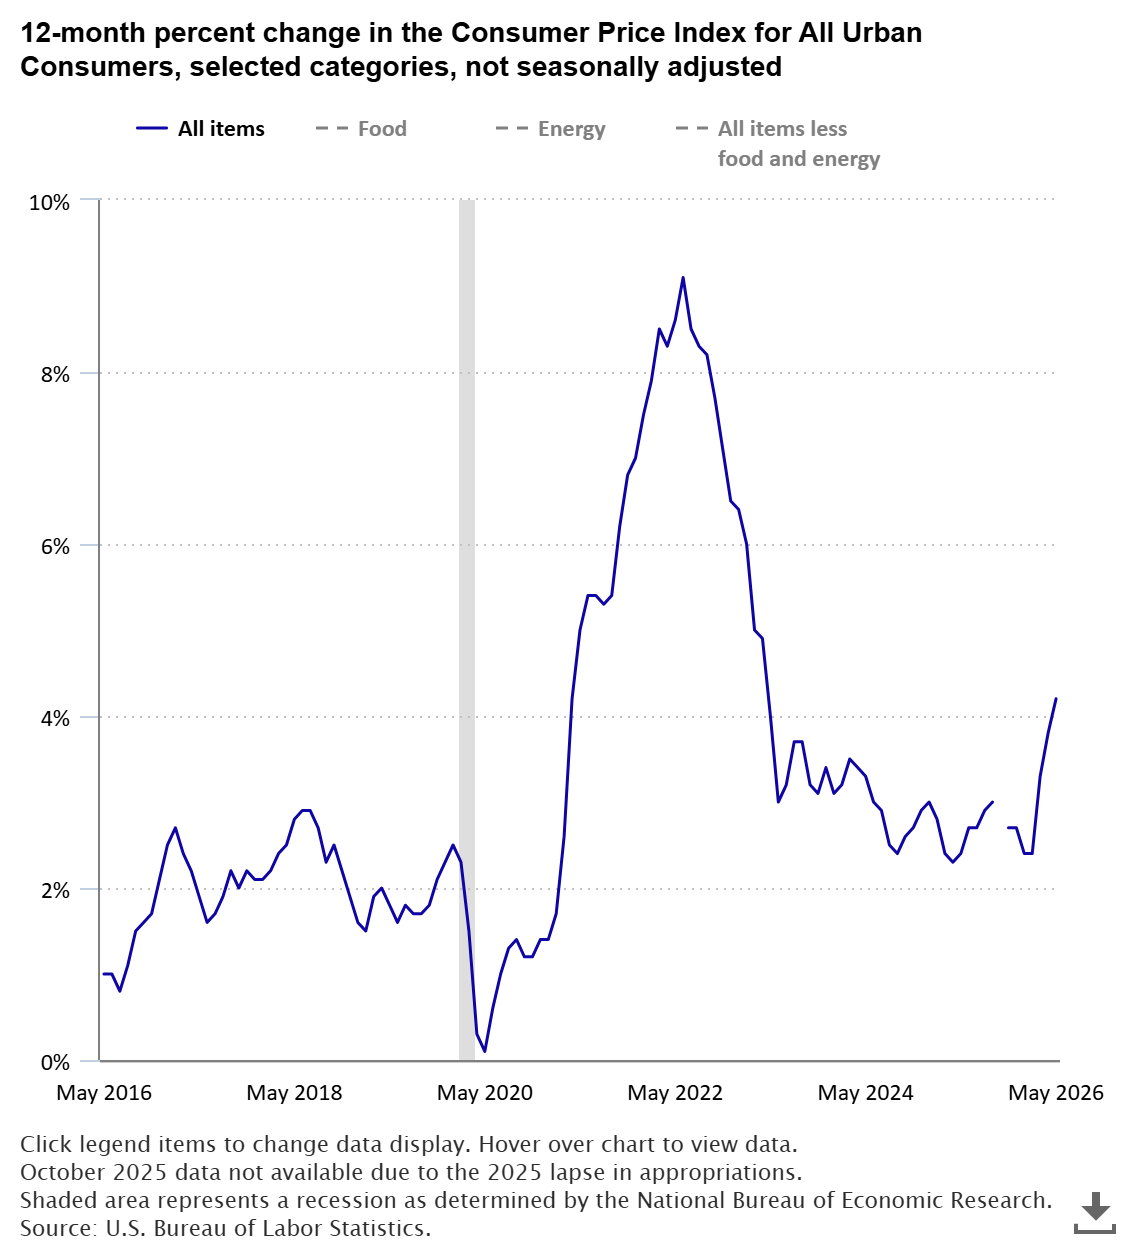
The all items Consumer Price Index for All Urban Consumers increased 4.2 percent from May 2025 to May 2026. This was the largest 12-month increase since the index rose 4.9 percent over the year ended April 2023. read more »

This Spotlight on Statistics reviews historical employment trends for distilleries and other components of the beverage manufacturing industry. Additionally, the Spotlight looks at trends in the number of establishments and wages for the distillery industry and compares them to trends among breweries and wineries. Finally, a look at consumer prices for distilled spirits is reviewed. read more »