
An official website of the United States government
An official website of the United States government
The .gov means it's official.
Federal government websites often end in .gov or .mil. Before sharing sensitive information,
make sure you're on a federal government site.
The site is secure.
The
https:// ensures that you are connecting to the official website and that any
information you provide is encrypted and transmitted securely.
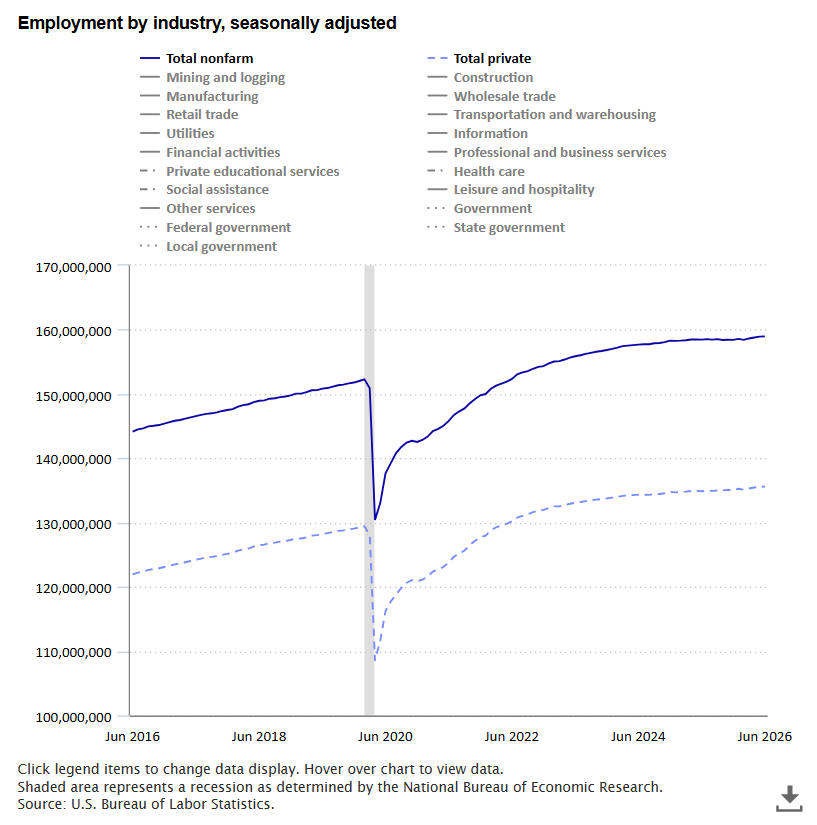
Total nonfarm payroll employment changed little in June (+57,000), roughly in line with the average monthly change over the prior 12 months (+36,000). In June, employment continued to trend up in professional and business services, social assistance, and health care. Employment in leisure and hospitality declined.
read full article »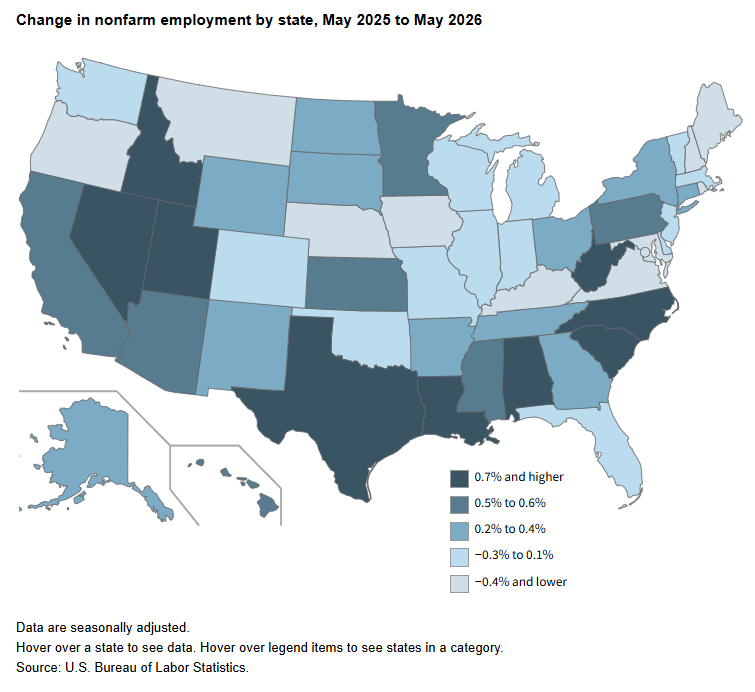
From May 2025 to May 2026, nonfarm payroll employment increased in 2 states, decreased in 1 state and the District of Columbia, and was essentially unchanged in 47 states.
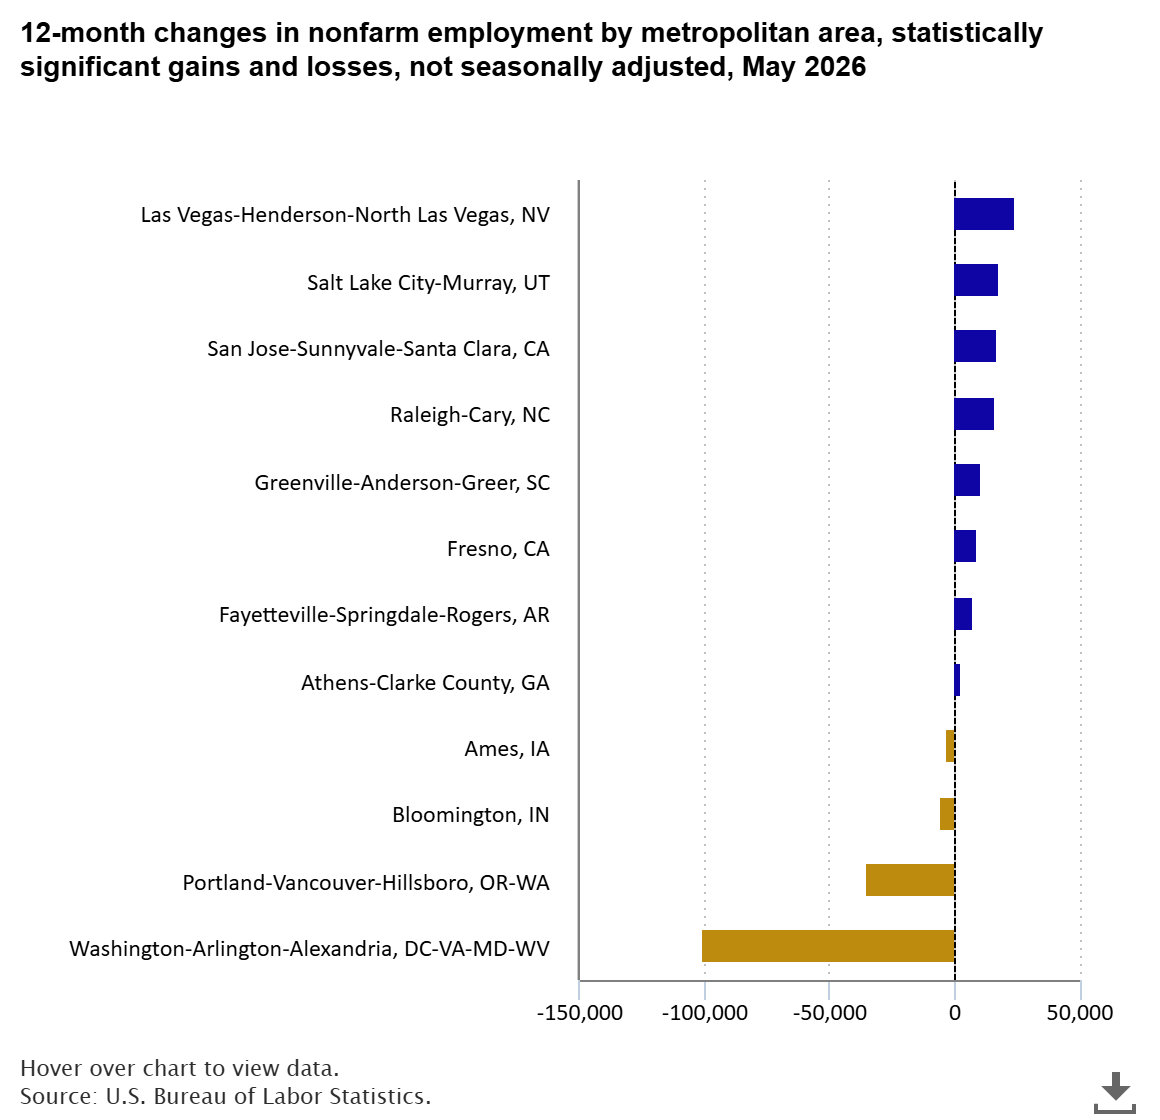
From May 2025 to May 2026, nonfarm payroll employment increased in 8 metropolitan areas, decreased in 4 areas, and was essentially unchanged in 375 areas.
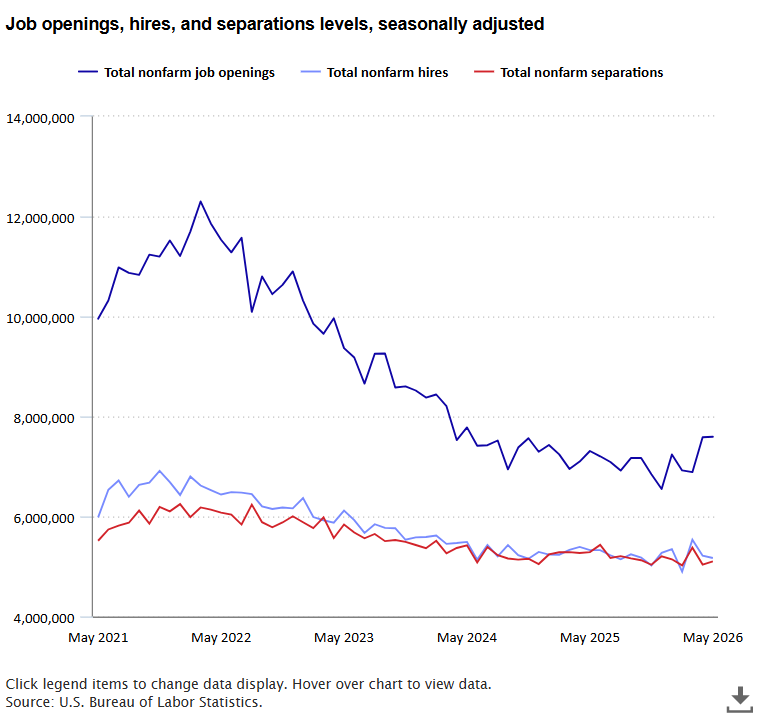
The number of job openings was unchanged at 7.6 million in May 2026. Hires were unchanged at 5.2 million. Among industries, job openings increased in wholesale trade (+71,000) and hires increased in federal government (+11,000).
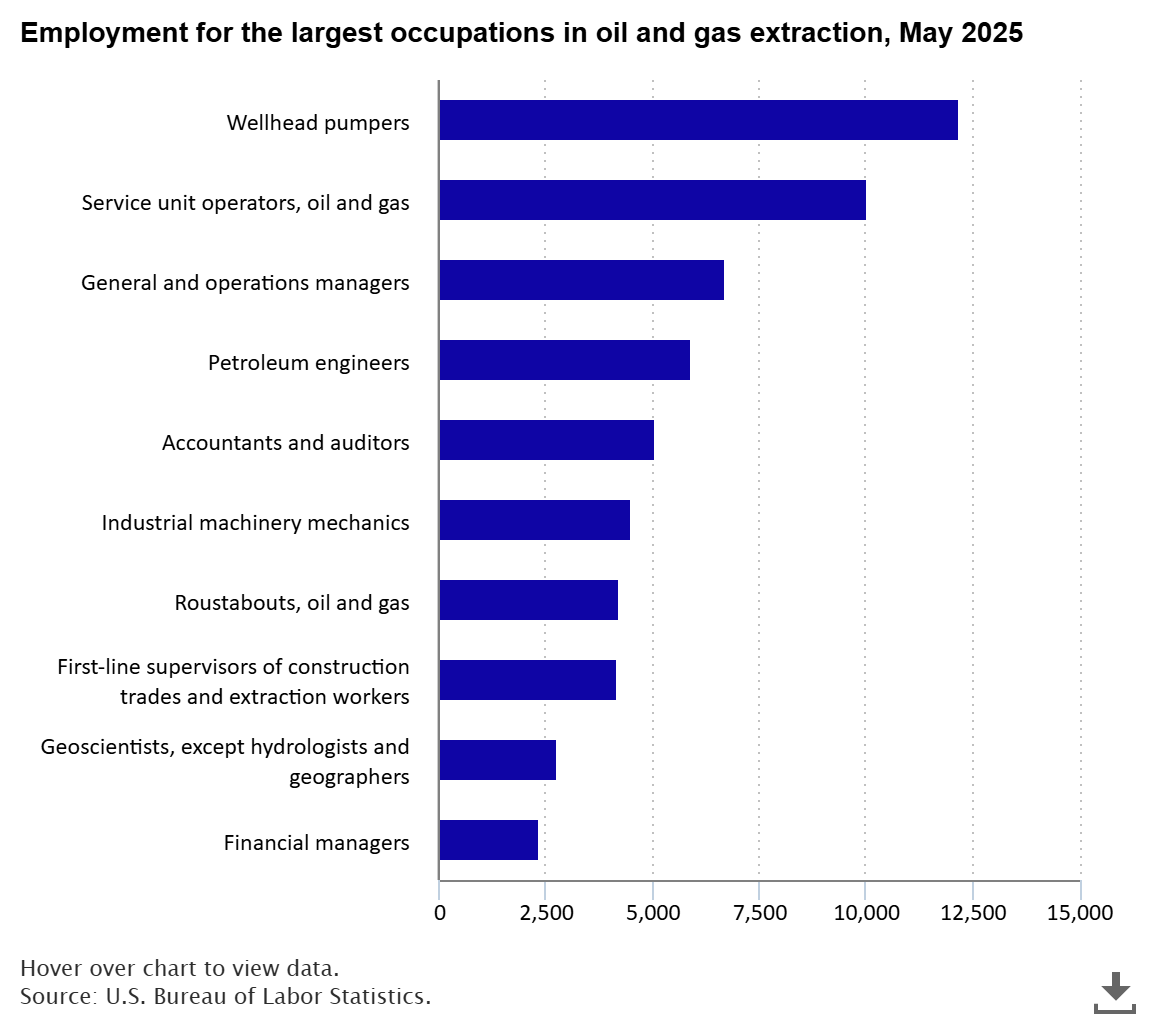
The oil and gas extraction industry had nearly 114,000 jobs in May 2025 and an annual mean wage of $122,890, making it one of the highest paying U.S. industries overall. Producing crude petroleum, extracting oil from oil shale and oil sands, and producing natural gas are among the activities performed in this industry.
