
An official website of the United States government
An official website of the United States government
The .gov means it's official.
Federal government websites often end in .gov or .mil. Before sharing sensitive information,
make sure you're on a federal government site.
The site is secure.
The
https:// ensures that you are connecting to the official website and that any
information you provide is encrypted and transmitted securely.
The Local Area Unemployment Statistics (LAUS) program produces monthly and annual employment, unemployment, and labor force data for Census regions and divisions, States, counties, metropolitan areas, and many cities, by place of residence. More »
Alabama
3.2%(p) in Jun 2026
![]()
Alaska
4.4%(p) in Jun 2026
![]()
Arizona
4.9%(p) in Jun 2026
![]()
Arkansas
4.1%(p) in Jun 2026
![]()
California
5.2%(p) in Jun 2026
![]()
Colorado
3.9%(p) in Jun 2026
![]()
Connecticut
5.2%(p) in Jun 2026
![]()
Delaware
4.9%(p) in Jun 2026
![]()
D.C.
6.0%(p) in Jun 2026
![]()
Florida
4.7%(p) in Jun 2026
![]()
Georgia
3.4%(p) in Jun 2026
![]()
Hawaii
2.6%(p) in Jun 2026
![]()
Idaho
3.7%(p) in Jun 2026
![]()
Illinois
5.1%(p) in Jun 2026
![]()
Indiana
3.3%(p) in Jun 2026
![]()
Iowa
3.2%(p) in Jun 2026
![]()
Kansas
3.8%(p) in Jun 2026
![]()
Kentucky
4.7%(p) in Jun 2026
![]()
Louisiana
4.4%(p) in Jun 2026
![]()
Maine
3.1%(p) in Jun 2026
![]()
Maryland
4.3%(p) in Jun 2026
![]()
Massachusetts
4.4%(p) in Jun 2026
![]()
Michigan
5.0%(p) in Jun 2026
![]()
Minnesota
4.4%(p) in Jun 2026
![]()
Mississippi
3.8%(p) in Jun 2026
![]()
Missouri
3.7%(p) in Jun 2026
![]()
Montana
3.3%(p) in Jun 2026
![]()
Nebraska
2.9%(p) in Jun 2026
![]()
Nevada
5.1%(p) in Jun 2026
![]()
New Hampshire
2.9%(p) in Jun 2026
![]()
New Jersey
4.5%(p) in Jun 2026
![]()
New Mexico
4.8%(p) in Jun 2026
![]()
New York
4.6%(p) in Jun 2026
![]()
North Carolina
3.6%(p) in Jun 2026
![]()
North Dakota
2.3%(p) in Jun 2026
![]()
Ohio
3.6%(p) in Jun 2026
![]()
Oklahoma
4.2%(p) in Jun 2026
![]()
Oregon
5.2%(p) in Jun 2026
![]()
Pennsylvania
4.1%(p) in Jun 2026
![]()
Puerto Rico
5.8% in Jun 2026
![]()
Rhode Island
4.1%(p) in Jun 2026
![]()
South Carolina
4.4%(p) in Jun 2026
![]()
South Dakota
2.0%(p) in Jun 2026
![]()
Tennessee
3.5%(p) in Jun 2026
![]()
Texas
4.4%(p) in Jun 2026
![]()
Utah
3.6%(p) in Jun 2026
![]()
Vermont
2.6%(p) in Jun 2026
![]()
Virginia
3.7%(p) in Jun 2026
![]()
Washington
5.2%(p) in Jun 2026
![]()
West Virginia
4.2%(p) in Jun 2026
![]()
Wisconsin
3.3%(p) in Jun 2026
![]()
Wyoming
3.2%(p) in Jun 2026
![]()
07/21/2026
In June, unemployment rates were lower in 8 states, higher in 2 states, and stable in 40 states
and the District of Columbia. Nonfarm payroll employment increased in 3 states, decreased in 1,
and was essentially unchanged in 46 states and the District.
HTML
|
PDF
|
RSS
|
Charts
07/29/2026
Jobless rates were higher in June than a year earlier in 184 of the 387
metropolitan areas, lower in 178, and unchanged in 25. Nonfarm payroll
employment increased over the year in 15 areas, decreased in 3, and was
essentially unchanged in 369.
HTML
|
PDF
|
RSS
|
Charts
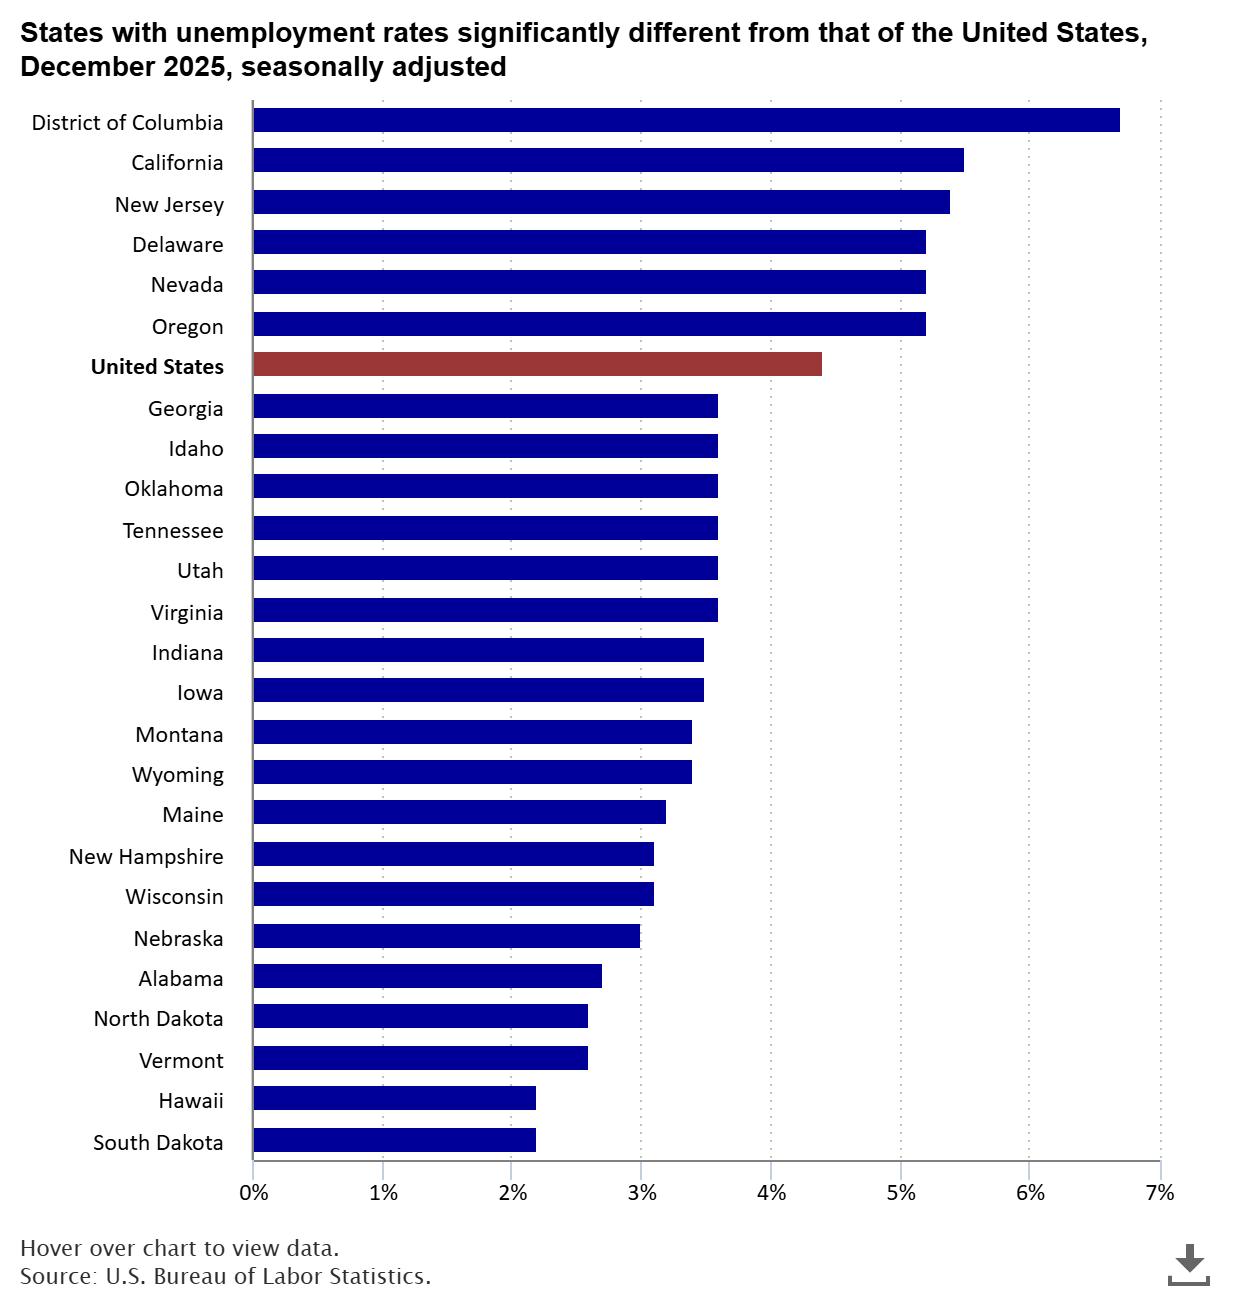
In December 2025, Hawaii and South Dakota had the lowest unemployment rates, 2.2 percent each. North Dakota, Vermont, and Alabama also had unemployment rates below 3.0 percent. The District of Columbia had the highest unemployment rate, 6.7 percent. The next highest rates were in California and New Jersey, 5.5 percent and 5.4 percent, respectively. read more »