
An official website of the United States government
An official website of the United States government
The .gov means it's official.
Federal government websites often end in .gov or .mil. Before sharing sensitive information,
make sure you're on a federal government site.
The site is secure.
The
https:// ensures that you are connecting to the official website and that any
information you provide is encrypted and transmitted securely.
The Current Population Survey (CPS) provides a wealth of information on the nation’s labor force including data on the employed, unemployed, and those not in the labor force. Key CPS measures are the unemployment rate, labor force participation rate, and employment-population ratio.
Explore CPS topics to learn about people’s work and job search activity and various demographic characteristics.
Civilian unemployment rate, seasonally adjusted
Month
Total
Men, 20 years and over
Women, 20 years and over
16 to 19 years old
White
Black or African American
Asian
Hispanic or Latino
June 2006
4.6
4.0
4.1
15.8
4.1
8.9
3.1
5.2
July 2006
4.7
4.1
4.2
15.9
4.1
9.5
2.4
5.2
Aug 2006
4.7
4.1
4.1
16.0
4.1
8.8
3.0
5.3
Sept 2006
4.5
3.7
4.2
16.3
3.9
9.0
3.0
5.5
Oct 2006
4.4
3.9
3.9
15.2
3.9
8.4
2.8
4.8
Nov 2006
4.5
4.0
4.0
14.8
4.0
8.5
3.1
5.1
Dec 2006
4.4
3.9
3.9
14.6
3.9
8.3
2.5
5.0
Jan 2007
4.6
4.2
4.0
14.8
4.2
7.9
3.1
5.5
Feb 2007
4.5
4.2
3.8
14.9
4.1
8.0
2.6
5.1
Mar 2007
4.4
4.0
3.8
14.9
3.8
8.4
3.0
5.0
Apr 2007
4.5
4.0
3.9
15.9
4.0
8.3
3.5
5.6
May 2007
4.4
4.0
3.8
15.9
3.9
8.3
3.2
5.8
June 2007
4.6
4.0
3.9
16.3
4.1
8.5
2.7
5.5
July 2007
4.7
4.2
4.2
15.3
4.2
8.1
2.7
5.9
Aug 2007
4.6
4.1
4.1
15.9
4.2
7.6
3.5
5.5
Sept 2007
4.7
4.2
4.1
15.9
4.2
8.0
3.4
5.9
Oct 2007
4.7
4.3
4.1
15.4
4.1
8.5
3.8
5.7
Nov 2007
4.7
4.2
4.2
16.2
4.2
8.5
3.6
5.9
Dec 2007
5.0
4.4
4.4
16.8
4.4
9.0
3.7
6.3
Jan 2008
5.0
4.5
4.3
17.8
4.4
9.1
3.1
6.3
Feb 2008
4.9
4.4
4.2
16.6
4.4
8.4
2.9
6.2
Mar 2008
5.1
4.6
4.5
16.1
4.5
9.2
3.6
6.9
Apr 2008
5.0
4.6
4.2
15.9
4.4
8.6
3.5
7.1
May 2008
5.4
4.9
4.6
19.0
4.8
9.6
4.1
6.9
June 2008
5.6
5.1
4.7
19.2
5.0
9.4
4.2
7.6
July 2008
5.8
5.4
4.7
20.7
5.2
10.0
3.7
7.5
Aug 2008
6.1
5.7
5.4
18.6
5.4
10.6
4.5
8.0
Sept 2008
6.1
6.1
5.0
19.1
5.4
11.3
4.0
8.0
Oct 2008
6.5
6.3
5.4
20.0
5.9
11.4
3.9
8.8
Nov 2008
6.8
6.7
5.7
20.3
6.2
11.5
4.8
8.7
Dec 2008
7.3
7.4
5.9
20.5
6.7
12.1
5.1
9.4
Jan 2009
7.8
7.9
6.5
20.7
7.1
12.7
6.1
10.1
Feb 2009
8.3
8.5
6.8
22.3
7.6
13.7
6.7
11.3
Mar 2009
8.7
9.0
7.1
22.2
8.0
13.7
6.5
11.7
Apr 2009
9.0
9.5
7.1
22.2
8.1
15.0
6.8
11.4
May 2009
9.4
9.8
7.5
23.4
8.5
15.0
7.0
12.3
June 2009
9.5
9.9
7.6
24.7
8.7
14.8
7.9
12.1
July 2009
9.5
9.8
7.7
24.3
8.7
14.8
8.1
12.5
Aug 2009
9.6
10.0
7.7
25.0
8.9
14.8
7.6
13.0
Sept 2009
9.8
10.1
7.9
25.9
8.9
15.3
7.6
12.6
Oct 2009
10.0
10.4
8.0
27.2
9.2
15.8
7.6
12.8
Nov 2009
9.9
10.3
7.9
26.9
9.2
15.7
7.2
12.4
Dec 2009
9.9
10.1
8.0
26.7
9.0
16.1
8.4
12.8
Jan 2010
9.8
10.2
7.9
26.1
8.8
16.5
8.3
12.9
Feb 2010
9.8
10.3
8.0
25.6
8.9
16.1
8.2
12.7
Mar 2010
9.9
10.2
8.1
26.2
8.9
16.8
7.6
12.9
Apr 2010
9.9
10.2
8.3
25.4
9.0
16.6
7.0
12.5
May 2010
9.6
9.7
8.1
26.5
8.7
15.5
7.8
12.0
June 2010
9.4
9.7
7.7
25.9
8.6
15.2
7.4
12.3
July 2010
9.4
9.6
7.9
25.9
8.5
15.6
7.9
12.2
Aug 2010
9.5
9.6
8.0
25.5
8.6
15.9
7.3
12.0
Sept 2010
9.5
9.6
8.0
25.8
8.6
16.0
6.6
12.3
Oct 2010
9.4
9.4
8.0
27.2
8.6
15.6
7.2
12.3
Nov 2010
9.8
9.9
8.4
24.8
8.9
16.2
7.5
12.9
Dec 2010
9.3
9.4
8.0
25.3
8.5
15.5
7.2
12.9
Jan 2011
9.1
9.0
7.9
25.7
8.1
15.8
6.8
12.3
Feb 2011
9.0
8.9
7.9
24.1
8.1
15.5
6.7
11.8
Mar 2011
9.0
8.8
7.8
24.4
8.0
15.8
7.3
11.6
Apr 2011
9.1
8.9
8.0
24.7
8.1
16.5
6.5
11.9
May 2011
9.0
8.8
8.0
23.9
7.9
16.3
7.2
11.6
June 2011
9.1
9.0
8.0
24.5
8.1
16.2
6.5
11.5
July 2011
9.0
8.8
7.9
24.7
8.0
15.9
7.4
11.2
Aug 2011
9.0
8.7
7.9
25.0
7.9
16.4
7.2
11.2
Sept 2011
9.0
8.7
8.2
24.4
7.9
15.9
8.0
11.2
Oct 2011
8.8
8.6
7.8
24.2
7.9
14.6
7.4
11.3
Nov 2011
8.6
8.2
7.8
24.2
7.7
15.6
6.4
11.2
Dec 2011
8.5
8.0
7.8
23.3
7.5
15.4
6.8
11.1
Jan 2012
8.3
7.7
7.6
23.6
7.4
13.6
6.7
10.7
Feb 2012
8.3
7.7
7.6
23.8
7.4
14.0
6.2
10.9
Mar 2012
8.2
7.7
7.4
24.8
7.3
14.0
6.4
10.6
Apr 2012
8.2
7.6
7.4
25.0
7.4
13.3
5.4
10.3
May 2012
8.2
7.7
7.4
24.4
7.4
13.5
5.5
10.9
June 2012
8.2
7.7
7.4
23.3
7.3
14.5
6.1
10.9
July 2012
8.2
7.7
7.4
23.6
7.3
14.2
5.9
10.2
Aug 2012
8.1
7.6
7.3
24.2
7.2
13.8
5.9
10.1
Sept 2012
7.8
7.3
7.1
23.8
7.0
13.6
4.9
9.7
Oct 2012
7.8
7.2
7.1
23.9
6.9
14.1
4.9
10.0
Nov 2012
7.7
7.2
7.0
23.9
6.8
13.3
6.3
9.9
Dec 2012
7.9
7.2
7.4
24.1
6.9
14.0
6.6
9.6
Jan 2013
8.0
7.5
7.2
23.7
7.1
13.7
6.4
9.7
Feb 2013
7.7
7.0
7.0
25.2
6.8
13.8
6.0
9.7
Mar 2013
7.5
6.9
6.9
24.0
6.7
13.0
5.1
9.3
Apr 2013
7.6
7.2
6.7
24.4
6.7
13.3
5.3
9.0
May 2013
7.5
7.1
6.5
24.4
6.7
13.4
4.5
9.0
June 2013
7.5
7.0
6.8
23.1
6.6
14.2
4.7
9.1
July 2013
7.3
7.0
6.3
23.3
6.5
12.6
5.3
9.4
Aug 2013
7.2
7.1
6.2
22.5
6.4
12.8
5.1
9.2
Sept 2013
7.2
7.1
6.2
21.3
6.3
13.0
5.4
8.8
Oct 2013
7.2
6.9
6.3
22.2
6.3
12.8
5.4
9.1
Nov 2013
6.9
6.6
6.2
20.7
6.1
12.3
5.2
8.7
Dec 2013
6.7
6.3
6.1
20.4
5.9
11.9
4.3
8.3
Jan 2014
6.6
6.2
5.8
20.4
5.7
12.1
4.7
8.3
Feb 2014
6.7
6.3
5.9
21.4
5.8
11.8
5.9
8.2
Mar 2014
6.7
6.1
6.2
20.8
5.8
12.1
5.5
7.9
Apr 2014
6.2
5.9
5.6
19.4
5.3
11.6
5.9
7.2
May 2014
6.3
5.9
5.8
19.3
5.4
11.4
5.7
7.7
June 2014
6.1
5.7
5.3
20.4
5.3
11.0
4.7
7.8
July 2014
6.2
5.7
5.6
20.3
5.3
11.6
4.2
7.7
Aug 2014
6.1
5.7
5.6
19.4
5.3
11.4
4.5
7.4
Sept 2014
5.9
5.3
5.5
20.1
5.1
11.0
4.4
6.8
Oct 2014
5.7
5.1
5.4
18.7
4.9
10.6
5.1
6.8
Nov 2014
5.8
5.4
5.3
17.2
5.0
10.9
4.8
6.6
Dec 2014
5.6
5.2
5.1
16.9
4.7
10.6
4.4
6.4
Jan 2015
5.7
5.3
5.0
18.5
4.9
10.3
4.0
6.7
Feb 2015
5.5
5.2
4.9
16.9
4.7
10.1
4.0
6.8
Mar 2015
5.4
5.1
4.9
17.5
4.8
9.9
3.2
6.8
Apr 2015
5.4
5.0
5.0
17.2
4.7
9.7
4.4
6.8
May 2015
5.6
5.2
5.1
17.8
4.8
10.3
4.1
6.8
June 2015
5.3
4.8
4.7
18.0
4.6
9.7
3.9
6.7
July 2015
5.2
4.8
4.8
16.4
4.5
9.1
3.9
6.9
Aug 2015
5.1
4.7
4.6
16.9
4.4
9.4
3.4
6.6
Sept 2015
5.0
4.7
4.6
16.5
4.4
9.3
3.5
6.2
Oct 2015
5.0
4.7
4.6
15.9
4.4
9.0
3.5
6.3
Nov 2015
5.1
4.8
4.6
15.3
4.4
9.4
3.9
6.4
Dec 2015
5.0
4.6
4.5
16.2
4.4
8.5
4.1
6.2
Jan 2016
4.8
4.3
4.5
15.9
4.2
8.5
3.6
5.9
Feb 2016
4.9
4.4
4.5
15.4
4.2
8.6
3.8
5.5
Mar 2016
5.0
4.5
4.7
16.0
4.3
8.9
3.9
5.6
Apr 2016
5.1
4.7
4.6
16.1
4.4
8.8
3.8
6.2
May 2016
4.8
4.4
4.3
15.9
4.2
8.2
4.1
5.7
June 2016
4.9
4.5
4.4
16.0
4.3
8.7
3.6
6.0
July 2016
4.8
4.7
4.1
15.2
4.2
8.2
3.8
5.4
Aug 2016
4.9
4.5
4.4
15.7
4.4
8.0
4.1
5.6
Sept 2016
5.0
4.7
4.4
16.1
4.4
8.5
3.8
6.2
Oct 2016
4.9
4.6
4.4
15.8
4.4
8.5
3.4
5.7
Nov 2016
4.7
4.4
4.3
15.5
4.2
8.2
3.1
5.6
Dec 2016
4.7
4.4
4.3
14.9
4.2
8.0
2.7
5.8
Jan 2017
4.7
4.3
4.3
14.6
4.2
7.5
3.6
5.8
Feb 2017
4.6
4.2
4.2
14.6
4.0
8.0
3.5
5.6
Mar 2017
4.4
4.2
4.0
13.4
3.8
7.8
3.2
5.0
Apr 2017
4.4
3.9
4.1
14.4
3.9
7.7
3.3
5.2
May 2017
4.4
3.9
4.1
14.2
3.7
7.7
3.6
5.2
June 2017
4.3
3.9
3.9
13.6
3.8
6.9
3.7
5.0
July 2017
4.3
4.0
3.9
13.2
3.8
7.3
3.7
5.1
Aug 2017
4.4
4.1
4.0
13.9
3.9
7.7
3.9
5.1
Sept 2017
4.3
3.9
3.9
12.9
3.7
7.2
3.6
5.1
Oct 2017
4.2
3.9
3.7
14.0
3.6
7.6
3.0
5.0
Nov 2017
4.2
3.8
3.7
16.2
3.7
7.5
3.1
4.9
Dec 2017
4.1
3.8
3.8
13.6
3.7
6.7
2.6
5.0
Jan 2018
4.0
3.7
3.6
13.8
3.5
7.5
2.9
4.9
Feb 2018
4.1
3.6
3.7
14.4
3.6
6.8
3.0
4.9
Mar 2018
4.0
3.6
3.7
13.2
3.5
6.7
3.1
4.9
Apr 2018
4.0
3.7
3.6
12.7
3.6
6.4
2.9
4.8
May 2018
3.8
3.6
3.4
13.1
3.5
5.9
2.2
4.8
June 2018
4.0
3.7
3.6
12.6
3.5
6.4
3.2
4.5
July 2018
3.8
3.4
3.6
12.9
3.4
6.5
3.0
4.5
Aug 2018
3.8
3.5
3.5
12.8
3.4
6.3
2.9
4.7
Sept 2018
3.7
3.5
3.3
12.3
3.3
6.1
3.5
4.6
Oct 2018
3.8
3.6
3.4
12.1
3.4
6.5
3.1
4.4
Nov 2018
3.8
3.4
3.5
12.4
3.4
6.1
2.8
4.7
Dec 2018
3.9
3.6
3.5
12.6
3.5
6.6
3.3
4.4
Jan 2019
4.0
3.6
3.6
13.2
3.5
7.0
3.0
4.8
Feb 2019
3.8
3.4
3.4
13.8
3.2
7.2
3.2
4.2
Mar 2019
3.8
3.5
3.4
12.7
3.3
6.7
3.0
4.7
Apr 2019
3.7
3.4
3.2
13.1
3.2
6.7
2.3
4.2
May 2019
3.6
3.3
3.3
12.9
3.2
6.1
2.6
4.2
June 2019
3.6
3.3
3.3
12.6
3.3
5.8
2.0
4.3
July 2019
3.7
3.4
3.3
12.6
3.4
5.7
2.8
4.5
Aug 2019
3.6
3.4
3.2
12.3
3.4
5.3
2.8
4.1
Sept 2019
3.5
3.3
3.1
12.2
3.2
5.3
2.5
3.9
Oct 2019
3.6
3.4
3.2
11.9
3.2
5.5
2.9
4.1
Nov 2019
3.6
3.2
3.3
12.0
3.2
5.5
2.6
4.3
Dec 2019
3.6
3.2
3.3
12.6
3.2
6.0
2.6
4.2
Jan 2020
3.6
3.2
3.3
12.5
3.1
6.4
3.0
4.3
Feb 2020
3.5
3.3
3.1
11.3
3.0
6.1
2.5
4.4
Mar 2020
4.4
4.1
4.0
14.3
3.9
7.0
4.2
6.1
Apr 2020
14.8
13.0
15.5
32.8
14.2
16.9
14.5
18.9
May 2020
13.2
11.5
13.9
30.5
12.3
16.8
15.0
17.6
June 2020
11.0
10.1
11.2
22.5
10.0
15.3
13.6
14.5
July 2020
10.2
9.4
10.5
19.2
9.2
14.3
12.0
12.8
Aug 2020
8.4
7.9
8.3
16.5
7.3
12.8
10.5
10.4
Sept 2020
7.8
7.3
7.8
16.0
7.0
12.0
8.9
10.2
Oct 2020
6.9
6.8
6.4
13.8
6.0
10.9
7.5
8.8
Nov 2020
6.7
6.6
6.1
13.8
6.0
10.3
6.7
8.5
Dec 2020
6.7
6.4
6.3
15.8
6.1
10.0
6.0
9.3
Jan 2021
6.4
6.1
6.0
15.1
5.8
9.4
6.6
8.5
Feb 2021
6.2
6.0
5.9
13.9
5.6
10.0
5.1
8.5
Mar 2021
6.1
5.9
5.7
12.9
5.4
9.8
6.0
8.0
Apr 2021
6.1
6.0
5.7
12.1
5.3
10.3
5.8
7.9
May 2021
5.8
5.8
5.3
9.7
5.0
9.1
5.7
7.3
June 2021
5.9
5.8
5.5
11.2
5.3
9.1
5.5
7.3
July 2021
5.4
5.4
5.0
10.4
4.8
8.0
5.2
6.4
Aug 2021
5.1
5.0
4.7
11.1
4.5
8.6
4.4
6.0
Sept 2021
4.7
4.6
4.3
11.2
4.2
7.7
4.1
6.2
Oct 2021
4.5
4.3
4.2
11.3
3.9
7.6
4.1
5.6
Nov 2021
4.1
3.9
3.9
10.8
3.7
6.3
3.8
5.0
Dec 2021
3.9
3.7
3.6
11.0
3.3
7.0
3.8
4.7
Jan 2022
4.0
3.8
3.7
11.2
3.4
7.0
3.6
4.7
Feb 2022
3.9
3.6
3.7
10.2
3.3
6.7
3.0
4.4
Mar 2022
3.7
3.5
3.4
10.2
3.2
6.3
2.8
4.2
Apr 2022
3.7
3.5
3.3
10.7
3.2
6.1
3.2
4.2
May 2022
3.6
3.4
3.4
10.5
3.2
6.2
2.5
4.4
June 2022
3.6
3.4
3.3
11.0
3.3
5.8
2.9
4.4
July 2022
3.5
3.3
3.1
11.3
3.1
5.9
2.6
4.0
Aug 2022
3.6
3.4
3.2
10.2
3.1
6.3
2.7
4.4
Sept 2022
3.5
3.3
3.1
11.4
3.0
5.8
2.4
3.9
Oct 2022
3.6
3.3
3.4
10.7
3.2
5.8
2.9
4.2
Nov 2022
3.6
3.3
3.3
11.2
3.2
5.6
2.6
4.0
Dec 2022
3.5
3.2
3.2
10.4
3.1
5.8
2.5
4.2
Jan 2023
3.5
3.3
3.1
10.6
3.1
5.4
2.9
4.6
Feb 2023
3.6
3.3
3.3
11.1
3.2
5.8
3.4
5.5
Mar 2023
3.5
3.4
3.1
9.8
3.3
5.1
2.9
4.7
Apr 2023
3.4
3.3
3.1
9.4
3.1
4.8
2.9
4.4
May 2023
3.6
3.4
3.3
10.3
3.3
5.7
3.0
4.1
June 2023
3.6
3.4
3.2
11.2
3.1
6.0
3.1
4.3
July 2023
3.5
3.4
3.1
11.3
3.1
5.7
2.3
4.4
Aug 2023
3.7
3.6
3.2
12.3
3.4
5.3
3.1
4.8
Sept 2023
3.7
3.7
3.1
11.7
3.4
5.7
2.7
4.6
Oct 2023
3.9
3.7
3.2
13.2
3.5
5.8
3.0
4.8
Nov 2023
3.7
3.7
3.1
11.3
3.3
5.7
3.5
4.5
Dec 2023
3.8
3.6
3.3
11.8
3.5
5.2
3.1
5.0
Jan 2024
3.7
3.6
3.2
10.7
3.4
5.3
2.9
5.0
Feb 2024
3.9
3.5
3.5
12.6
3.4
5.7
3.5
5.1
Mar 2024
3.9
3.5
3.6
12.5
3.4
6.5
2.6
4.5
Apr 2024
3.9
3.6
3.5
11.8
3.5
5.6
2.9
4.8
May 2024
3.9
3.8
3.4
12.3
3.5
6.2
3.1
5.0
June 2024
4.1
3.8
3.7
12.2
3.5
6.3
4.1
5.0
July 2024
4.2
4.0
3.8
12.5
3.8
6.2
3.6
5.3
Aug 2024
4.2
3.9
3.7
14.3
3.8
6.1
4.1
5.4
Sept 2024
4.1
3.8
3.5
14.3
3.6
5.7
4.0
5.1
Oct 2024
4.1
3.9
3.6
13.8
3.8
5.7
3.9
5.1
Nov 2024
4.2
3.9
3.8
13.0
3.8
6.3
3.8
5.3
Dec 2024
4.1
3.8
3.8
12.3
3.6
6.1
3.5
5.1
Jan 2025
4.0
3.8
3.6
11.8
3.5
6.2
3.7
4.8
Feb 2025
4.2
3.8
3.8
13.0
3.8
6.0
3.2
5.2
Mar 2025
4.2
3.9
3.7
13.8
3.7
6.2
3.5
5.1
Apr 2025
4.2
3.9
3.7
13.0
3.8
6.4
3.1
5.2
May 2025
4.3
3.9
3.9
13.4
3.8
6.1
3.6
5.1
June 2025
4.1
3.9
3.6
14.5
3.6
6.9
3.6
4.8
July 2025
4.3
4.0
3.7
15.2
3.7
7.2
3.9
5.0
Aug 2025
4.3
4.1
3.9
13.9
3.7
7.6
3.6
5.3
Sept 2025
4.4
4.1
4.1
13.3
3.7
7.6
4.3
5.5
Oct 2025
-
-
-
-
-
-
-
-
Nov 2025
4.5
4.1
4.1
16.3
3.9
8.2
3.6
5.0
Dec 2025
4.4
3.9
3.9
15.7
3.8
7.5
3.6
4.9
Jan 2026
4.3
3.8
4.1
13.6
3.7
7.3
4.2
4.9
Feb 2026
4.4
4.0
4.1
14.9
3.7
7.7
4.8
5.2
Mar 2026
4.3
3.8
4.0
13.7
3.6
7.1
3.7
4.8
Apr 2026
4.3
4.0
3.9
14.4
3.7
7.3
3.3
5.0
May 2026
4.3
4.0
3.8
14.7
3.8
6.6
3.8
5.0
June 2026
4.2
3.9
3.7
14.6
3.6
6.6
3.9
5.2
Unemployment Rate:
4.2% in Jun 2026
![]()
Change in Unemployment Level:
-213,000 in Jun 2026
![]()
Change in Employment Level:
-507,000 in Jun 2026
![]()
Change in Civilian Labor Force Level:
-720,000 in Jun 2026
![]()
Civilian Labor Force Participation Rate:
61.5% in Jun 2026
![]()
Employment-Population Ratio:
59.0% in Jun 2026
![]()
Unemployment Rate:
4.3% for 2025
![]()
Unemployment Level:
7,314,000 for 2025
![]()
Learn how the U.S. Bureau of Labor Statistics calculates the unemployment rate.
07/02/2026
Both total nonfarm payroll employment (+57,000) and the unemployment rate (4.2 percent)
changed little in June. Employment continued to trend up in professional and business
services, social assistance, and health care. Leisure and hospitality lost jobs.
HTML
|
PDF
|
RSS
|
Charts
07/21/2026
Median weekly earnings of the nation's 120.9 million full-time wage
and salary workers were $1,251 in the second quarter of 2026
(not seasonally adjusted). This was 4.6 percent higher than a year
earlier, compared with a gain of 3.9 percent in the CPI-U.
HTML
|
PDF
|
RSS
|
Charts
See the CPS release calendar for a schedule of news releases on other topics.

This Beyond the Numbers article uses data from the Current Population Survey (CPS) and the American Time Use Survey (ATUS) to provide insights into the labor force participation and activities of older individuals. read more »

This article discusses the California Work and Health Survey (CWHS), a longitudinal survey developed by the California Labor Laboratory and conducted between November 2022 and May 2023 read more »
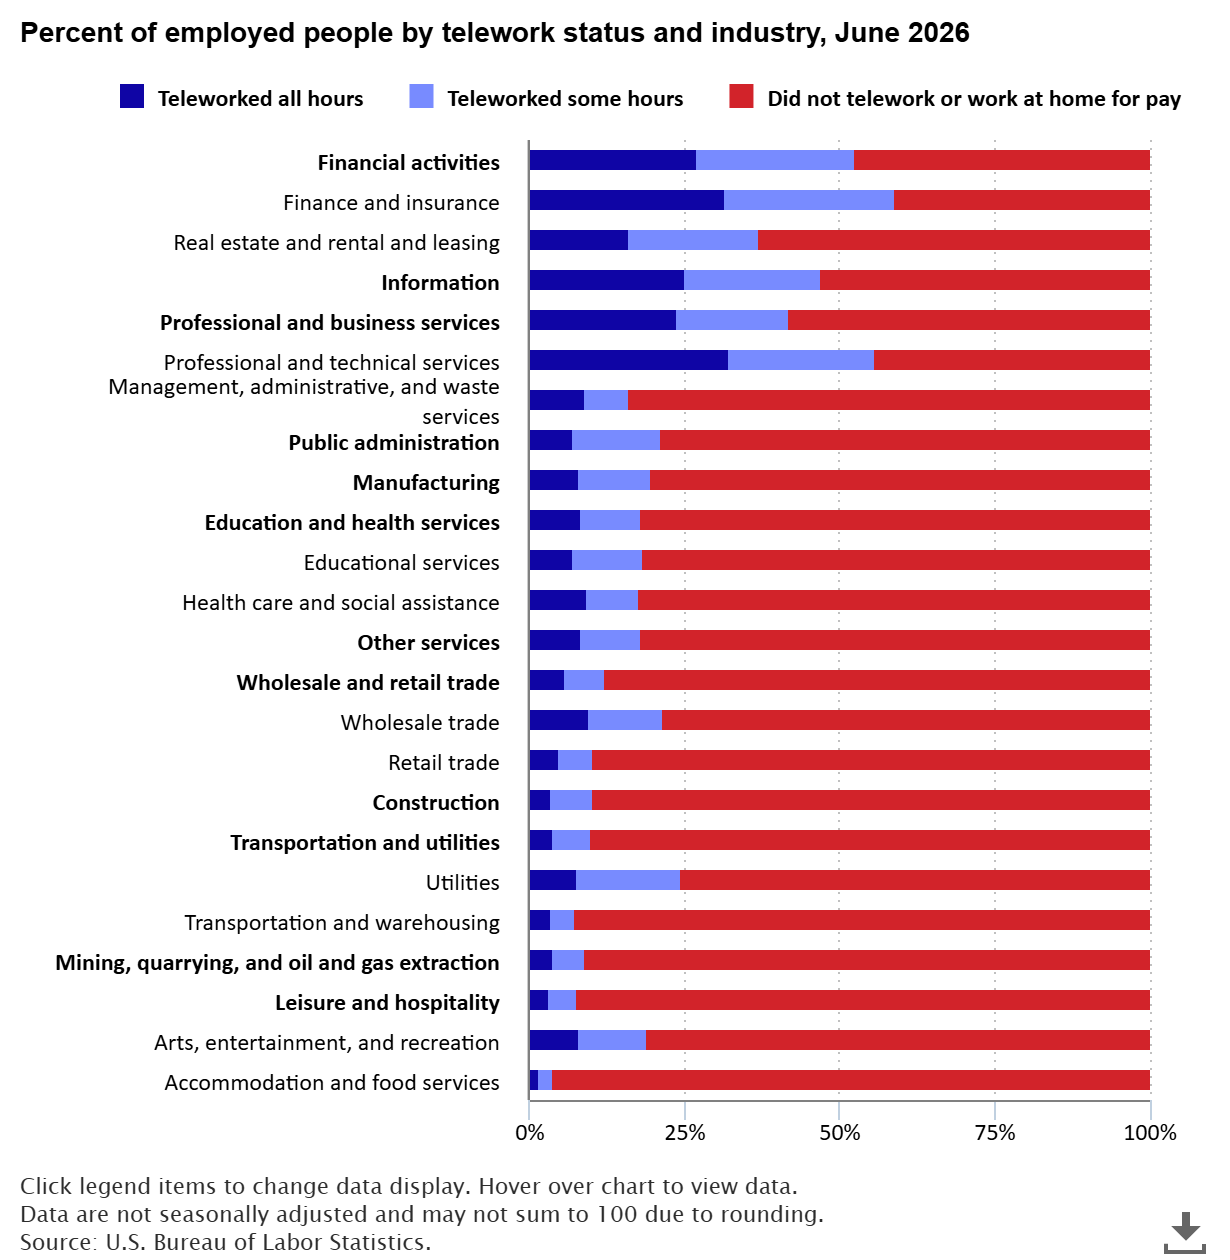
Among major industries in June 2026, telework rates were highest in financial activities (52.5 percent), information (47.2 percent), and professional and business services (41.8 percent). The telework rate measures the number of people who teleworked or worked at home for pay as a percentage of people who were working. read more »

During the pandemic, median unemployment duration was highest in 2021, with a duration of 16.5 weeks nationwide. However, unemployment duration varied by state, with durations ranging from 4.9 weeks (South Dakota) to 30.1 weeks (Nevada) in 2021. In 2023, when the national median unemployment duration was 8.9 weeks, state figures ranged from 4.3 weeks (Nebraska and South Dakota) to 17.5 weeks (the District of Columbia). read more »