
An official website of the United States government
An official website of the United States government
The .gov means it's official.
Federal government websites often end in .gov or .mil. Before sharing sensitive information,
make sure you're on a federal government site.
The site is secure.
The
https:// ensures that you are connecting to the official website and that any
information you provide is encrypted and transmitted securely.
All computer occupations not listed separately. Excludes �Computer and Information Systems Managers� (11-3021), �Computer Hardware Engineers� (17-2061), �Electrical and Electronics Engineers� (17-2070), �Computer Science Teachers, Postsecondary� (25-1021), �Special Effects Artists and Animators� (27-1014), �Graphic Designers� (27-1024), �Health Information Technologists and Medical Registrars� (29-9021), and �Computer, Automated Teller, and Office Machine Repairers� (49-2011).
Employment estimate and mean wage estimates for Computer Occupations, All Other:
| Employment (1) | Employment RSE (3) |
Mean hourly wage |
Mean annual wage (2) |
Wage RSE (3) |
|---|---|---|---|---|
| 437,170 | 0.8 % | $ 54.05 | $ 112,430 | 0.5 % |
Percentile wage estimates for Computer Occupations, All Other:
| Percentile | 10% | 25% | 50% (Median) |
75% | 90% |
|---|---|---|---|---|---|
| Hourly Wage | $ 23.89 | $ 34.61 | $ 50.44 | $ 68.18 | $ 83.80 |
| Annual Wage (2) | $ 49,690 | $ 71,990 | $ 104,920 | $ 141,820 | $ 174,300 |
Industries with the highest published employment and wages for Computer Occupations, All Other are provided. For a list of all industries with employment in Computer Occupations, All Other, see the Create Customized Tables function.
Industries with the highest levels of employment in Computer Occupations, All Other:
| Industry | Employment (1) | Percent of industry employment | Hourly mean wage | Annual mean wage (2) |
|---|---|---|---|---|
| Federal, State, and Local Government, excluding State and Local Government Schools and Hospitals and the U.S. Postal Service (OEWS Designation) | 83,690 | 3.91 | $ 56.68 | $ 117,900 |
| Computer Systems Design and Related Services | 75,790 | 2.99 | $ 57.85 | $ 120,320 |
| Management, Scientific, and Technical Consulting Services | 24,220 | 1.31 | $ 49.93 | $ 103,860 |
| Management of Companies and Enterprises | 23,250 | 0.84 | $ 58.61 | $ 121,900 |
| Computing Infrastructure Providers, Data Processing, Web Hosting, and Related Services | 13,430 | 2.79 | $ 61.55 | $ 128,030 |
Industries with the highest concentration of employment in Computer Occupations, All Other:
| Industry | Employment (1) | Percent of industry employment | Hourly mean wage | Annual mean wage (2) |
|---|---|---|---|---|
| Federal, State, and Local Government, excluding State and Local Government Schools and Hospitals and the U.S. Postal Service (OEWS Designation) | 83,690 | 3.91 | $ 56.68 | $ 117,900 |
| Manufacturing and Reproducing Magnetic and Optical Media | 370 | 3.20 | $ 68.93 | $ 143,370 |
| Computer Systems Design and Related Services | 75,790 | 2.99 | $ 57.85 | $ 120,320 |
| Computing Infrastructure Providers, Data Processing, Web Hosting, and Related Services | 13,430 | 2.79 | $ 61.55 | $ 128,030 |
| Web Search Portals, Libraries, Archives, and Other Information Services | 3,320 | 1.80 | (8) | (8) |
Top paying industries for Computer Occupations, All Other:
| Industry | Employment (1) | Percent of industry employment | Hourly mean wage | Annual mean wage (2) |
|---|---|---|---|---|
| Computer and Peripheral Equipment Manufacturing | (8) | (8) | $ 76.07 | $ 158,230 |
| Local Messengers and Local Delivery | 50 | 0.03 | $ 74.14 | $ 154,200 |
| Other Investment Pools and Funds | 40 | 0.19 | $ 71.63 | $ 149,000 |
| Semiconductor and Other Electronic Component Manufacturing | 1,770 | 0.45 | $ 69.85 | $ 145,290 |
| Travel Arrangement and Reservation Services | 510 | 0.27 | $ 69.66 | $ 144,880 |
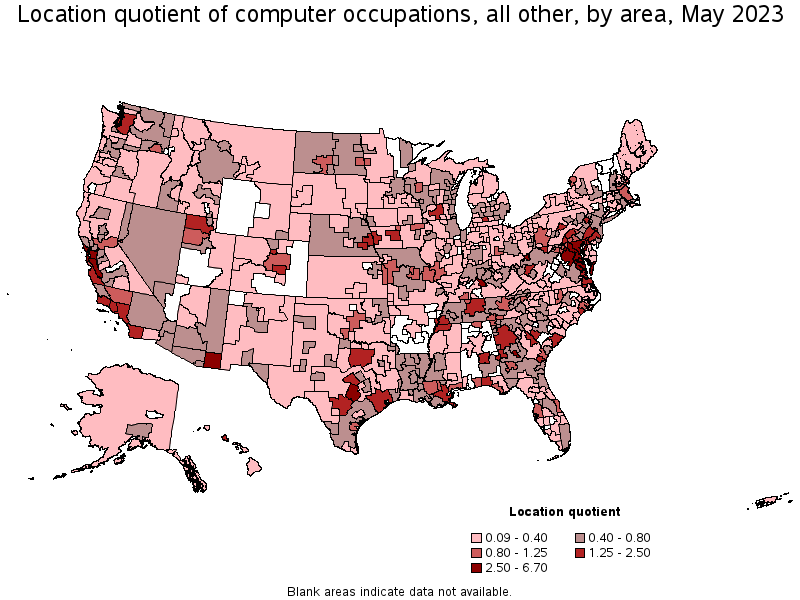
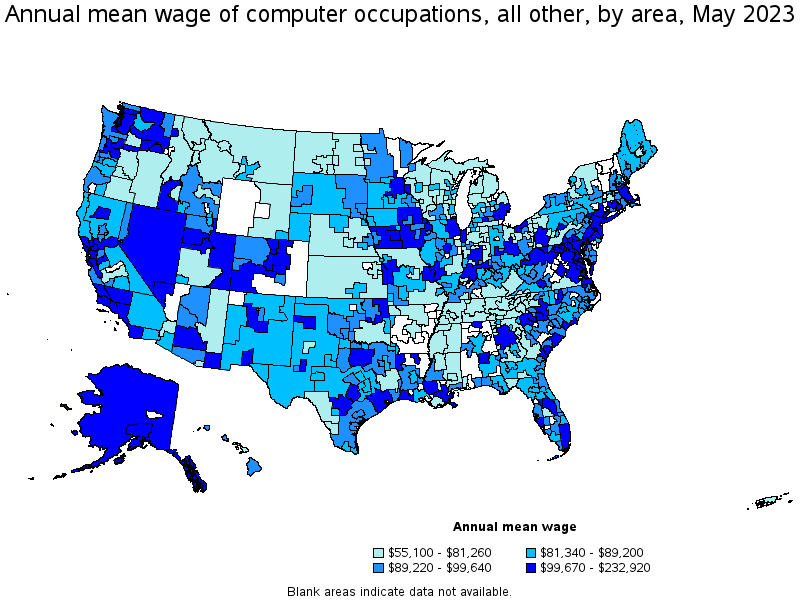
States and areas with the highest published employment, location quotients, and wages for Computer Occupations, All Other are provided. For a list of all areas with employment in Computer Occupations, All Other, see the Create Customized Tables function.
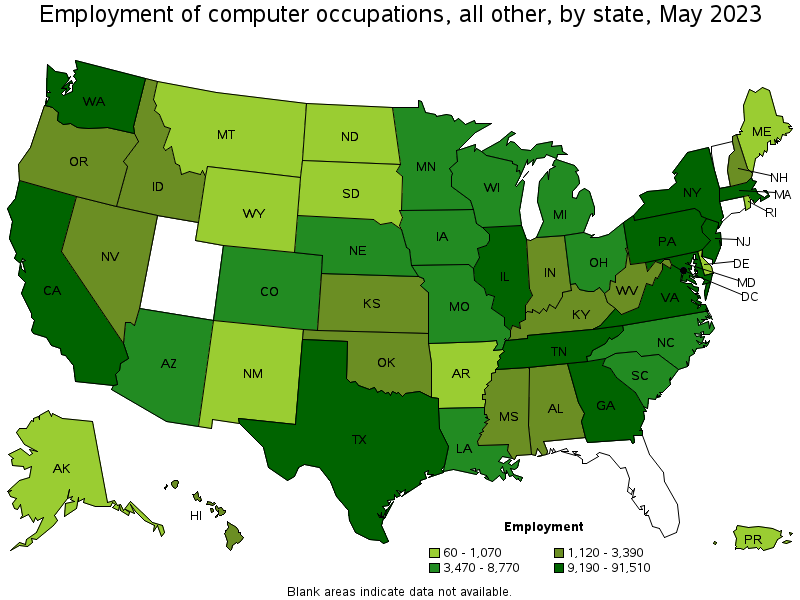
States with the highest employment level in Computer Occupations, All Other:
| State | Employment (1) | Employment per thousand jobs | Location quotient (9) | Hourly mean wage | Annual mean wage (2) |
|---|---|---|---|---|---|
| California | 91,510 | 5.10 | 1.77 | $ 60.89 | $ 126,640 |
| Texas | 59,460 | 4.39 | 1.52 | $ 51.44 | $ 106,990 |
| Maryland | 21,560 | 8.05 | 2.80 | $ 64.72 | $ 134,610 |
| Pennsylvania | 20,230 | 3.40 | 1.18 | $ 50.34 | $ 104,710 |
| District of Columbia | 16,960 | 24.17 | 8.39 | $ 63.12 | $ 131,290 |
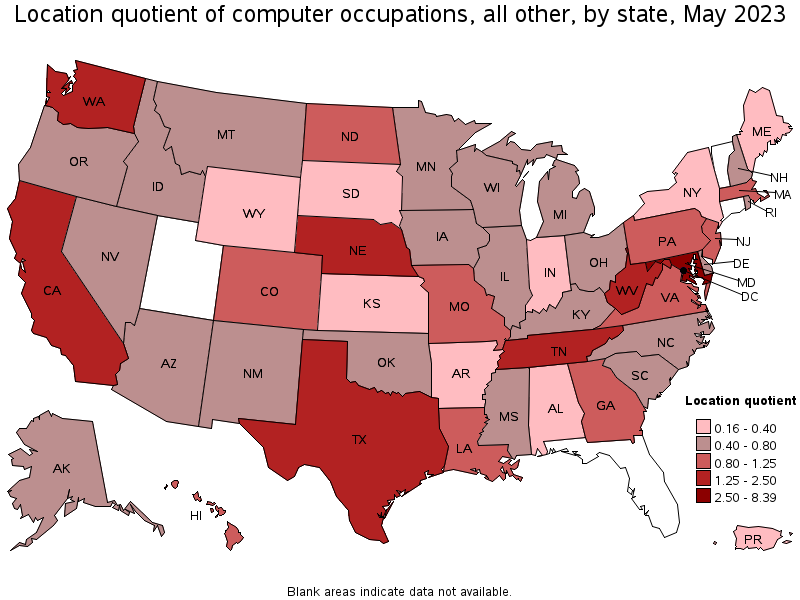
States with the highest concentration of jobs and location quotients in Computer Occupations, All Other:
| State | Employment (1) | Employment per thousand jobs | Location quotient (9) | Hourly mean wage | Annual mean wage (2) |
|---|---|---|---|---|---|
| District of Columbia | 16,960 | 24.17 | 8.39 | $ 63.12 | $ 131,290 |
| Maryland | 21,560 | 8.05 | 2.80 | $ 64.72 | $ 134,610 |
| California | 91,510 | 5.10 | 1.77 | $ 60.89 | $ 126,640 |
| West Virginia | 3,390 | 4.92 | 1.71 | $ 52.84 | $ 109,910 |
| Washington | 15,410 | 4.41 | 1.53 | $ 62.93 | $ 130,890 |
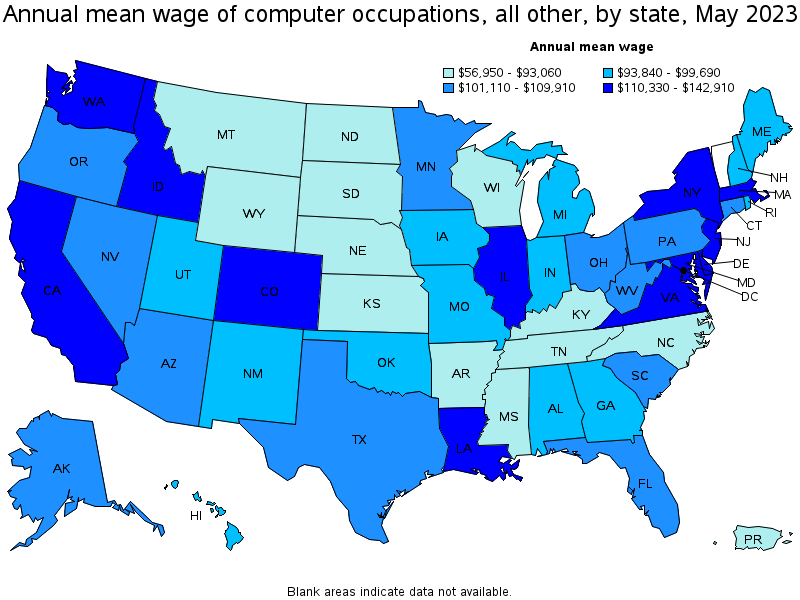
Top paying states for Computer Occupations, All Other:
| State | Employment (1) | Employment per thousand jobs | Location quotient (9) | Hourly mean wage | Annual mean wage (2) |
|---|---|---|---|---|---|
| Delaware | 1,070 | 2.27 | 0.79 | $ 68.71 | $ 142,910 |
| Colorado | 7,810 | 2.76 | 0.96 | $ 67.53 | $ 140,460 |
| Maryland | 21,560 | 8.05 | 2.80 | $ 64.72 | $ 134,610 |
| District of Columbia | 16,960 | 24.17 | 8.39 | $ 63.12 | $ 131,290 |
| Washington | 15,410 | 4.41 | 1.53 | $ 62.93 | $ 130,890 |
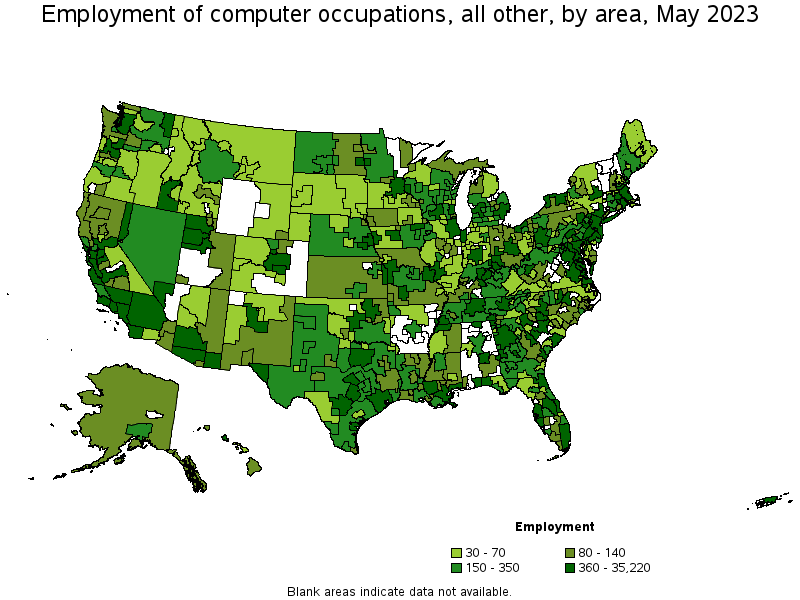
Metropolitan areas with the highest employment level in Computer Occupations, All Other:
| Metropolitan area | Employment (1) | Employment per thousand jobs | Location quotient (9) | Hourly mean wage | Annual mean wage (2) |
|---|---|---|---|---|---|
| Washington-Arlington-Alexandria, DC-VA-MD-WV | 35,220 | 11.39 | 3.96 | $ 64.57 | $ 134,300 |
| Los Angeles-Long Beach-Anaheim, CA | 23,940 | 3.87 | 1.34 | $ 52.93 | $ 110,080 |
| Dallas-Fort Worth-Arlington, TX | 21,320 | 5.37 | 1.87 | $ 52.96 | $ 110,160 |
| San Francisco-Oakland-Hayward, CA | 20,120 | 8.31 | 2.89 | $ 67.27 | $ 139,930 |
| San Jose-Sunnyvale-Santa Clara, CA | 17,790 | 15.58 | 5.41 | $ 80.43 | $ 167,290 |
| New York-Newark-Jersey City, NY-NJ-PA | 14,520 | 1.53 | 0.53 | $ 58.57 | $ 121,830 |
| Seattle-Tacoma-Bellevue, WA | 12,130 | 5.83 | 2.03 | $ 65.93 | $ 137,130 |
| Houston-The Woodlands-Sugar Land, TX | 11,950 | 3.76 | 1.31 | $ 54.37 | $ 113,090 |
| Atlanta-Sandy Springs-Roswell, GA | 11,160 | 3.96 | 1.38 | $ 49.12 | $ 102,170 |
| Philadelphia-Camden-Wilmington, PA-NJ-DE-MD | 10,290 | 3.64 | 1.26 | $ 55.37 | $ 115,160 |
Metropolitan areas with the highest concentration of jobs and location quotients in Computer Occupations, All Other:
| Metropolitan area | Employment (1) | Employment per thousand jobs | Location quotient (9) | Hourly mean wage | Annual mean wage (2) |
|---|---|---|---|---|---|
| California-Lexington Park, MD | 910 | 19.28 | 6.70 | $ 60.47 | $ 125,780 |
| San Jose-Sunnyvale-Santa Clara, CA | 17,790 | 15.58 | 5.41 | $ 80.43 | $ 167,290 |
| Sierra Vista-Douglas, AZ | 490 | 14.46 | 5.02 | $ 51.54 | $ 107,200 |
| Washington-Arlington-Alexandria, DC-VA-MD-WV | 35,220 | 11.39 | 3.96 | $ 64.57 | $ 134,300 |
| Parkersburg-Vienna, WV | 390 | 10.73 | 3.73 | $ 47.19 | $ 98,150 |
| Elizabethtown-Fort Knox, KY | 550 | 10.26 | 3.56 | $ 47.09 | $ 97,950 |
| Warner Robins, GA | 650 | 8.50 | 2.95 | $ 42.86 | $ 89,150 |
| San Francisco-Oakland-Hayward, CA | 20,120 | 8.31 | 2.89 | $ 67.27 | $ 139,930 |
| Austin-Round Rock, TX | 10,230 | 8.28 | 2.88 | $ 51.65 | $ 107,440 |
| Baltimore-Columbia-Towson, MD | 9,770 | 7.49 | 2.60 | $ 65.40 | $ 136,020 |
Top paying metropolitan areas for Computer Occupations, All Other:
| Metropolitan area | Employment (1) | Employment per thousand jobs | Location quotient (9) | Hourly mean wage | Annual mean wage (2) |
|---|---|---|---|---|---|
| Boulder, CO | 1,200 | 6.15 | 2.14 | $ 111.98 | $ 232,920 |
| San Jose-Sunnyvale-Santa Clara, CA | 17,790 | 15.58 | 5.41 | $ 80.43 | $ 167,290 |
| San Francisco-Oakland-Hayward, CA | 20,120 | 8.31 | 2.89 | $ 67.27 | $ 139,930 |
| Seattle-Tacoma-Bellevue, WA | 12,130 | 5.83 | 2.03 | $ 65.93 | $ 137,130 |
| Baltimore-Columbia-Towson, MD | 9,770 | 7.49 | 2.60 | $ 65.40 | $ 136,020 |
| Washington-Arlington-Alexandria, DC-VA-MD-WV | 35,220 | 11.39 | 3.96 | $ 64.57 | $ 134,300 |
| Bridgeport-Stamford-Norwalk, CT | 130 | 0.33 | 0.11 | $ 63.13 | $ 131,300 |
| Boise City, ID | 790 | 2.13 | 0.74 | $ 62.75 | $ 130,520 |
| Denver-Aurora-Lakewood, CO | 4,540 | 2.86 | 0.99 | $ 61.63 | $ 128,200 |
| Morgantown, WV | 340 | 5.19 | 1.80 | $ 60.93 | $ 126,730 |
Nonmetropolitan areas with the highest employment in Computer Occupations, All Other:
| Nonmetropolitan area | Employment (1) | Employment per thousand jobs | Location quotient (9) | Hourly mean wage | Annual mean wage (2) |
|---|---|---|---|---|---|
| Northeast Virginia nonmetropolitan area | 420 | 8.35 | 2.90 | $ 61.36 | $ 127,640 |
| North Texas Region of Texas nonmetropolitan area | 300 | 1.09 | 0.38 | $ 45.74 | $ 95,140 |
| South Georgia nonmetropolitan area | 300 | 1.57 | 0.55 | $ 39.30 | $ 81,740 |
| Western Wisconsin nonmetropolitan area | 280 | 2.09 | 0.73 | $ 35.91 | $ 74,700 |
| Central Missouri nonmetropolitan area | 280 | 1.73 | 0.60 | $ 40.06 | $ 83,320 |
Nonmetropolitan areas with the highest concentration of jobs and location quotients in Computer Occupations, All Other:
| Nonmetropolitan area | Employment (1) | Employment per thousand jobs | Location quotient (9) | Hourly mean wage | Annual mean wage (2) |
|---|---|---|---|---|---|
| Northeast Virginia nonmetropolitan area | 420 | 8.35 | 2.90 | $ 61.36 | $ 127,640 |
| Central Louisiana nonmetropolitan area | 170 | 2.16 | 0.75 | $ 47.69 | $ 99,180 |
| Western Wisconsin nonmetropolitan area | 280 | 2.09 | 0.73 | $ 35.91 | $ 74,700 |
| South Central Tennessee nonmetropolitan area | 230 | 2.07 | 0.72 | $ 32.60 | $ 67,800 |
| Southwest Louisiana nonmetropolitan area | 140 | 2.06 | 0.72 | (8) | (8) |
Top paying nonmetropolitan areas for Computer Occupations, All Other:
| Nonmetropolitan area | Employment (1) | Employment per thousand jobs | Location quotient (9) | Hourly mean wage | Annual mean wage (2) |
|---|---|---|---|---|---|
| Northeast Virginia nonmetropolitan area | 420 | 8.35 | 2.90 | $ 61.36 | $ 127,640 |
| Eastern Washington nonmetropolitan area | 180 | 1.70 | 0.59 | $ 57.05 | $ 118,660 |
| Southwest Colorado nonmetropolitan area | 70 | 0.68 | 0.24 | $ 53.22 | $ 110,700 |
| Eastern Utah nonmetropolitan area | 100 | 1.13 | 0.39 | $ 52.26 | $ 108,710 |
| Northeast Iowa nonmetropolitan area | 70 | 0.73 | 0.25 | $ 52.21 | $ 108,590 |
These estimates are calculated with data collected from employers in all industry sectors, all metropolitan and nonmetropolitan areas, and all states and the District of Columbia. The top employment and wage figures are provided above. The complete list is available in the downloadable XLS files.
The percentile wage estimate is the value of a wage below which a certain percent of workers fall. The median wage is the 50th percentile wage estimate—50 percent of workers earn less than the median and 50 percent of workers earn more than the median. More about percentile wages.
(1) Estimates for detailed occupations do not sum to the totals because the totals include occupations not shown separately. Estimates do not include self-employed workers.
(2) Annual wages have been calculated by multiplying the hourly mean wage by a "year-round, full-time" hours figure of 2,080 hours; for those occupations where there is not an hourly wage published, the annual wage has been directly calculated from the reported survey data.
(3) The relative standard error (RSE) is a measure of the reliability of a survey statistic. The smaller the relative standard error, the more precise the estimate.
(8) Estimate not released.
(9) The location quotient is the ratio of the area concentration of occupational employment to the national average concentration. A location quotient greater than one indicates the occupation has a higher share of employment than average, and a location quotient less than one indicates the occupation is less prevalent in the area than average.
Other OEWS estimates and related information:
May 2023 National Occupational Employment and Wage Estimates
May 2023 State Occupational Employment and Wage Estimates
May 2023 Metropolitan and Nonmetropolitan Area Occupational Employment and Wage Estimates
May 2023 National Industry-Specific Occupational Employment and Wage Estimates
Last Modified Date: April 3, 2024