
An official website of the United States government
An official website of the United States government
The .gov means it's official.
Federal government websites often end in .gov or .mil. Before sharing sensitive information,
make sure you're on a federal government site.
The site is secure.
The
https:// ensures that you are connecting to the official website and that any
information you provide is encrypted and transmitted securely.

In March 2026, 22.6 percent of workers teleworked or worked at home for pay. The telework rate (the number of people who teleworked or worked at home for pay as a percentage of people who were working) has ranged from 21.5 percent to 23.0 percent over the last year (October 2025 data are not available due to the 2025 lapse in appropriations).
read full article »
Real (adjusted for inflation) average hourly earnings increased 0.3 percent from March 2025 to March 2026, seasonally adjusted, after increasing 1.3 percent over year ended February 2026.

The Consumer Price Index for All Urban Consumers increased 3.3 percent, not seasonally adjusted, over the 12 months from March 2025 to March 2026. On a monthly basis, the all items index increased 0.9 percent, seasonally adjusted, in March 2026, after rising 0.3 percent in February and 0.2 percent in January.

Unemployment rates were higher in 14 states and the District of Columbia from January 2025 to January 2026. Two states had decreases, and 34 states had little change. The national unemployment rate, 4.3 percent in January 2026, was 0.3-percentage point higher than in January 2025.
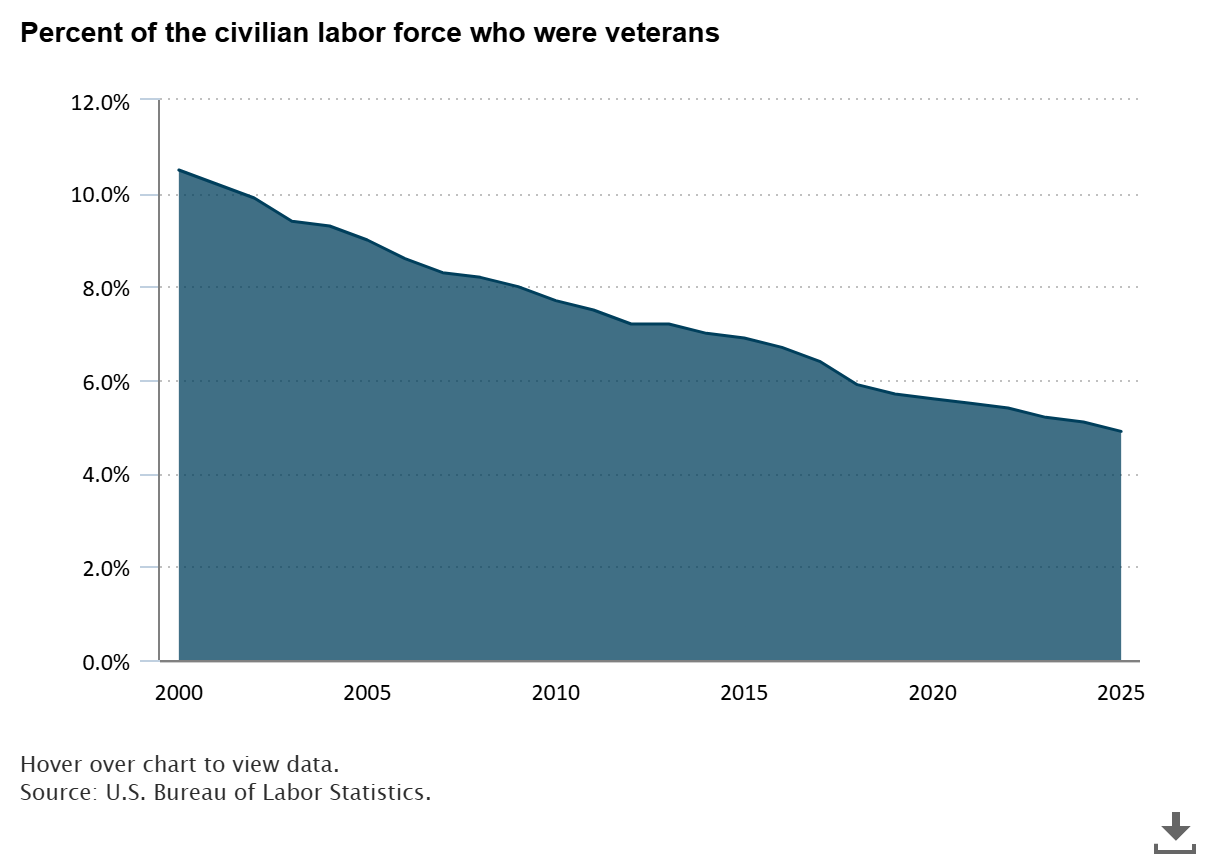
In 2025, there were 168.5 million people age 18 and over in the civilian labor force. Of those, 4.9 percent (8.3 million) were military veterans.
