
An official website of the United States government
An official website of the United States government
The .gov means it's official.
Federal government websites often end in .gov or .mil. Before sharing sensitive information,
make sure you're on a federal government site.
The site is secure.
The
https:// ensures that you are connecting to the official website and that any
information you provide is encrypted and transmitted securely.
Operate or tend heating equipment other than basic metal, plastic, or food processing equipment. Includes activities such as annealing glass, drying lumber, curing rubber, removing moisture from materials, or boiling soap.
Employment estimate and mean wage estimates for Furnace, Kiln, Oven, Drier, and Kettle Operators and Tenders:
| Employment (1) | Employment RSE (3) |
Mean hourly wage |
Mean annual wage (2) |
Wage RSE (3) |
|---|---|---|---|---|
| 14,820 | 3.1 % | $ 22.86 | $ 47,540 | 0.7 % |
Percentile wage estimates for Furnace, Kiln, Oven, Drier, and Kettle Operators and Tenders:
| Percentile | 10% | 25% | 50% (Median) |
75% | 90% |
|---|---|---|---|---|---|
| Hourly Wage | $ 16.55 | $ 18.37 | $ 21.94 | $ 26.28 | $ 30.45 |
| Annual Wage (2) | $ 34,430 | $ 38,200 | $ 45,640 | $ 54,660 | $ 63,340 |
Industries with the highest published employment and wages for Furnace, Kiln, Oven, Drier, and Kettle Operators and Tenders are provided. For a list of all industries with employment in Furnace, Kiln, Oven, Drier, and Kettle Operators and Tenders, see the Create Customized Tables function.
Industries with the highest levels of employment in Furnace, Kiln, Oven, Drier, and Kettle Operators and Tenders:
| Industry | Employment (1) | Percent of industry employment | Hourly mean wage | Annual mean wage (2) |
|---|---|---|---|---|
| Nonmetallic Mineral Product Manufacturing | 4,760 | 1.14 | $ 22.98 | $ 47,790 |
| Sawmills and Wood Preservation | 1,410 | 1.53 | $ 21.24 | $ 44,180 |
| Veneer, Plywood, and Engineered Wood Product Manufacturing | 1,050 | 1.25 | $ 21.14 | $ 43,980 |
| Nonmetallic Mineral Mining and Quarrying | 680 | 0.69 | $ 25.59 | $ 53,220 |
| Rubber Product Manufacturing | 630 | 0.46 | $ 25.42 | $ 52,870 |
Industries with the highest concentration of employment in Furnace, Kiln, Oven, Drier, and Kettle Operators and Tenders:
| Industry | Employment (1) | Percent of industry employment | Hourly mean wage | Annual mean wage (2) |
|---|---|---|---|---|
| Sawmills and Wood Preservation | 1,410 | 1.53 | $ 21.24 | $ 44,180 |
| Veneer, Plywood, and Engineered Wood Product Manufacturing | 1,050 | 1.25 | $ 21.14 | $ 43,980 |
| Nonmetallic Mineral Product Manufacturing | 4,760 | 1.14 | $ 22.98 | $ 47,790 |
| Nonmetallic Mineral Mining and Quarrying | 680 | 0.69 | $ 25.59 | $ 53,220 |
| Nonferrous Metal (except Aluminum) Production and Processing | 390 | 0.63 | $ 23.40 | $ 48,670 |
Top paying industries for Furnace, Kiln, Oven, Drier, and Kettle Operators and Tenders:
| Industry | Employment (1) | Percent of industry employment | Hourly mean wage | Annual mean wage (2) |
|---|---|---|---|---|
| Merchant Wholesalers, Nondurable Goods (4241, 4247, and 4249 only) | (8) | (8) | $ 43.27 | $ 90,000 |
| Semiconductor and Other Electronic Component Manufacturing | 90 | 0.02 | $ 33.05 | $ 68,740 |
| Pulp, Paper, and Paperboard Mills | 250 | 0.28 | $ 30.96 | $ 64,400 |
| Petroleum and Coal Products Manufacturing | 550 | 0.51 | $ 28.87 | $ 60,050 |
| Remediation and Other Waste Management Services | 40 | 0.02 | $ 26.32 | $ 54,740 |
States and areas with the highest published employment, location quotients, and wages for Furnace, Kiln, Oven, Drier, and Kettle Operators and Tenders are provided. For a list of all areas with employment in Furnace, Kiln, Oven, Drier, and Kettle Operators and Tenders, see the Create Customized Tables function.
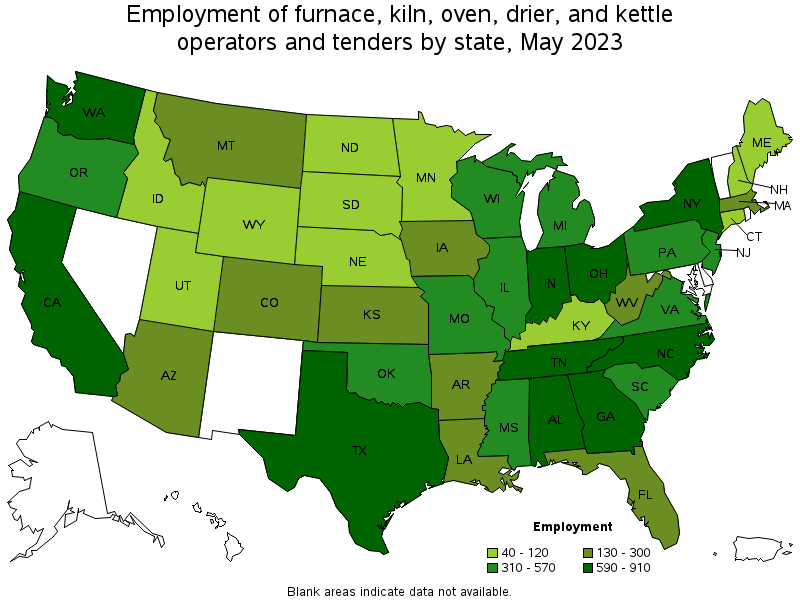
States with the highest employment level in Furnace, Kiln, Oven, Drier, and Kettle Operators and Tenders:
| State | Employment (1) | Employment per thousand jobs | Location quotient (9) | Hourly mean wage | Annual mean wage (2) |
|---|---|---|---|---|---|
| Texas | 910 | 0.07 | 0.69 | $ 20.69 | $ 43,030 |
| Ohio | 870 | 0.16 | 1.63 | $ 23.54 | $ 48,970 |
| Alabama | 690 | 0.34 | 3.44 | $ 22.99 | $ 47,830 |
| Washington | 680 | 0.20 | 2.01 | $ 24.53 | $ 51,020 |
| Indiana | 680 | 0.22 | 2.21 | $ 20.04 | $ 41,680 |
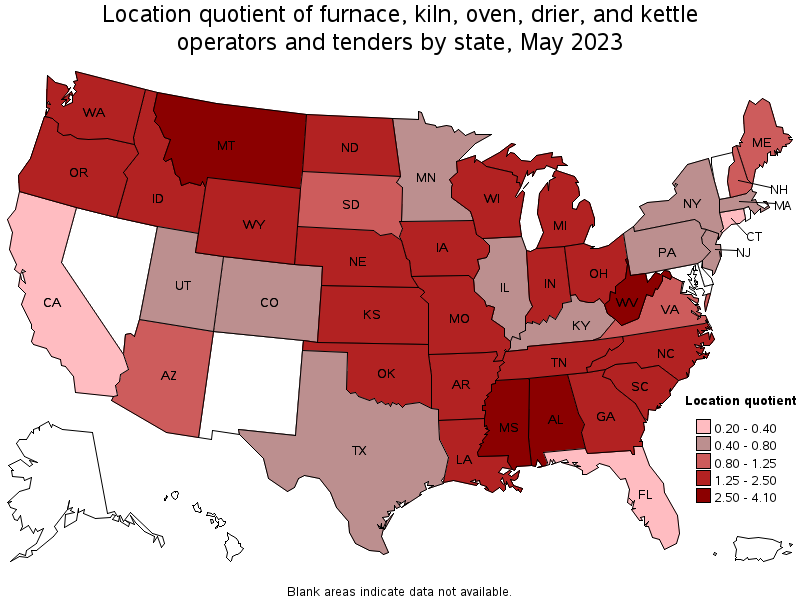
States with the highest concentration of jobs and location quotients in Furnace, Kiln, Oven, Drier, and Kettle Operators and Tenders:
| State | Employment (1) | Employment per thousand jobs | Location quotient (9) | Hourly mean wage | Annual mean wage (2) |
|---|---|---|---|---|---|
| Mississippi | 460 | 0.40 | 4.10 | $ 20.16 | $ 41,930 |
| Alabama | 690 | 0.34 | 3.44 | $ 22.99 | $ 47,830 |
| West Virginia | 210 | 0.30 | 3.10 | $ 21.41 | $ 44,540 |
| Montana | 130 | 0.25 | 2.60 | $ 17.74 | $ 36,890 |
| Arkansas | 300 | 0.24 | 2.41 | $ 21.53 | $ 44,790 |
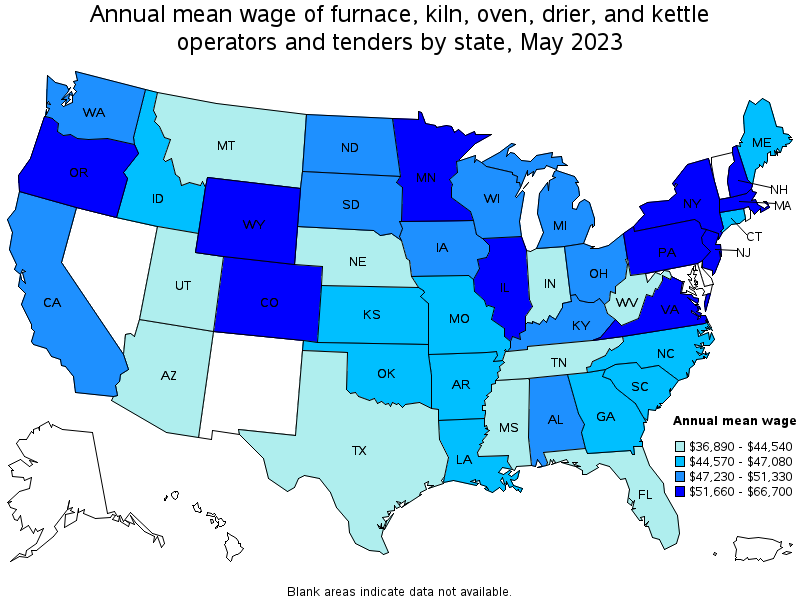
Top paying states for Furnace, Kiln, Oven, Drier, and Kettle Operators and Tenders:
| State | Employment (1) | Employment per thousand jobs | Location quotient (9) | Hourly mean wage | Annual mean wage (2) |
|---|---|---|---|---|---|
| Wyoming | 50 | 0.18 | 1.88 | $ 32.07 | $ 66,700 |
| New Jersey | 310 | 0.07 | 0.75 | $ 27.70 | $ 57,610 |
| Massachusetts | 180 | 0.05 | 0.52 | $ 26.17 | $ 54,440 |
| Minnesota | 110 | 0.04 | 0.41 | $ 26.10 | $ 54,290 |
| New York | 590 | 0.06 | 0.64 | $ 26.08 | $ 54,250 |
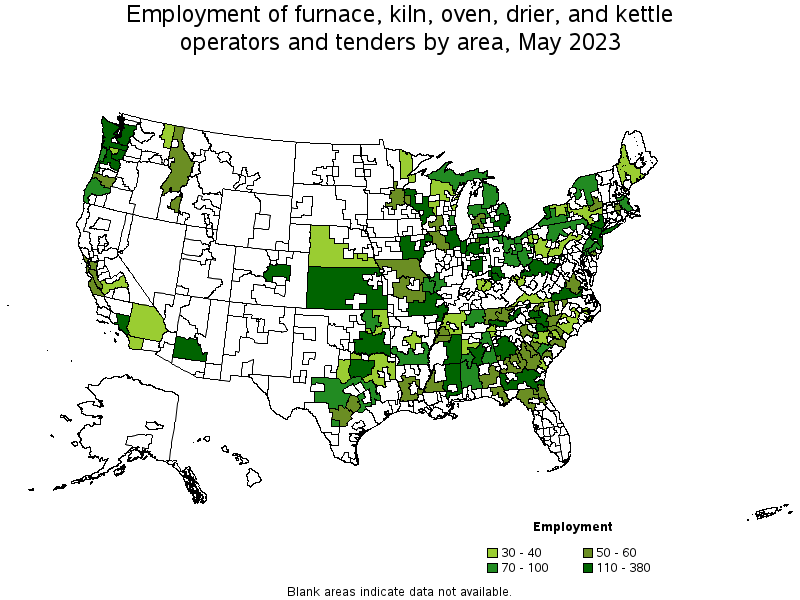
Metropolitan areas with the highest employment level in Furnace, Kiln, Oven, Drier, and Kettle Operators and Tenders:
| Metropolitan area | Employment (1) | Employment per thousand jobs | Location quotient (9) | Hourly mean wage | Annual mean wage (2) |
|---|---|---|---|---|---|
| Chicago-Naperville-Elgin, IL-IN-WI | 380 | 0.08 | 0.86 | $ 24.47 | $ 50,900 |
| Dallas-Fort Worth-Arlington, TX | 300 | 0.08 | 0.77 | $ 22.18 | $ 46,140 |
| New York-Newark-Jersey City, NY-NJ-PA | 270 | 0.03 | 0.29 | $ 27.99 | $ 58,220 |
| Seattle-Tacoma-Bellevue, WA | 260 | 0.13 | 1.29 | $ 25.25 | $ 52,520 |
| Charlotte-Concord-Gastonia, NC-SC | 200 | 0.15 | 1.54 | $ 22.30 | $ 46,380 |
| Phoenix-Mesa-Scottsdale, AZ | 200 | 0.09 | 0.88 | $ 19.75 | $ 41,080 |
| Indianapolis-Carmel-Anderson, IN | 180 | 0.17 | 1.74 | $ 19.35 | $ 40,250 |
| Birmingham-Hoover, AL | 180 | 0.36 | 3.69 | $ 24.64 | $ 51,240 |
| Los Angeles-Long Beach-Anaheim, CA | 180 | 0.03 | 0.30 | $ 22.03 | $ 45,820 |
| Detroit-Warren-Dearborn, MI | 160 | 0.08 | 0.85 | $ 24.47 | $ 50,900 |
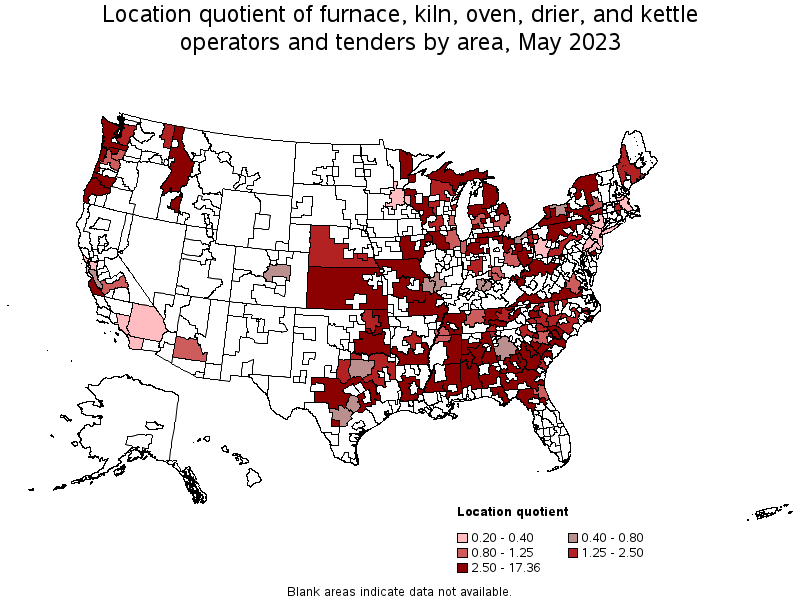
Metropolitan areas with the highest concentration of jobs and location quotients in Furnace, Kiln, Oven, Drier, and Kettle Operators and Tenders:
| Metropolitan area | Employment (1) | Employment per thousand jobs | Location quotient (9) | Hourly mean wage | Annual mean wage (2) |
|---|---|---|---|---|---|
| Vineland-Bridgeton, NJ | 60 | 0.95 | 9.74 | $ 25.37 | $ 52,770 |
| Longview, WA | 40 | 0.85 | 8.75 | $ 31.86 | $ 66,280 |
| Hickory-Lenoir-Morganton, NC | 110 | 0.70 | 7.16 | $ 22.19 | $ 46,140 |
| Tuscaloosa, AL | 70 | 0.65 | 6.66 | $ 25.18 | $ 52,370 |
| Macon, GA | 50 | 0.55 | 5.63 | $ 23.40 | $ 48,680 |
| Florence, SC | 40 | 0.46 | 4.74 | $ 20.49 | $ 42,610 |
| Elkhart-Goshen, IN | 60 | 0.41 | 4.20 | $ 20.91 | $ 43,480 |
| Birmingham-Hoover, AL | 180 | 0.36 | 3.69 | $ 24.64 | $ 51,240 |
| Huntington-Ashland, WV-KY-OH | 40 | 0.35 | 3.58 | $ 23.99 | $ 49,890 |
| Toledo, OH | 90 | 0.32 | 3.26 | $ 25.75 | $ 53,550 |
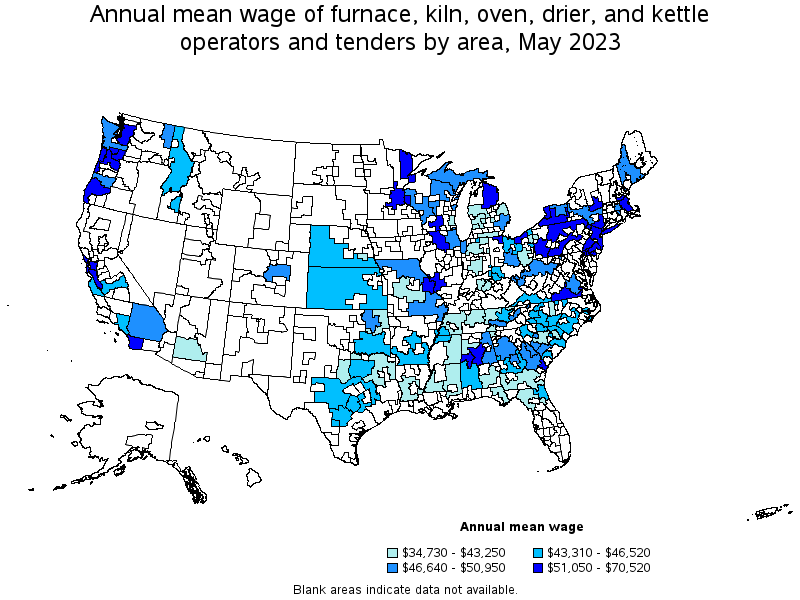
Top paying metropolitan areas for Furnace, Kiln, Oven, Drier, and Kettle Operators and Tenders:
| Metropolitan area | Employment (1) | Employment per thousand jobs | Location quotient (9) | Hourly mean wage | Annual mean wage (2) |
|---|---|---|---|---|---|
| San Francisco-Oakland-Hayward, CA | 60 | 0.03 | 0.26 | $ 33.90 | $ 70,520 |
| Longview, WA | 40 | 0.85 | 8.75 | $ 31.86 | $ 66,280 |
| Albany-Schenectady-Troy, NY | 50 | 0.12 | 1.23 | $ 31.30 | $ 65,110 |
| Duluth, MN-WI | 30 | 0.26 | 2.63 | $ 31.15 | $ 64,790 |
| New York-Newark-Jersey City, NY-NJ-PA | 270 | 0.03 | 0.29 | $ 27.99 | $ 58,220 |
| Boston-Cambridge-Nashua, MA-NH | 90 | 0.03 | 0.32 | $ 26.28 | $ 54,660 |
| Philadelphia-Camden-Wilmington, PA-NJ-DE-MD | 70 | 0.02 | 0.25 | $ 26.06 | $ 54,200 |
| San Diego-Carlsbad, CA | 30 | 0.02 | 0.23 | $ 25.99 | $ 54,050 |
| Savannah, GA | 30 | 0.18 | 1.83 | $ 25.89 | $ 53,840 |
| Toledo, OH | 90 | 0.32 | 3.26 | $ 25.75 | $ 53,550 |
Nonmetropolitan areas with the highest employment in Furnace, Kiln, Oven, Drier, and Kettle Operators and Tenders:
| Nonmetropolitan area | Employment (1) | Employment per thousand jobs | Location quotient (9) | Hourly mean wage | Annual mean wage (2) |
|---|---|---|---|---|---|
| Western Washington nonmetropolitan area | 220 | 1.69 | 17.36 | $ 24.42 | $ 50,790 |
| Southside Virginia nonmetropolitan area | 160 | 1.61 | 16.52 | $ 26.45 | $ 55,020 |
| Kansas nonmetropolitan area | 160 | 0.41 | 4.20 | $ 20.93 | $ 43,530 |
| Southeast Mississippi nonmetropolitan area | 150 | 1.01 | 10.35 | $ 18.65 | $ 38,780 |
| Southeast Oklahoma nonmetropolitan area | 140 | 0.81 | 8.32 | $ 22.11 | $ 45,980 |
Nonmetropolitan areas with the highest concentration of jobs and location quotients in Furnace, Kiln, Oven, Drier, and Kettle Operators and Tenders:
| Nonmetropolitan area | Employment (1) | Employment per thousand jobs | Location quotient (9) | Hourly mean wage | Annual mean wage (2) |
|---|---|---|---|---|---|
| Western Washington nonmetropolitan area | 220 | 1.69 | 17.36 | $ 24.42 | $ 50,790 |
| Lower Savannah South Carolina nonmetropolitan area | 90 | 1.68 | 17.24 | $ 22.51 | $ 46,820 |
| Southside Virginia nonmetropolitan area | 160 | 1.61 | 16.52 | $ 26.45 | $ 55,020 |
| Southwest Alabama nonmetropolitan area | 90 | 1.35 | 13.80 | $ 22.10 | $ 45,970 |
| Southeast Mississippi nonmetropolitan area | 150 | 1.01 | 10.35 | $ 18.65 | $ 38,780 |
Top paying nonmetropolitan areas for Furnace, Kiln, Oven, Drier, and Kettle Operators and Tenders:
| Nonmetropolitan area | Employment (1) | Employment per thousand jobs | Location quotient (9) | Hourly mean wage | Annual mean wage (2) |
|---|---|---|---|---|---|
| Northeast Lower Peninsula of Michigan nonmetropolitan area | 70 | 0.87 | 8.96 | $ 26.47 | $ 55,050 |
| Southside Virginia nonmetropolitan area | 160 | 1.61 | 16.52 | $ 26.45 | $ 55,020 |
| Northern Pennsylvania nonmetropolitan area | 100 | 0.63 | 6.50 | $ 25.49 | $ 53,020 |
| Northwest Illinois nonmetropolitan area | 50 | 0.39 | 3.98 | $ 25.48 | $ 53,000 |
| Southwest New York nonmetropolitan area | 100 | 0.59 | 6.05 | $ 25.04 | $ 52,070 |
These estimates are calculated with data collected from employers in all industry sectors, all metropolitan and nonmetropolitan areas, and all states and the District of Columbia. The top employment and wage figures are provided above. The complete list is available in the downloadable XLS files.
The percentile wage estimate is the value of a wage below which a certain percent of workers fall. The median wage is the 50th percentile wage estimate—50 percent of workers earn less than the median and 50 percent of workers earn more than the median. More about percentile wages.
(1) Estimates for detailed occupations do not sum to the totals because the totals include occupations not shown separately. Estimates do not include self-employed workers.
(2) Annual wages have been calculated by multiplying the hourly mean wage by a "year-round, full-time" hours figure of 2,080 hours; for those occupations where there is not an hourly wage published, the annual wage has been directly calculated from the reported survey data.
(3) The relative standard error (RSE) is a measure of the reliability of a survey statistic. The smaller the relative standard error, the more precise the estimate.
(8) Estimate not released.
(9) The location quotient is the ratio of the area concentration of occupational employment to the national average concentration. A location quotient greater than one indicates the occupation has a higher share of employment than average, and a location quotient less than one indicates the occupation is less prevalent in the area than average.
Other OEWS estimates and related information:
May 2023 National Occupational Employment and Wage Estimates
May 2023 State Occupational Employment and Wage Estimates
May 2023 Metropolitan and Nonmetropolitan Area Occupational Employment and Wage Estimates
May 2023 National Industry-Specific Occupational Employment and Wage Estimates
Last Modified Date: April 3, 2024