
An official website of the United States government
An official website of the United States government
The .gov means it's official.
Federal government websites often end in .gov or .mil. Before sharing sensitive information,
make sure you're on a federal government site.
The site is secure.
The
https:// ensures that you are connecting to the official website and that any
information you provide is encrypted and transmitted securely.
Create original artwork using any of a wide variety of media and techniques.
Employment estimate and mean wage estimates for Fine Artists, Including Painters, Sculptors, and Illustrators:
| Employment (1) | Employment RSE (3) |
Mean hourly wage |
Mean annual wage (2) |
Wage RSE (3) |
|---|---|---|---|---|
| 10,910 | 8.2 % | $ 34.34 | $ 71,420 | 7.1 % |
Percentile wage estimates for Fine Artists, Including Painters, Sculptors, and Illustrators:
| Percentile | 10% | 25% | 50% (Median) |
75% | 90% |
|---|---|---|---|---|---|
| Hourly Wage | $ 13.65 | $ 18.34 | $ 28.51 | $ 42.64 | $ 65.10 |
| Annual Wage (2) | $ 28,390 | $ 38,160 | $ 59,300 | $ 88,690 | $ 135,420 |
Industries with the highest published employment and wages for Fine Artists, Including Painters, Sculptors, and Illustrators are provided. For a list of all industries with employment in Fine Artists, Including Painters, Sculptors, and Illustrators, see the Create Customized Tables function.
Industries with the highest levels of employment in Fine Artists, Including Painters, Sculptors, and Illustrators:
| Industry | Employment (1) | Percent of industry employment | Hourly mean wage | Annual mean wage (2) |
|---|---|---|---|---|
| Independent Artists, Writers, and Performers | 2,900 | 4.50 | $ 31.82 | $ 66,180 |
| Software Publishers | 690 | 0.11 | (8) | (8) |
| Motion Picture and Video Industries | 540 | 0.13 | $ 43.34 | $ 90,140 |
| Other Miscellaneous Retailers | 470 | 0.09 | $ 23.59 | $ 49,070 |
| Amusement Parks and Arcades | 430 | 0.19 | $ 25.45 | $ 52,940 |
Industries with the highest concentration of employment in Fine Artists, Including Painters, Sculptors, and Illustrators:
| Industry | Employment (1) | Percent of industry employment | Hourly mean wage | Annual mean wage (2) |
|---|---|---|---|---|
| Independent Artists, Writers, and Performers | 2,900 | 4.50 | $ 31.82 | $ 66,180 |
| Specialized Design Services | 310 | 0.20 | $ 32.12 | $ 66,810 |
| Amusement Parks and Arcades | 430 | 0.19 | $ 25.45 | $ 52,940 |
| Performing Arts Companies | 210 | 0.16 | $ 28.16 | $ 58,570 |
| Motion Picture and Video Industries | 540 | 0.13 | $ 43.34 | $ 90,140 |
Top paying industries for Fine Artists, Including Painters, Sculptors, and Illustrators:
| Industry | Employment (1) | Percent of industry employment | Hourly mean wage | Annual mean wage (2) |
|---|---|---|---|---|
| Employment Services | 190 | 0.01 | $ 45.95 | $ 95,580 |
| Motion Picture and Video Industries | 540 | 0.13 | $ 43.34 | $ 90,140 |
| Newspaper, Periodical, Book, and Directory Publishers | 170 | 0.06 | $ 42.73 | $ 88,880 |
| Aerospace Product and Parts Manufacturing | 50 | 0.01 | $ 40.11 | $ 83,430 |
| Federal, State, and Local Government, excluding State and Local Government Schools and Hospitals and the U.S. Postal Service (OEWS Designation) | 80 | (7) | $ 39.94 | $ 83,080 |
States and areas with the highest published employment, location quotients, and wages for Fine Artists, Including Painters, Sculptors, and Illustrators are provided. For a list of all areas with employment in Fine Artists, Including Painters, Sculptors, and Illustrators, see the Create Customized Tables function.
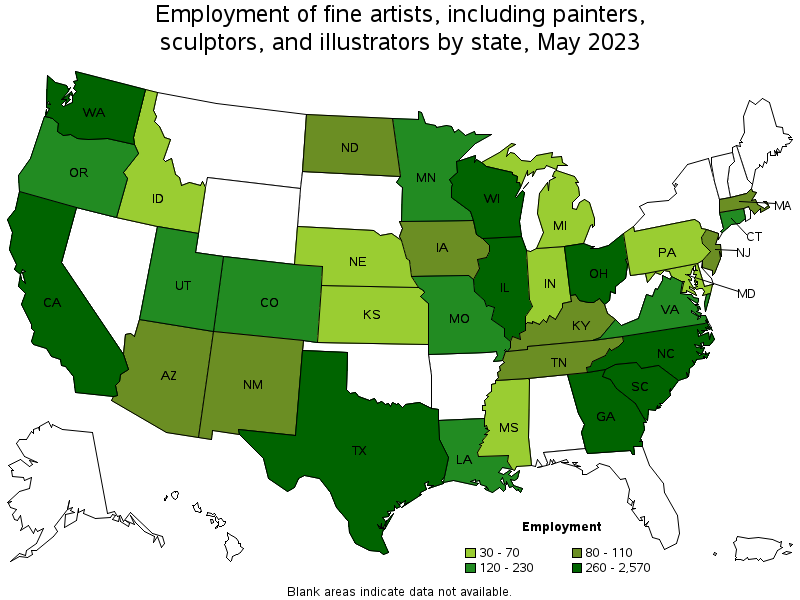
States with the highest employment level in Fine Artists, Including Painters, Sculptors, and Illustrators:
| State | Employment (1) | Employment per thousand jobs | Location quotient (9) | Hourly mean wage | Annual mean wage (2) |
|---|---|---|---|---|---|
| California | 2,570 | 0.14 | 1.99 | $ 54.81 | $ 114,010 |
| Texas | 1,480 | 0.11 | 1.52 | $ 21.40 | $ 44,510 |
| North Carolina | 640 | 0.13 | 1.87 | (8) | (8) |
| Georgia | 540 | 0.11 | 1.58 | $ 33.14 | $ 68,940 |
| Ohio | 310 | 0.06 | 0.80 | $ 21.73 | $ 45,210 |
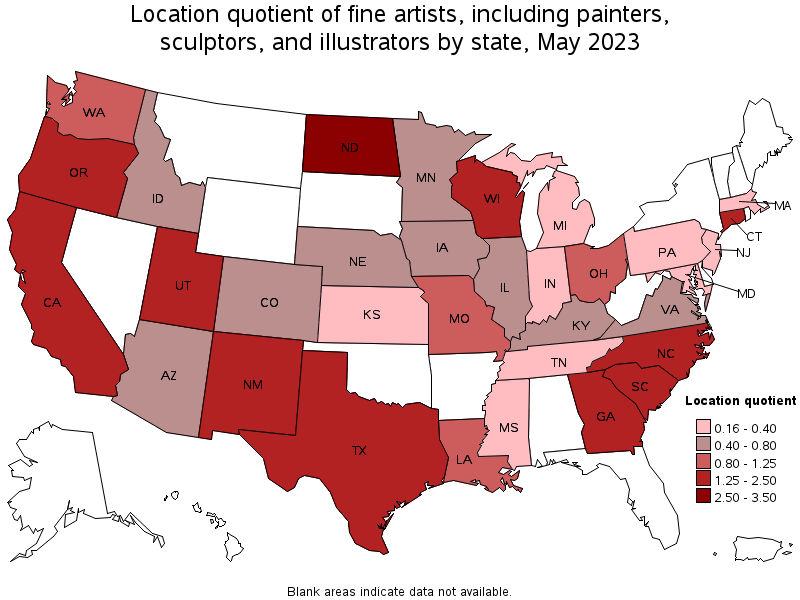
States with the highest concentration of jobs and location quotients in Fine Artists, Including Painters, Sculptors, and Illustrators:
| State | Employment (1) | Employment per thousand jobs | Location quotient (9) | Hourly mean wage | Annual mean wage (2) |
|---|---|---|---|---|---|
| North Dakota | 80 | 0.20 | 2.73 | (8) | (8) |
| California | 2,570 | 0.14 | 1.99 | $ 54.81 | $ 114,010 |
| North Carolina | 640 | 0.13 | 1.87 | (8) | (8) |
| New Mexico | 110 | 0.13 | 1.82 | $ 26.97 | $ 56,100 |
| South Carolina | 280 | 0.13 | 1.76 | $ 28.10 | $ 58,440 |
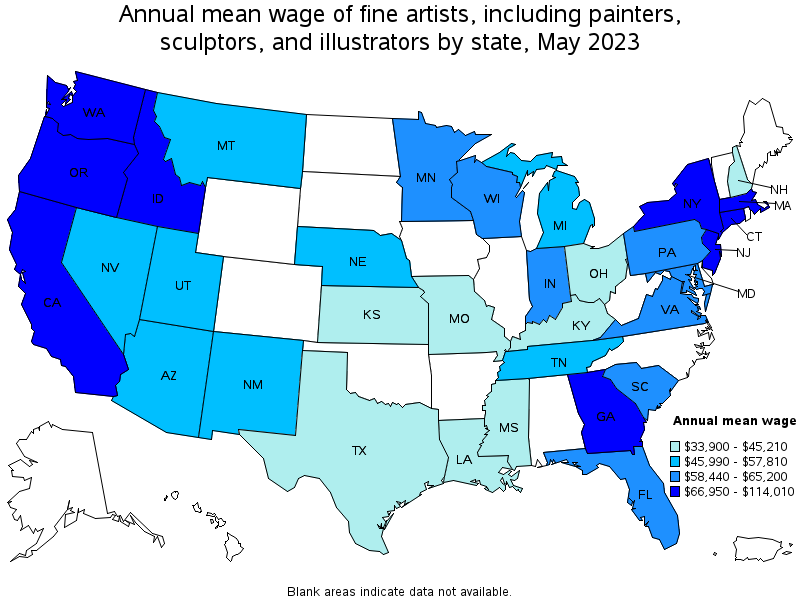
Top paying states for Fine Artists, Including Painters, Sculptors, and Illustrators:
| State | Employment (1) | Employment per thousand jobs | Location quotient (9) | Hourly mean wage | Annual mean wage (2) |
|---|---|---|---|---|---|
| California | 2,570 | 0.14 | 1.99 | $ 54.81 | $ 114,010 |
| New York | (8) | (8) | (8) | $ 47.18 | $ 98,130 |
| Massachusetts | 80 | 0.02 | 0.32 | $ 38.95 | $ 81,010 |
| New Jersey | 80 | 0.02 | 0.25 | $ 37.81 | $ 78,650 |
| Connecticut | 150 | 0.09 | 1.28 | $ 33.55 | $ 69,790 |
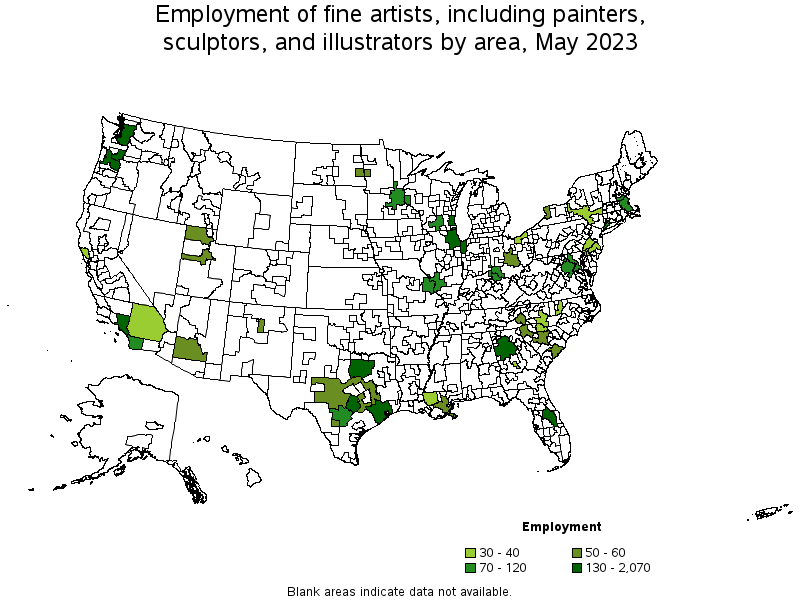
Metropolitan areas with the highest employment level in Fine Artists, Including Painters, Sculptors, and Illustrators:
| Metropolitan area | Employment (1) | Employment per thousand jobs | Location quotient (9) | Hourly mean wage | Annual mean wage (2) |
|---|---|---|---|---|---|
| Los Angeles-Long Beach-Anaheim, CA | 2,070 | 0.33 | 4.66 | $ 57.44 | $ 119,470 |
| Austin-Round Rock, TX | 490 | 0.40 | 5.54 | (8) | (8) |
| Dallas-Fort Worth-Arlington, TX | 380 | 0.10 | 1.33 | $ 20.32 | $ 42,260 |
| Atlanta-Sandy Springs-Roswell, GA | 370 | 0.13 | 1.81 | $ 33.97 | $ 70,660 |
| Orlando-Kissimmee-Sanford, FL | 350 | 0.25 | 3.53 | $ 29.85 | $ 62,090 |
| Chicago-Naperville-Elgin, IL-IN-WI | 230 | 0.05 | 0.72 | (8) | (8) |
| Portland-Vancouver-Hillsboro, OR-WA | 210 | 0.18 | 2.47 | $ 33.39 | $ 69,460 |
| Seattle-Tacoma-Bellevue, WA | 180 | 0.09 | 1.19 | $ 37.46 | $ 77,920 |
| Houston-The Woodlands-Sugar Land, TX | 160 | 0.05 | 0.69 | $ 26.08 | $ 54,240 |
| Milwaukee-Waukesha-West Allis, WI | 130 | 0.16 | 2.19 | $ 30.13 | $ 62,670 |
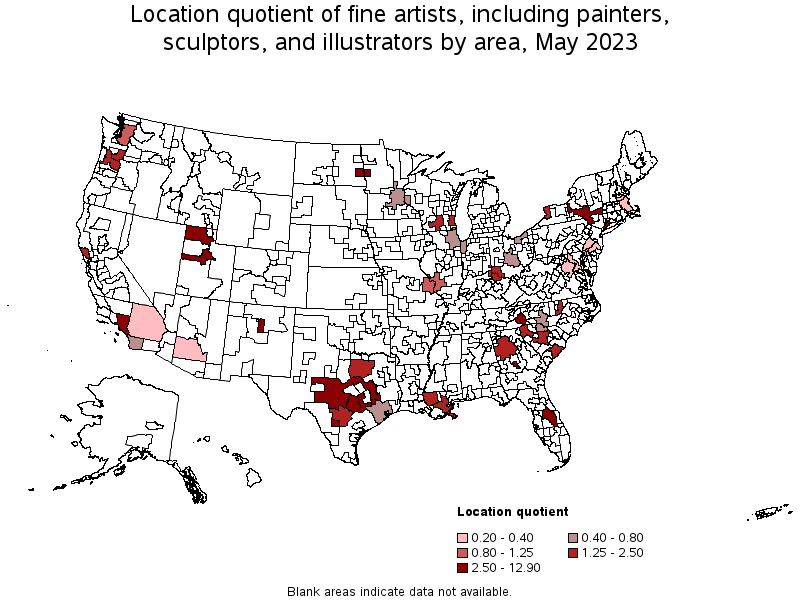
Metropolitan areas with the highest concentration of jobs and location quotients in Fine Artists, Including Painters, Sculptors, and Illustrators:
| Metropolitan area | Employment (1) | Employment per thousand jobs | Location quotient (9) | Hourly mean wage | Annual mean wage (2) |
|---|---|---|---|---|---|
| Santa Fe, NM | 60 | 0.93 | 12.90 | (8) | (8) |
| Warner Robins, GA | 40 | 0.55 | 7.68 | $ 31.89 | $ 66,340 |
| Austin-Round Rock, TX | 490 | 0.40 | 5.54 | (8) | (8) |
| Fargo, ND-MN | 60 | 0.40 | 5.54 | $ 45.50 | $ 94,640 |
| Los Angeles-Long Beach-Anaheim, CA | 2,070 | 0.33 | 4.66 | $ 57.44 | $ 119,470 |
| Orlando-Kissimmee-Sanford, FL | 350 | 0.25 | 3.53 | $ 29.85 | $ 62,090 |
| Bridgeport-Stamford-Norwalk, CT | 100 | 0.24 | 3.39 | (8) | (8) |
| Asheville, NC | 50 | 0.23 | 3.18 | $ 26.18 | $ 54,450 |
| Ogden-Clearfield, UT | 60 | 0.21 | 2.94 | $ 26.58 | $ 55,290 |
| Provo-Orem, UT | 60 | 0.20 | 2.79 | $ 27.30 | $ 56,780 |
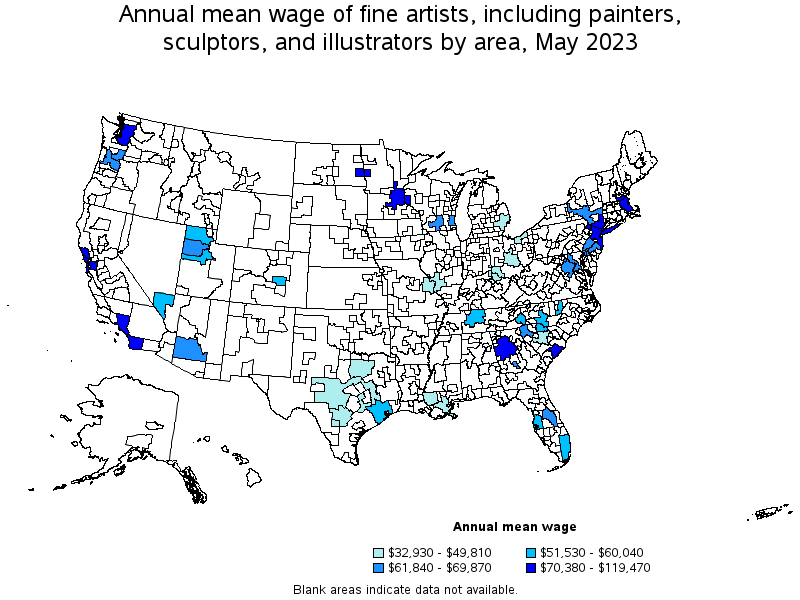
Top paying metropolitan areas for Fine Artists, Including Painters, Sculptors, and Illustrators:
| Metropolitan area | Employment (1) | Employment per thousand jobs | Location quotient (9) | Hourly mean wage | Annual mean wage (2) |
|---|---|---|---|---|---|
| Los Angeles-Long Beach-Anaheim, CA | 2,070 | 0.33 | 4.66 | $ 57.44 | $ 119,470 |
| New York-Newark-Jersey City, NY-NJ-PA | (8) | (8) | (8) | $ 51.08 | $ 106,240 |
| San Francisco-Oakland-Hayward, CA | (8) | (8) | (8) | $ 46.25 | $ 96,190 |
| Fargo, ND-MN | 60 | 0.40 | 5.54 | $ 45.50 | $ 94,640 |
| Charleston-North Charleston, SC | 60 | 0.17 | 2.38 | $ 44.56 | $ 92,670 |
| Santa Rosa, CA | 30 | 0.16 | 2.21 | $ 39.49 | $ 82,140 |
| San Diego-Carlsbad, CA | 80 | 0.05 | 0.73 | $ 37.57 | $ 78,140 |
| Seattle-Tacoma-Bellevue, WA | 180 | 0.09 | 1.19 | $ 37.46 | $ 77,920 |
| Boston-Cambridge-Nashua, MA-NH | 70 | 0.03 | 0.35 | $ 35.34 | $ 73,520 |
| Atlanta-Sandy Springs-Roswell, GA | 370 | 0.13 | 1.81 | $ 33.97 | $ 70,660 |
Nonmetropolitan areas with the highest employment in Fine Artists, Including Painters, Sculptors, and Illustrators:
| Nonmetropolitan area | Employment (1) | Employment per thousand jobs | Location quotient (9) | Hourly mean wage | Annual mean wage (2) |
|---|---|---|---|---|---|
| Hill Country Region of Texas nonmetropolitan area | 50 | 0.22 | 3.11 | $ 19.00 | $ 39,520 |
| Central East New York nonmetropolitan area | 40 | 0.23 | 3.17 | $ 29.79 | $ 61,960 |
Nonmetropolitan areas with the highest concentration of jobs and location quotients in Fine Artists, Including Painters, Sculptors, and Illustrators:
| Nonmetropolitan area | Employment (1) | Employment per thousand jobs | Location quotient (9) | Hourly mean wage | Annual mean wage (2) |
|---|---|---|---|---|---|
| Central East New York nonmetropolitan area | 40 | 0.23 | 3.17 | $ 29.79 | $ 61,960 |
| Hill Country Region of Texas nonmetropolitan area | 50 | 0.22 | 3.11 | $ 19.00 | $ 39,520 |
Top paying nonmetropolitan areas for Fine Artists, Including Painters, Sculptors, and Illustrators:
| Nonmetropolitan area | Employment (1) | Employment per thousand jobs | Location quotient (9) | Hourly mean wage | Annual mean wage (2) |
|---|---|---|---|---|---|
| Central East New York nonmetropolitan area | 40 | 0.23 | 3.17 | $ 29.79 | $ 61,960 |
| Hill Country Region of Texas nonmetropolitan area | 50 | 0.22 | 3.11 | $ 19.00 | $ 39,520 |
These estimates are calculated with data collected from employers in all industry sectors, all metropolitan and nonmetropolitan areas, and all states and the District of Columbia. The top employment and wage figures are provided above. The complete list is available in the downloadable XLS files.
The percentile wage estimate is the value of a wage below which a certain percent of workers fall. The median wage is the 50th percentile wage estimate—50 percent of workers earn less than the median and 50 percent of workers earn more than the median. More about percentile wages.
(1) Estimates for detailed occupations do not sum to the totals because the totals include occupations not shown separately. Estimates do not include self-employed workers.
(2) Annual wages have been calculated by multiplying the hourly mean wage by a "year-round, full-time" hours figure of 2,080 hours; for those occupations where there is not an hourly wage published, the annual wage has been directly calculated from the reported survey data.
(3) The relative standard error (RSE) is a measure of the reliability of a survey statistic. The smaller the relative standard error, the more precise the estimate.
(7) The value is less than .005 percent of industry employment.
(8) Estimate not released.
(9) The location quotient is the ratio of the area concentration of occupational employment to the national average concentration. A location quotient greater than one indicates the occupation has a higher share of employment than average, and a location quotient less than one indicates the occupation is less prevalent in the area than average.
Other OEWS estimates and related information:
May 2023 National Occupational Employment and Wage Estimates
May 2023 State Occupational Employment and Wage Estimates
May 2023 Metropolitan and Nonmetropolitan Area Occupational Employment and Wage Estimates
May 2023 National Industry-Specific Occupational Employment and Wage Estimates
Last Modified Date: April 3, 2024