
An official website of the United States government
An official website of the United States government
The .gov means it's official.
Federal government websites often end in .gov or .mil. Before sharing sensitive information,
make sure you're on a federal government site.
The site is secure.
The
https:// ensures that you are connecting to the official website and that any
information you provide is encrypted and transmitted securely.
All plant and system operators not listed separately.
Employment estimate and mean wage estimates for Plant and System Operators, All Other:
| Employment (1) | Employment RSE (3) |
Mean hourly wage |
Mean annual wage (2) |
Wage RSE (3) |
|---|---|---|---|---|
| 15,370 | 5.3 % | $ 28.80 | $ 59,890 | 1.5 % |
Percentile wage estimates for Plant and System Operators, All Other:
| Percentile | 10% | 25% | 50% (Median) |
75% | 90% |
|---|---|---|---|---|---|
| Hourly Wage | $ 17.36 | $ 21.82 | $ 27.37 | $ 34.37 | $ 41.32 |
| Annual Wage (2) | $ 36,120 | $ 45,390 | $ 56,940 | $ 71,500 | $ 85,950 |
Industries with the highest published employment and wages for Plant and System Operators, All Other are provided. For a list of all industries with employment in Plant and System Operators, All Other, see the Create Customized Tables function.
Industries with the highest levels of employment in Plant and System Operators, All Other:
| Industry | Employment (1) | Percent of industry employment | Hourly mean wage | Annual mean wage (2) |
|---|---|---|---|---|
| Federal, State, and Local Government, excluding State and Local Government Schools and Hospitals and the U.S. Postal Service (OEWS Designation) | 1,870 | 0.09 | $ 34.31 | $ 71,370 |
| Petroleum and Coal Products Manufacturing | 1,600 | 1.47 | $ 28.05 | $ 58,340 |
| Nonmetallic Mineral Product Manufacturing | 1,370 | 0.33 | $ 27.74 | $ 57,700 |
| Highway, Street, and Bridge Construction | 1,130 | 0.31 | $ 27.71 | $ 57,630 |
| Chemical Manufacturing (3251, 3252, 3253, and 3259 only) | 1,080 | 0.30 | $ 30.34 | $ 63,100 |
Industries with the highest concentration of employment in Plant and System Operators, All Other:
| Industry | Employment (1) | Percent of industry employment | Hourly mean wage | Annual mean wage (2) |
|---|---|---|---|---|
| Petroleum and Coal Products Manufacturing | 1,600 | 1.47 | $ 28.05 | $ 58,340 |
| Metal Ore Mining | 460 | 1.07 | $ 34.73 | $ 72,230 |
| Nonmetallic Mineral Mining and Quarrying | 890 | 0.90 | $ 25.03 | $ 52,060 |
| Waste Treatment and Disposal | 580 | 0.58 | $ 31.30 | $ 65,100 |
| Nonmetallic Mineral Product Manufacturing | 1,370 | 0.33 | $ 27.74 | $ 57,700 |
Top paying industries for Plant and System Operators, All Other:
| Industry | Employment (1) | Percent of industry employment | Hourly mean wage | Annual mean wage (2) |
|---|---|---|---|---|
| Electric Power Generation, Transmission and Distribution | 180 | 0.05 | $ 49.90 | $ 103,790 |
| Oil and Gas Extraction | 80 | 0.08 | $ 44.24 | $ 92,030 |
| Architectural, Engineering, and Related Services | 250 | 0.01 | $ 36.84 | $ 76,640 |
| Local Government, excluding Schools and Hospitals (OEWS Designation) | 760 | 0.01 | $ 35.46 | $ 73,760 |
| Colleges, Universities, and Professional Schools | 30 | (7) | $ 34.97 | $ 72,740 |
States and areas with the highest published employment, location quotients, and wages for Plant and System Operators, All Other are provided. For a list of all areas with employment in Plant and System Operators, All Other, see the Create Customized Tables function.
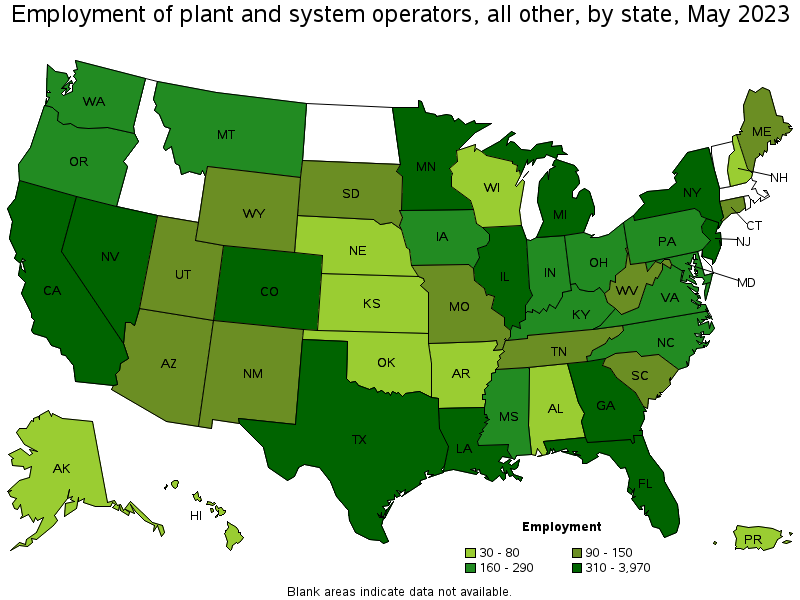
States with the highest employment level in Plant and System Operators, All Other:
| State | Employment (1) | Employment per thousand jobs | Location quotient (9) | Hourly mean wage | Annual mean wage (2) |
|---|---|---|---|---|---|
| Texas | 3,970 | 0.29 | 2.89 | $ 22.77 | $ 47,360 |
| California | 1,280 | 0.07 | 0.71 | $ 35.37 | $ 73,570 |
| Georgia | 1,030 | 0.22 | 2.14 | $ 26.60 | $ 55,330 |
| Colorado | 820 | 0.29 | 2.86 | $ 32.89 | $ 68,410 |
| Louisiana | 660 | 0.35 | 3.50 | $ 32.35 | $ 67,280 |
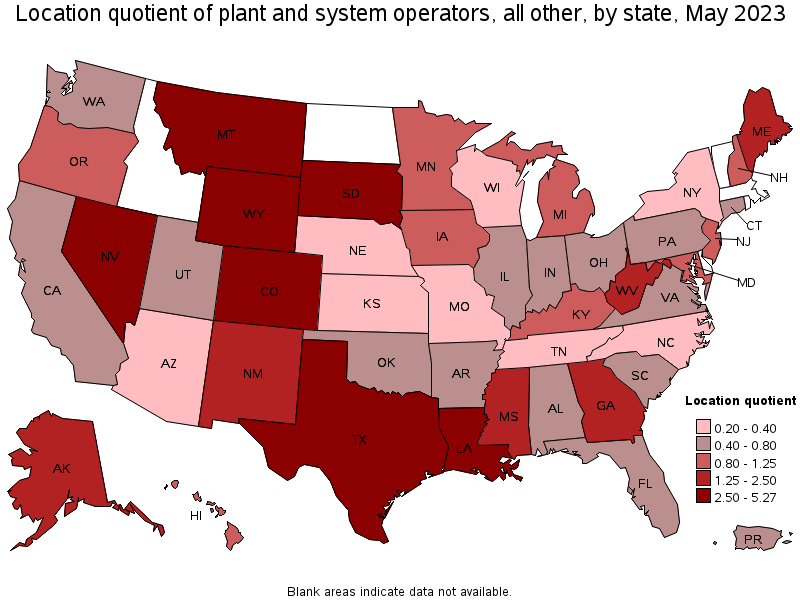
States with the highest concentration of jobs and location quotients in Plant and System Operators, All Other:
| State | Employment (1) | Employment per thousand jobs | Location quotient (9) | Hourly mean wage | Annual mean wage (2) |
|---|---|---|---|---|---|
| Wyoming | 150 | 0.53 | 5.27 | $ 26.00 | $ 54,090 |
| Montana | 210 | 0.41 | 4.10 | $ 33.45 | $ 69,580 |
| Louisiana | 660 | 0.35 | 3.50 | $ 32.35 | $ 67,280 |
| South Dakota | 150 | 0.34 | 3.38 | $ 28.76 | $ 59,830 |
| Texas | 3,970 | 0.29 | 2.89 | $ 22.77 | $ 47,360 |
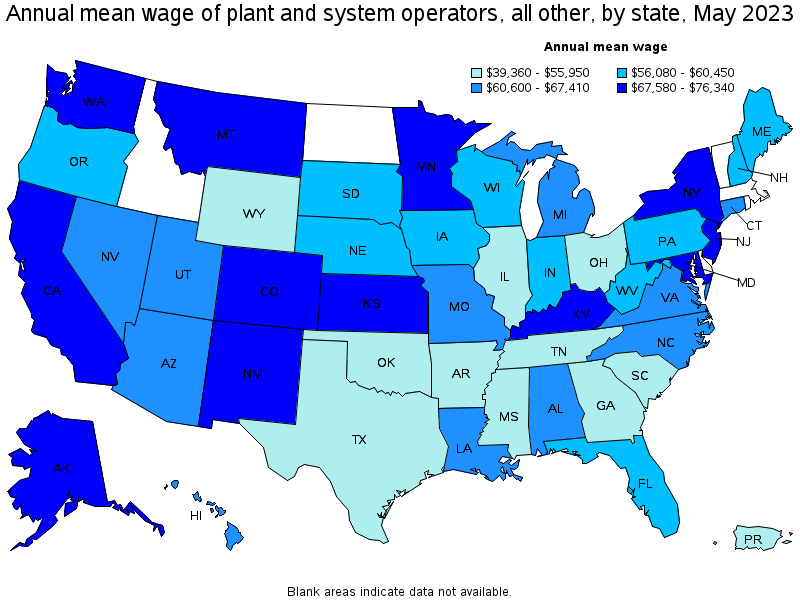
Top paying states for Plant and System Operators, All Other:
| State | Employment (1) | Employment per thousand jobs | Location quotient (9) | Hourly mean wage | Annual mean wage (2) |
|---|---|---|---|---|---|
| Washington | 220 | 0.06 | 0.63 | $ 36.70 | $ 76,340 |
| California | 1,280 | 0.07 | 0.71 | $ 35.37 | $ 73,570 |
| New Mexico | 140 | 0.16 | 1.60 | $ 34.79 | $ 72,370 |
| Maryland | 250 | 0.09 | 0.93 | $ 34.49 | $ 71,740 |
| Montana | 210 | 0.41 | 4.10 | $ 33.45 | $ 69,580 |
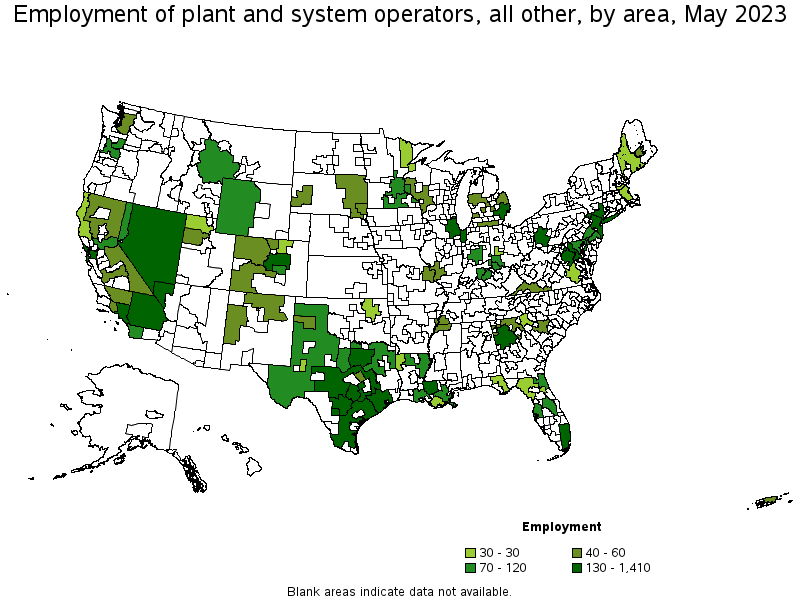
Metropolitan areas with the highest employment level in Plant and System Operators, All Other:
| Metropolitan area | Employment (1) | Employment per thousand jobs | Location quotient (9) | Hourly mean wage | Annual mean wage (2) |
|---|---|---|---|---|---|
| Dallas-Fort Worth-Arlington, TX | 1,410 | 0.35 | 3.50 | $ 21.94 | $ 45,630 |
| Houston-The Woodlands-Sugar Land, TX | 660 | 0.21 | 2.04 | $ 24.73 | $ 51,440 |
| Austin-Round Rock, TX | 500 | 0.40 | 3.97 | $ 21.49 | $ 44,700 |
| New York-Newark-Jersey City, NY-NJ-PA | 360 | 0.04 | 0.37 | $ 34.94 | $ 72,660 |
| Washington-Arlington-Alexandria, DC-VA-MD-WV | 350 | 0.11 | 1.11 | $ 36.23 | $ 75,360 |
| Denver-Aurora-Lakewood, CO | 310 | 0.20 | 1.93 | $ 30.61 | $ 63,670 |
| Los Angeles-Long Beach-Anaheim, CA | 300 | 0.05 | 0.48 | $ 34.50 | $ 71,750 |
| Chicago-Naperville-Elgin, IL-IN-WI | 250 | 0.06 | 0.55 | $ 26.83 | $ 55,810 |
| Detroit-Warren-Dearborn, MI | 220 | 0.12 | 1.16 | $ 29.82 | $ 62,030 |
| Riverside-San Bernardino-Ontario, CA | 190 | 0.12 | 1.15 | $ 32.45 | $ 67,500 |
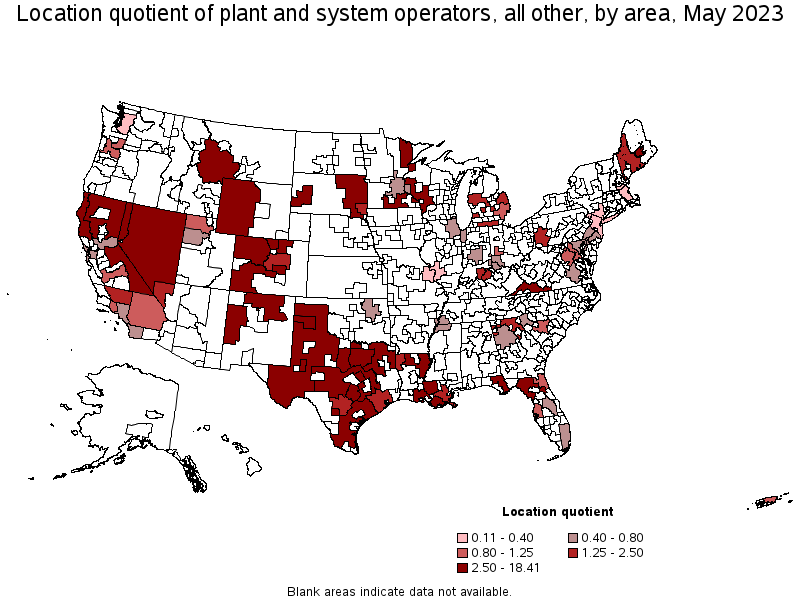
Metropolitan areas with the highest concentration of jobs and location quotients in Plant and System Operators, All Other:
| Metropolitan area | Employment (1) | Employment per thousand jobs | Location quotient (9) | Hourly mean wage | Annual mean wage (2) |
|---|---|---|---|---|---|
| Bangor, ME | 60 | 0.93 | 9.21 | $ 29.64 | $ 61,640 |
| Rapid City, SD | 40 | 0.49 | 4.84 | $ 31.41 | $ 65,330 |
| Lafayette, LA | 90 | 0.46 | 4.50 | $ 23.78 | $ 49,460 |
| Waco, TX | 60 | 0.45 | 4.44 | $ 26.57 | $ 55,270 |
| Houma-Thibodaux, LA | 30 | 0.42 | 4.19 | $ 29.81 | $ 62,000 |
| Austin-Round Rock, TX | 500 | 0.40 | 3.97 | $ 21.49 | $ 44,700 |
| Dallas-Fort Worth-Arlington, TX | 1,410 | 0.35 | 3.50 | $ 21.94 | $ 45,630 |
| Baton Rouge, LA | 140 | 0.35 | 3.48 | $ 39.63 | $ 82,430 |
| Reno, NV | 90 | 0.34 | 3.34 | $ 34.18 | $ 71,080 |
| Colorado Springs, CO | 100 | 0.32 | 3.16 | $ 32.12 | $ 66,810 |
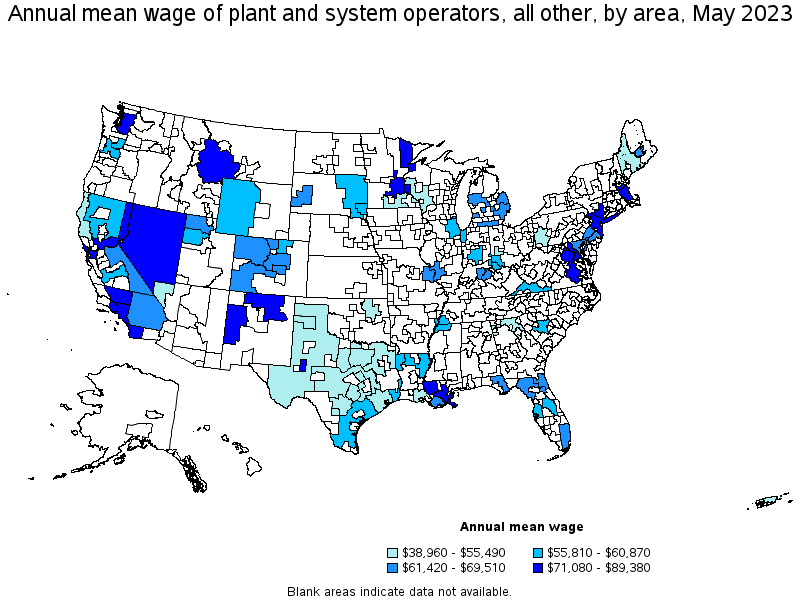
Top paying metropolitan areas for Plant and System Operators, All Other:
| Metropolitan area | Employment (1) | Employment per thousand jobs | Location quotient (9) | Hourly mean wage | Annual mean wage (2) |
|---|---|---|---|---|---|
| Sacramento--Roseville--Arden-Arcade, CA | 70 | 0.06 | 0.62 | $ 42.97 | $ 89,380 |
| Boston-Cambridge-Nashua, MA-NH | 30 | 0.01 | 0.11 | $ 41.73 | $ 86,800 |
| San Francisco-Oakland-Hayward, CA | 130 | 0.05 | 0.53 | $ 40.49 | $ 84,210 |
| San Diego-Carlsbad, CA | 80 | 0.05 | 0.52 | $ 40.15 | $ 83,520 |
| Baton Rouge, LA | 140 | 0.35 | 3.48 | $ 39.63 | $ 82,430 |
| Seattle-Tacoma-Bellevue, WA | 50 | 0.02 | 0.23 | $ 39.05 | $ 81,220 |
| Duluth, MN-WI | 30 | 0.28 | 2.78 | $ 39.04 | $ 81,210 |
| Oxnard-Thousand Oaks-Ventura, CA | 40 | 0.11 | 1.11 | $ 38.63 | $ 80,340 |
| New Orleans-Metairie, LA | 120 | 0.24 | 2.33 | $ 38.44 | $ 79,960 |
| Midland, TX | 30 | 0.29 | 2.90 | $ 36.78 | $ 76,510 |
Nonmetropolitan areas with the highest employment in Plant and System Operators, All Other:
| Nonmetropolitan area | Employment (1) | Employment per thousand jobs | Location quotient (9) | Hourly mean wage | Annual mean wage (2) |
|---|---|---|---|---|---|
| Hill Country Region of Texas nonmetropolitan area | 200 | 0.98 | 9.66 | $ 20.15 | $ 41,920 |
| Nevada nonmetropolitan area | 160 | 1.61 | 15.88 | $ 35.56 | $ 73,960 |
| Coastal Plains Region of Texas nonmetropolitan area | 130 | 0.89 | 8.76 | $ 27.64 | $ 57,480 |
| West Texas Region of Texas nonmetropolitan area | 120 | 0.62 | 6.09 | $ 26.15 | $ 54,390 |
| Northeast Louisiana nonmetropolitan area | 120 | 1.86 | 18.41 | $ 28.61 | $ 59,510 |
Nonmetropolitan areas with the highest concentration of jobs and location quotients in Plant and System Operators, All Other:
| Nonmetropolitan area | Employment (1) | Employment per thousand jobs | Location quotient (9) | Hourly mean wage | Annual mean wage (2) |
|---|---|---|---|---|---|
| Northeast Louisiana nonmetropolitan area | 120 | 1.86 | 18.41 | $ 28.61 | $ 59,510 |
| Nevada nonmetropolitan area | 160 | 1.61 | 15.88 | $ 35.56 | $ 73,960 |
| Hill Country Region of Texas nonmetropolitan area | 200 | 0.98 | 9.66 | $ 20.15 | $ 41,920 |
| Eastern Sierra-Mother Lode Region of California nonmetropolitan area | 60 | 0.96 | 9.53 | $ 33.10 | $ 68,850 |
| Coastal Plains Region of Texas nonmetropolitan area | 130 | 0.89 | 8.76 | $ 27.64 | $ 57,480 |
Top paying nonmetropolitan areas for Plant and System Operators, All Other:
| Nonmetropolitan area | Employment (1) | Employment per thousand jobs | Location quotient (9) | Hourly mean wage | Annual mean wage (2) |
|---|---|---|---|---|---|
| Northern New Mexico nonmetropolitan area | 40 | 0.47 | 4.66 | $ 37.11 | $ 77,190 |
| Nevada nonmetropolitan area | 160 | 1.61 | 15.88 | $ 35.56 | $ 73,960 |
| Southwest Montana nonmetropolitan area | 70 | 0.44 | 4.38 | $ 34.48 | $ 71,710 |
| Eastern Sierra-Mother Lode Region of California nonmetropolitan area | 60 | 0.96 | 9.53 | $ 33.10 | $ 68,850 |
| Balance of Lower Peninsula of Michigan nonmetropolitan area | 50 | 0.18 | 1.76 | $ 32.02 | $ 66,590 |
These estimates are calculated with data collected from employers in all industry sectors, all metropolitan and nonmetropolitan areas, and all states and the District of Columbia. The top employment and wage figures are provided above. The complete list is available in the downloadable XLS files.
The percentile wage estimate is the value of a wage below which a certain percent of workers fall. The median wage is the 50th percentile wage estimate—50 percent of workers earn less than the median and 50 percent of workers earn more than the median. More about percentile wages.
(1) Estimates for detailed occupations do not sum to the totals because the totals include occupations not shown separately. Estimates do not include self-employed workers.
(2) Annual wages have been calculated by multiplying the hourly mean wage by a "year-round, full-time" hours figure of 2,080 hours; for those occupations where there is not an hourly wage published, the annual wage has been directly calculated from the reported survey data.
(3) The relative standard error (RSE) is a measure of the reliability of a survey statistic. The smaller the relative standard error, the more precise the estimate.
(7) The value is less than .005 percent of industry employment.
(9) The location quotient is the ratio of the area concentration of occupational employment to the national average concentration. A location quotient greater than one indicates the occupation has a higher share of employment than average, and a location quotient less than one indicates the occupation is less prevalent in the area than average.
Other OEWS estimates and related information:
May 2023 National Occupational Employment and Wage Estimates
May 2023 State Occupational Employment and Wage Estimates
May 2023 Metropolitan and Nonmetropolitan Area Occupational Employment and Wage Estimates
May 2023 National Industry-Specific Occupational Employment and Wage Estimates
Last Modified Date: April 3, 2024