
An official website of the United States government
An official website of the United States government
The .gov means it's official.
Federal government websites often end in .gov or .mil. Before sharing sensitive information,
make sure you're on a federal government site.
The site is secure.
The
https:// ensures that you are connecting to the official website and that any
information you provide is encrypted and transmitted securely.
Set up, operate, or tend spraying or rolling machines to coat or paint any of a wide variety of products, including glassware, cloth, ceramics, metal, plastic, paper, or wood, with lacquer, silver, copper, rubber, varnish, glaze, enamel, oil, or rust-proofing materials. Includes painters of transportation vehicles such as painters in auto body repair facilities. Excludes �Plating Machine Setters, Operators, and Tenders, Metal and Plastic� (51-4193).
Employment estimate and mean wage estimates for Coating, Painting, and Spraying Machine Setters, Operators, and Tenders:
| Employment (1) | Employment RSE (3) |
Mean hourly wage |
Mean annual wage (2) |
Wage RSE (3) |
|---|---|---|---|---|
| 155,880 | 1.5 % | $ 23.31 | $ 48,480 | 0.3 % |
Percentile wage estimates for Coating, Painting, and Spraying Machine Setters, Operators, and Tenders:
| Percentile | 10% | 25% | 50% (Median) |
75% | 90% |
|---|---|---|---|---|---|
| Hourly Wage | $ 16.01 | $ 18.17 | $ 21.90 | $ 26.17 | $ 31.92 |
| Annual Wage (2) | $ 33,300 | $ 37,790 | $ 45,560 | $ 54,440 | $ 66,390 |
Industries with the highest published employment and wages for Coating, Painting, and Spraying Machine Setters, Operators, and Tenders are provided. For a list of all industries with employment in Coating, Painting, and Spraying Machine Setters, Operators, and Tenders, see the Create Customized Tables function.
Industries with the highest levels of employment in Coating, Painting, and Spraying Machine Setters, Operators, and Tenders:
| Industry | Employment (1) | Percent of industry employment | Hourly mean wage | Annual mean wage (2) |
|---|---|---|---|---|
| Automotive Repair and Maintenance | 26,680 | 2.67 | $ 28.07 | $ 58,390 |
| Coating, Engraving, Heat Treating, and Allied Activities | 15,510 | 11.84 | $ 19.92 | $ 41,440 |
| Machinery Manufacturing (3331, 3332, 3334, and 3339 only) | 11,270 | 1.45 | $ 21.89 | $ 45,540 |
| Fabricated Metal Product Manufacturing (3323 and 3324 only) | 10,920 | 2.19 | $ 21.07 | $ 43,830 |
| Motor Vehicle Body and Trailer Manufacturing | 6,140 | 3.64 | $ 22.04 | $ 45,830 |
Industries with the highest concentration of employment in Coating, Painting, and Spraying Machine Setters, Operators, and Tenders:
| Industry | Employment (1) | Percent of industry employment | Hourly mean wage | Annual mean wage (2) |
|---|---|---|---|---|
| Coating, Engraving, Heat Treating, and Allied Activities | 15,510 | 11.84 | $ 19.92 | $ 41,440 |
| Textile and Fabric Finishing and Fabric Coating Mills | 1,460 | 6.16 | $ 21.62 | $ 44,970 |
| Motor Vehicle Body and Trailer Manufacturing | 6,140 | 3.64 | $ 22.04 | $ 45,830 |
| Leather and Hide Tanning and Finishing | 110 | 3.33 | $ 15.72 | $ 32,690 |
| Other Transportation Equipment Manufacturing | 1,140 | 2.80 | $ 23.76 | $ 49,420 |
Top paying industries for Coating, Painting, and Spraying Machine Setters, Operators, and Tenders:
| Industry | Employment (1) | Percent of industry employment | Hourly mean wage | Annual mean wage (2) |
|---|---|---|---|---|
| Rail Transportation | 40 | 0.02 | $ 37.31 | $ 77,600 |
| Local Government, excluding Schools and Hospitals (OEWS Designation) | 160 | (7) | $ 35.96 | $ 74,800 |
| Spectator Sports | 30 | 0.02 | $ 31.80 | $ 66,150 |
| Aerospace Product and Parts Manufacturing | 4,910 | 0.96 | $ 31.73 | $ 66,010 |
| Nonmetallic Mineral Mining and Quarrying | 80 | 0.08 | $ 31.42 | $ 65,360 |
States and areas with the highest published employment, location quotients, and wages for Coating, Painting, and Spraying Machine Setters, Operators, and Tenders are provided. For a list of all areas with employment in Coating, Painting, and Spraying Machine Setters, Operators, and Tenders, see the Create Customized Tables function.
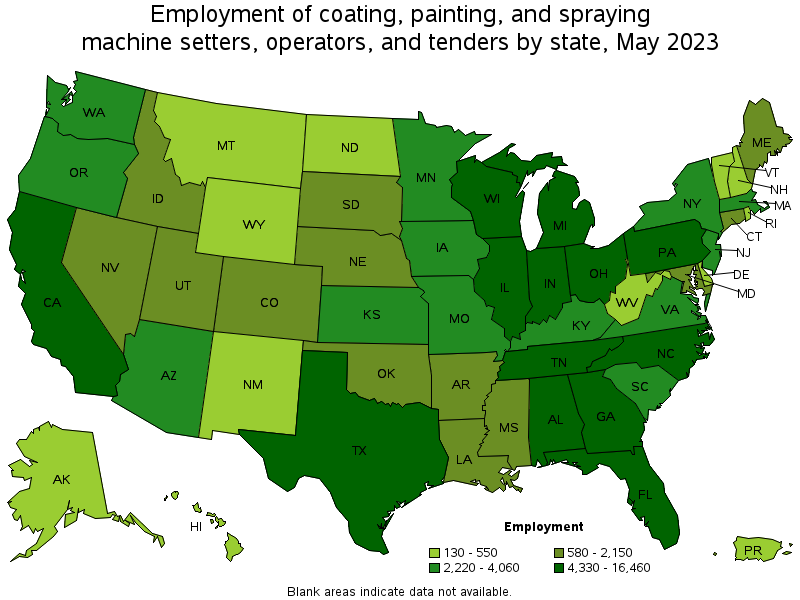
States with the highest employment level in Coating, Painting, and Spraying Machine Setters, Operators, and Tenders:
| State | Employment (1) | Employment per thousand jobs | Location quotient (9) | Hourly mean wage | Annual mean wage (2) |
|---|---|---|---|---|---|
| Texas | 16,460 | 1.21 | 1.18 | $ 22.82 | $ 47,470 |
| California | 11,010 | 0.61 | 0.60 | $ 26.79 | $ 55,720 |
| Ohio | 8,520 | 1.56 | 1.52 | $ 22.23 | $ 46,240 |
| Wisconsin | 8,000 | 2.77 | 2.70 | $ 22.58 | $ 46,970 |
| Indiana | 7,280 | 2.31 | 2.25 | $ 21.20 | $ 44,100 |
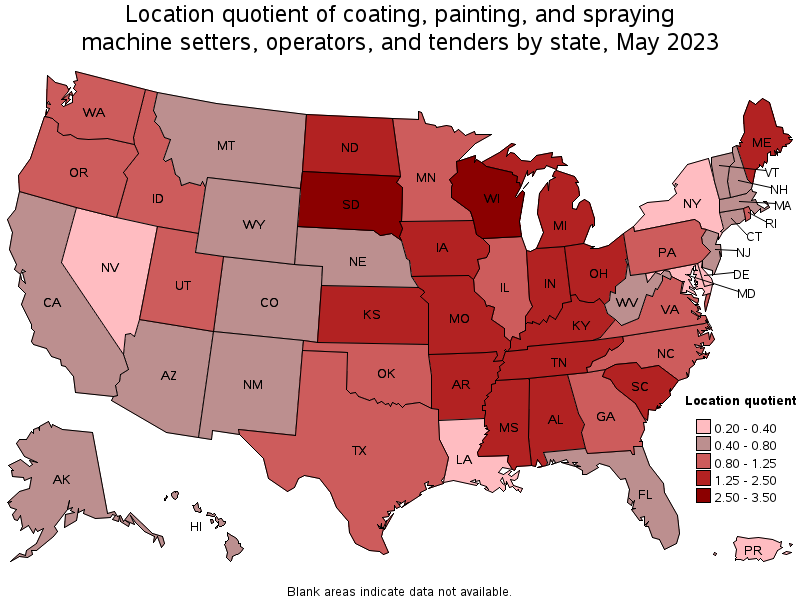
States with the highest concentration of jobs and location quotients in Coating, Painting, and Spraying Machine Setters, Operators, and Tenders:
| State | Employment (1) | Employment per thousand jobs | Location quotient (9) | Hourly mean wage | Annual mean wage (2) |
|---|---|---|---|---|---|
| Wisconsin | 8,000 | 2.77 | 2.70 | $ 22.58 | $ 46,970 |
| South Dakota | 1,230 | 2.77 | 2.70 | $ 22.43 | $ 46,650 |
| Indiana | 7,280 | 2.31 | 2.25 | $ 21.20 | $ 44,100 |
| Alabama | 4,330 | 2.11 | 2.06 | $ 20.32 | $ 42,260 |
| Iowa | 2,900 | 1.88 | 1.83 | $ 22.68 | $ 47,160 |
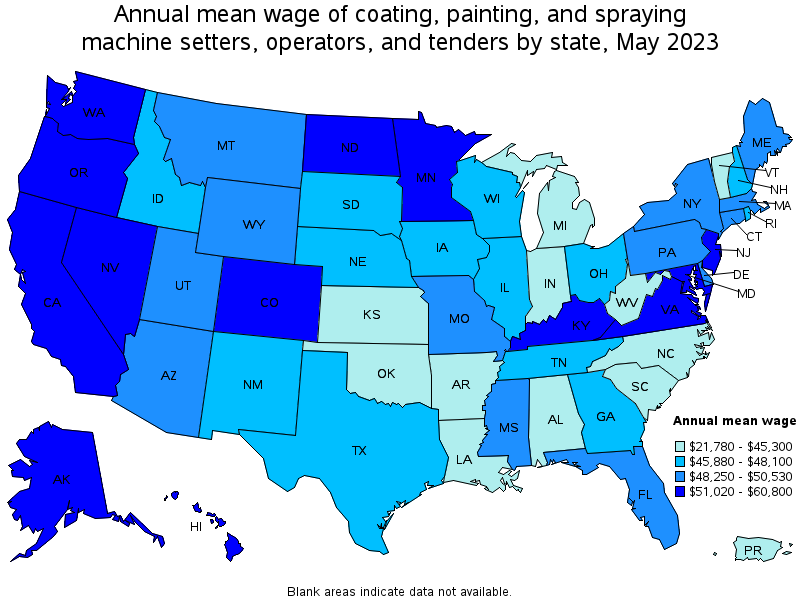
Top paying states for Coating, Painting, and Spraying Machine Setters, Operators, and Tenders:
| State | Employment (1) | Employment per thousand jobs | Location quotient (9) | Hourly mean wage | Annual mean wage (2) |
|---|---|---|---|---|---|
| Washington | 4,060 | 1.16 | 1.13 | $ 29.23 | $ 60,800 |
| Nevada | 590 | 0.40 | 0.39 | $ 28.63 | $ 59,550 |
| Alaska | 130 | 0.42 | 0.41 | $ 28.17 | $ 58,590 |
| Maryland | 730 | 0.27 | 0.26 | $ 27.01 | $ 56,180 |
| California | 11,010 | 0.61 | 0.60 | $ 26.79 | $ 55,720 |
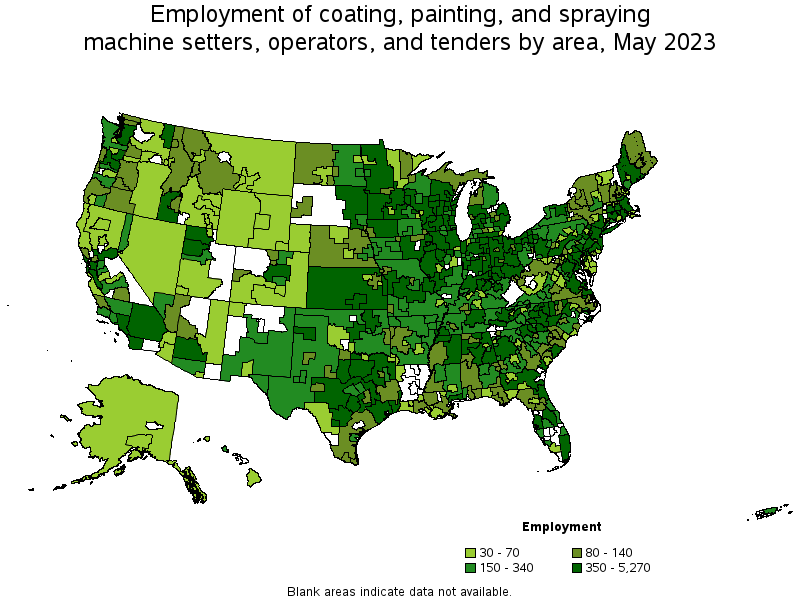
Metropolitan areas with the highest employment level in Coating, Painting, and Spraying Machine Setters, Operators, and Tenders:
| Metropolitan area | Employment (1) | Employment per thousand jobs | Location quotient (9) | Hourly mean wage | Annual mean wage (2) |
|---|---|---|---|---|---|
| Dallas-Fort Worth-Arlington, TX | 5,270 | 1.33 | 1.30 | $ 25.34 | $ 52,710 |
| Los Angeles-Long Beach-Anaheim, CA | 3,980 | 0.64 | 0.63 | $ 25.53 | $ 53,090 |
| Chicago-Naperville-Elgin, IL-IN-WI | 3,960 | 0.88 | 0.86 | $ 24.06 | $ 50,050 |
| Houston-The Woodlands-Sugar Land, TX | 3,920 | 1.23 | 1.20 | $ 21.16 | $ 44,010 |
| New York-Newark-Jersey City, NY-NJ-PA | 3,040 | 0.32 | 0.31 | $ 25.94 | $ 53,960 |
| Detroit-Warren-Dearborn, MI | 2,660 | 1.40 | 1.36 | $ 21.70 | $ 45,130 |
| Seattle-Tacoma-Bellevue, WA | 2,550 | 1.23 | 1.20 | $ 31.79 | $ 66,110 |
| Atlanta-Sandy Springs-Roswell, GA | 2,160 | 0.77 | 0.75 | $ 23.86 | $ 49,630 |
| Milwaukee-Waukesha-West Allis, WI | 1,780 | 2.18 | 2.13 | $ 22.40 | $ 46,600 |
| Charlotte-Concord-Gastonia, NC-SC | 1,780 | 1.36 | 1.32 | $ 22.44 | $ 46,670 |
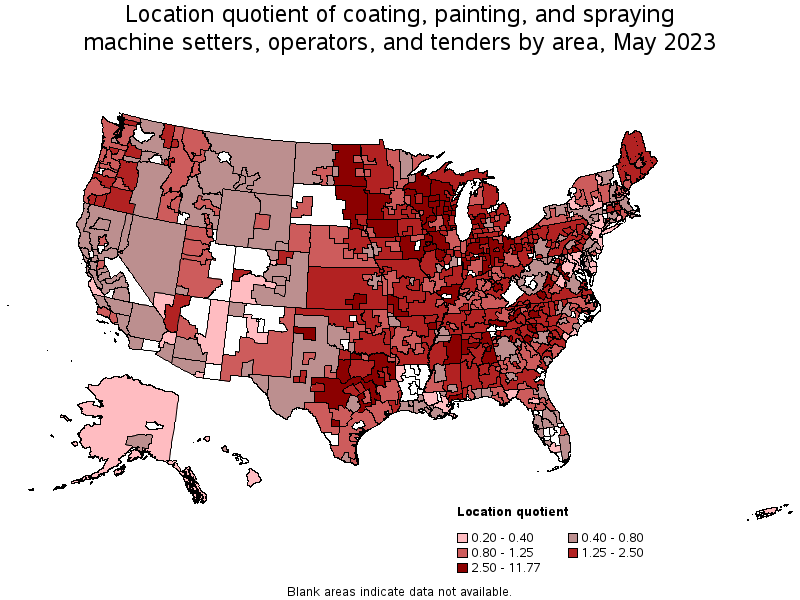
Metropolitan areas with the highest concentration of jobs and location quotients in Coating, Painting, and Spraying Machine Setters, Operators, and Tenders:
| Metropolitan area | Employment (1) | Employment per thousand jobs | Location quotient (9) | Hourly mean wage | Annual mean wage (2) |
|---|---|---|---|---|---|
| Elkhart-Goshen, IN | 1,650 | 12.08 | 11.77 | $ 22.81 | $ 47,440 |
| Sheboygan, WI | 400 | 6.69 | 6.52 | $ 21.94 | $ 45,630 |
| Columbus, IN | 330 | 6.55 | 6.38 | $ 19.20 | $ 39,940 |
| Wausau, WI | 450 | 6.39 | 6.23 | $ 22.21 | $ 46,200 |
| Oshkosh-Neenah, WI | 570 | 6.11 | 5.95 | $ 24.03 | $ 49,980 |
| Anniston-Oxford-Jacksonville, AL | 220 | 5.01 | 4.88 | $ 20.29 | $ 42,210 |
| Gulfport-Biloxi-Pascagoula, MS | 630 | 4.18 | 4.07 | $ 27.70 | $ 57,620 |
| Lexington-Fayette, KY | 1,160 | 4.16 | 4.06 | (8) | (8) |
| York-Hanover, PA | 750 | 4.13 | 4.02 | $ 23.73 | $ 49,360 |
| Fond du Lac, WI | 190 | 4.13 | 4.02 | $ 23.98 | $ 49,870 |
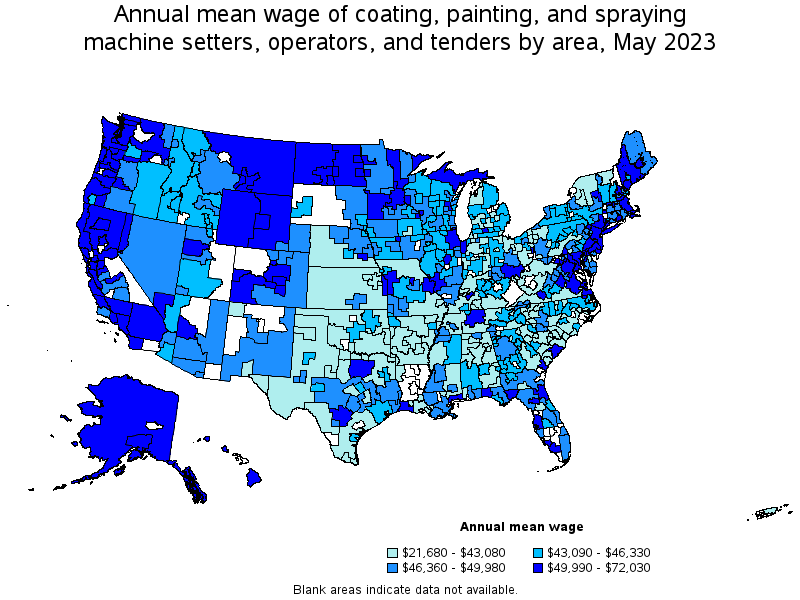
Top paying metropolitan areas for Coating, Painting, and Spraying Machine Setters, Operators, and Tenders:
| Metropolitan area | Employment (1) | Employment per thousand jobs | Location quotient (9) | Hourly mean wage | Annual mean wage (2) |
|---|---|---|---|---|---|
| San Francisco-Oakland-Hayward, CA | 1,220 | 0.51 | 0.49 | $ 33.23 | $ 69,110 |
| Seattle-Tacoma-Bellevue, WA | 2,550 | 1.23 | 1.20 | $ 31.79 | $ 66,110 |
| Sacramento--Roseville--Arden-Arcade, CA | 600 | 0.57 | 0.55 | $ 30.17 | $ 62,760 |
| Las Vegas-Henderson-Paradise, NV | 340 | 0.31 | 0.30 | $ 30.15 | $ 62,720 |
| Washington-Arlington-Alexandria, DC-VA-MD-WV | 730 | 0.24 | 0.23 | $ 30.00 | $ 62,400 |
| San Jose-Sunnyvale-Santa Clara, CA | 530 | 0.47 | 0.45 | $ 29.85 | $ 62,100 |
| Santa Cruz-Watsonville, CA | 50 | 0.48 | 0.47 | $ 29.52 | $ 61,410 |
| Bismarck, ND | 60 | 0.85 | 0.82 | $ 29.46 | $ 61,280 |
| Redding, CA | 30 | 0.49 | 0.48 | $ 28.63 | $ 59,540 |
| Reno, NV | 150 | 0.59 | 0.57 | $ 28.43 | $ 59,130 |
Nonmetropolitan areas with the highest employment in Coating, Painting, and Spraying Machine Setters, Operators, and Tenders:
| Nonmetropolitan area | Employment (1) | Employment per thousand jobs | Location quotient (9) | Hourly mean wage | Annual mean wage (2) |
|---|---|---|---|---|---|
| Northern Indiana nonmetropolitan area | 1,230 | 5.79 | 5.64 | $ 19.48 | $ 40,520 |
| North Northeastern Ohio nonmetropolitan area (noncontiguous) | 1,040 | 3.19 | 3.10 | $ 20.63 | $ 42,900 |
| Kansas nonmetropolitan area | 950 | 2.44 | 2.37 | $ 20.15 | $ 41,900 |
| West Northwestern Ohio nonmetropolitan area | 950 | 3.80 | 3.71 | $ 21.16 | $ 44,000 |
| Southeast Iowa nonmetropolitan area | 930 | 4.41 | 4.30 | $ 24.02 | $ 49,960 |
Nonmetropolitan areas with the highest concentration of jobs and location quotients in Coating, Painting, and Spraying Machine Setters, Operators, and Tenders:
| Nonmetropolitan area | Employment (1) | Employment per thousand jobs | Location quotient (9) | Hourly mean wage | Annual mean wage (2) |
|---|---|---|---|---|---|
| Northwest Alabama nonmetropolitan area | 480 | 7.05 | 6.87 | $ 19.71 | $ 40,990 |
| Northern Indiana nonmetropolitan area | 1,230 | 5.79 | 5.64 | $ 19.48 | $ 40,520 |
| East South Dakota nonmetropolitan area | 760 | 5.77 | 5.63 | $ 22.79 | $ 47,400 |
| Western Wisconsin nonmetropolitan area | 750 | 5.51 | 5.37 | $ 22.57 | $ 46,950 |
| Northeast Alabama nonmetropolitan area | 730 | 4.91 | 4.78 | $ 19.62 | $ 40,820 |
Top paying nonmetropolitan areas for Coating, Painting, and Spraying Machine Setters, Operators, and Tenders:
| Nonmetropolitan area | Employment (1) | Employment per thousand jobs | Location quotient (9) | Hourly mean wage | Annual mean wage (2) |
|---|---|---|---|---|---|
| Alaska nonmetropolitan area | 40 | 0.37 | 0.36 | $ 34.63 | $ 72,030 |
| Southern Ohio nonmetropolitan area | 370 | 2.33 | 2.27 | $ 30.21 | $ 62,850 |
| Northeast Minnesota nonmetropolitan area | 40 | 0.97 | 0.94 | $ 28.52 | $ 59,330 |
| West North Dakota nonmetropolitan area | 80 | 0.71 | 0.69 | $ 27.67 | $ 57,550 |
| Massachusetts nonmetropolitan area | 30 | 0.48 | 0.47 | $ 26.66 | $ 55,460 |
These estimates are calculated with data collected from employers in all industry sectors, all metropolitan and nonmetropolitan areas, and all states and the District of Columbia. The top employment and wage figures are provided above. The complete list is available in the downloadable XLS files.
The percentile wage estimate is the value of a wage below which a certain percent of workers fall. The median wage is the 50th percentile wage estimate—50 percent of workers earn less than the median and 50 percent of workers earn more than the median. More about percentile wages.
(1) Estimates for detailed occupations do not sum to the totals because the totals include occupations not shown separately. Estimates do not include self-employed workers.
(2) Annual wages have been calculated by multiplying the hourly mean wage by a "year-round, full-time" hours figure of 2,080 hours; for those occupations where there is not an hourly wage published, the annual wage has been directly calculated from the reported survey data.
(3) The relative standard error (RSE) is a measure of the reliability of a survey statistic. The smaller the relative standard error, the more precise the estimate.
(7) The value is less than .005 percent of industry employment.
(8) Estimate not released.
(9) The location quotient is the ratio of the area concentration of occupational employment to the national average concentration. A location quotient greater than one indicates the occupation has a higher share of employment than average, and a location quotient less than one indicates the occupation is less prevalent in the area than average.
Other OEWS estimates and related information:
May 2023 National Occupational Employment and Wage Estimates
May 2023 State Occupational Employment and Wage Estimates
May 2023 Metropolitan and Nonmetropolitan Area Occupational Employment and Wage Estimates
May 2023 National Industry-Specific Occupational Employment and Wage Estimates
Last Modified Date: April 3, 2024