
An official website of the United States government
An official website of the United States government
The .gov means it's official.
Federal government websites often end in .gov or .mil. Before sharing sensitive information,
make sure you're on a federal government site.
The site is secure.
The
https:// ensures that you are connecting to the official website and that any
information you provide is encrypted and transmitted securely.
Pilot and navigate the flight of fixed-wing aircraft, usually on scheduled air carrier routes, for the transport of passengers and cargo. Requires Federal Air Transport certificate and rating for specific aircraft type used. Includes regional, national, and international airline pilots and flight instructors of airline pilots. Excludes �Electro-Mechanical and Mechatronics Technologists and Technicians� (17-3024).
Employment estimate and mean wage estimates for Airline Pilots, Copilots, and Flight Engineers:
| Employment (1) | Employment RSE (3) |
Mean hourly wage |
Mean annual wage (2) |
Mean wage RSE (3) |
|---|---|---|---|---|
| 93,670 | 1.3 % | (4) | $ 250,050 | 1.6 % |
Percentile wage estimates for Airline Pilots, Copilots, and Flight Engineers:
| Percentile | 10% | 25% | 50% (Median) |
75% | 90% |
|---|---|---|---|---|---|
| Annual Wage (2) | $ 101,710 | $ 142,770 | $ 219,140 | (5) | (5) |
Industries with the highest published employment and wages for Airline Pilots, Copilots, and Flight Engineers are provided. For a list of all industries with employment in Airline Pilots, Copilots, and Flight Engineers, see the Create Customized Tables function.
Industries with the highest levels of employment in Airline Pilots, Copilots, and Flight Engineers:
| Industry | Employment (1) | Percent of industry employment | Hourly mean wage | Annual mean wage (2) |
|---|---|---|---|---|
| Scheduled Air Transportation | 79,790 | 16.68 | (4) | $ 257,840 |
| Couriers and Express Delivery Services | 4,610 | 0.50 | (4) | $ 342,560 |
| Federal, State, and Local Government, excluding State and Local Government Schools and Hospitals and the U.S. Postal Service (OEWS Designation) | 2,800 | 0.13 | (4) | $ 125,830 |
| Support Activities for Air Transportation | 1,930 | 0.76 | (4) | $ 138,150 |
| Management of Companies and Enterprises | 1,920 | 0.07 | (4) | $ 152,670 |
Industries with the highest concentration of employment in Airline Pilots, Copilots, and Flight Engineers:
| Industry | Employment (1) | Percent of industry employment | Hourly mean wage | Annual mean wage (2) |
|---|---|---|---|---|
| Scheduled Air Transportation | 79,790 | 16.68 | (4) | $ 257,840 |
| Nonscheduled Air Transportation | 850 | 1.46 | (4) | $ 162,480 |
| Support Activities for Air Transportation | 1,930 | 0.76 | (4) | $ 138,150 |
| Couriers and Express Delivery Services | 4,610 | 0.50 | (4) | $ 342,560 |
| Technical and Trade Schools | 640 | 0.45 | (4) | $ 86,470 |
Top paying industries for Airline Pilots, Copilots, and Flight Engineers:
| Industry | Employment (1) | Percent of industry employment | Hourly mean wage | Annual mean wage (2) |
|---|---|---|---|---|
| Couriers and Express Delivery Services | 4,610 | 0.50 | (4) | $ 342,560 |
| Scheduled Air Transportation | 79,790 | 16.68 | (4) | $ 257,840 |
| Nonscheduled Air Transportation | 850 | 1.46 | (4) | $ 162,480 |
| Management of Companies and Enterprises | 1,920 | 0.07 | (4) | $ 152,670 |
| Support Activities for Air Transportation | 1,930 | 0.76 | (4) | $ 138,150 |
States and areas with the highest published employment, location quotients, and wages for Airline Pilots, Copilots, and Flight Engineers are provided. For a list of all areas with employment in Airline Pilots, Copilots, and Flight Engineers, see the Create Customized Tables function.
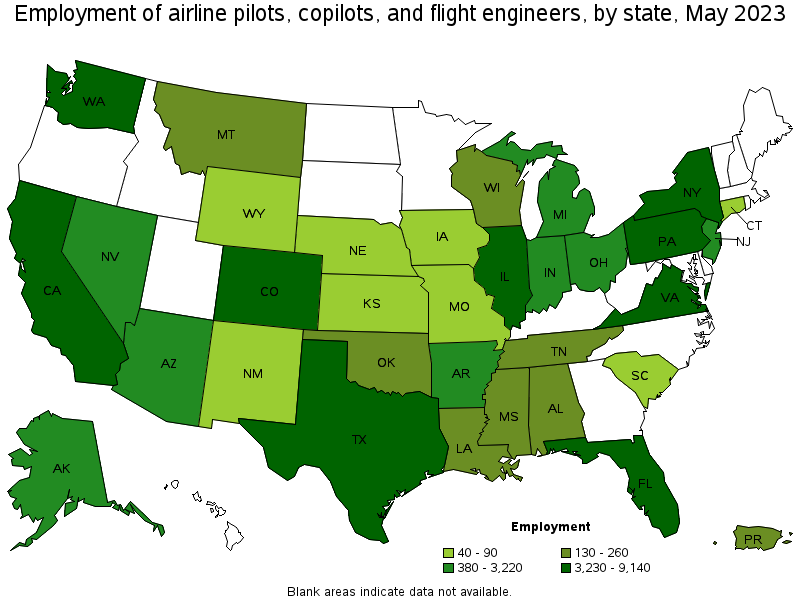
States with the highest employment level in Airline Pilots, Copilots, and Flight Engineers:
| State | Employment (1) | Employment per thousand jobs | Location quotient (9) | Hourly mean wage | Annual mean wage (2) |
|---|---|---|---|---|---|
| California | 9,140 | 0.51 | 0.83 | (4) | $ 286,040 |
| Illinois | 7,820 | 1.30 | 2.11 | (4) | $ 298,460 |
| Texas | 7,800 | 0.58 | 0.93 | (4) | $ 227,380 |
| New York | 7,240 | 0.77 | 1.25 | (4) | $ 238,630 |
| Florida | 7,130 | 0.75 | 1.21 | (4) | $ 283,740 |
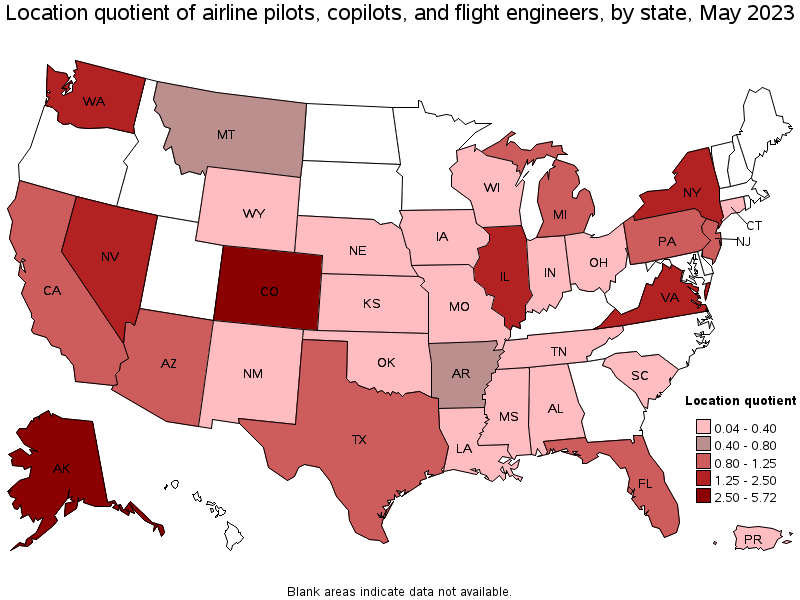
States with the highest concentration of jobs and location quotients in Airline Pilots, Copilots, and Flight Engineers:
| State | Employment (1) | Employment per thousand jobs | Location quotient (9) | Hourly mean wage | Annual mean wage (2) |
|---|---|---|---|---|---|
| Alaska | 1,100 | 3.53 | 5.72 | (8) | (8) |
| Colorado | 5,490 | 1.94 | 3.14 | (4) | $ 179,460 |
| Illinois | 7,820 | 1.30 | 2.11 | (4) | $ 298,460 |
| Nevada | 1,630 | 1.10 | 1.79 | (4) | $ 220,750 |
| Washington | 3,670 | 1.05 | 1.70 | (4) | $ 369,440 |
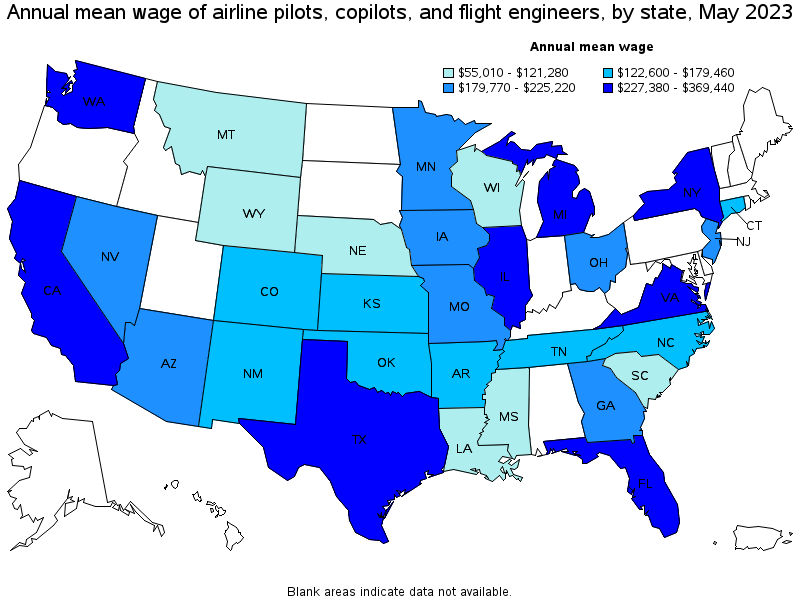
Top paying states for Airline Pilots, Copilots, and Flight Engineers:
| State | Employment (1) | Employment per thousand jobs | Location quotient (9) | Hourly mean wage | Annual mean wage (2) |
|---|---|---|---|---|---|
| Washington | 3,670 | 1.05 | 1.70 | (4) | $ 369,440 |
| Illinois | 7,820 | 1.30 | 2.11 | (4) | $ 298,460 |
| California | 9,140 | 0.51 | 0.83 | (4) | $ 286,040 |
| Florida | 7,130 | 0.75 | 1.21 | (4) | $ 283,740 |
| Virginia | 3,230 | 0.81 | 1.32 | (4) | $ 245,980 |
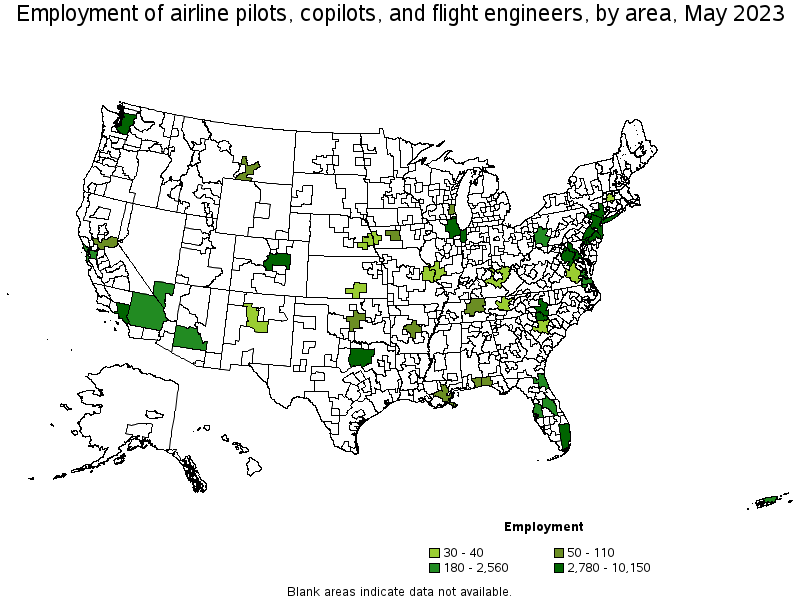
Metropolitan areas with the highest employment level in Airline Pilots, Copilots, and Flight Engineers:
| Metropolitan area | Employment (1) | Employment per thousand jobs | Location quotient (9) | Hourly mean wage | Annual mean wage (2) |
|---|---|---|---|---|---|
| New York-Newark-Jersey City, NY-NJ-PA | 10,150 | 1.07 | 1.73 | (4) | $ 235,290 |
| Chicago-Naperville-Elgin, IL-IN-WI | 7,800 | 1.73 | 2.81 | (4) | $ 298,250 |
| Los Angeles-Long Beach-Anaheim, CA | 5,750 | 0.93 | 1.51 | (4) | $ 279,870 |
| Denver-Aurora-Lakewood, CO | 5,280 | 3.32 | 5.39 | (4) | $ 180,980 |
| Miami-Fort Lauderdale-West Palm Beach, FL | 4,380 | 1.61 | 2.61 | (4) | $ 312,870 |
| Dallas-Fort Worth-Arlington, TX | 4,240 | 1.07 | 1.73 | (4) | $ 241,930 |
| Charlotte-Concord-Gastonia, NC-SC | 3,840 | 2.93 | 4.75 | (4) | $ 143,030 |
| Seattle-Tacoma-Bellevue, WA | 3,510 | 1.69 | 2.74 | (4) | $ 379,080 |
| Philadelphia-Camden-Wilmington, PA-NJ-DE-MD | 3,170 | 1.12 | 1.81 | (8) | (8) |
| Washington-Arlington-Alexandria, DC-VA-MD-WV | 2,780 | 0.90 | 1.46 | (4) | $ 259,790 |
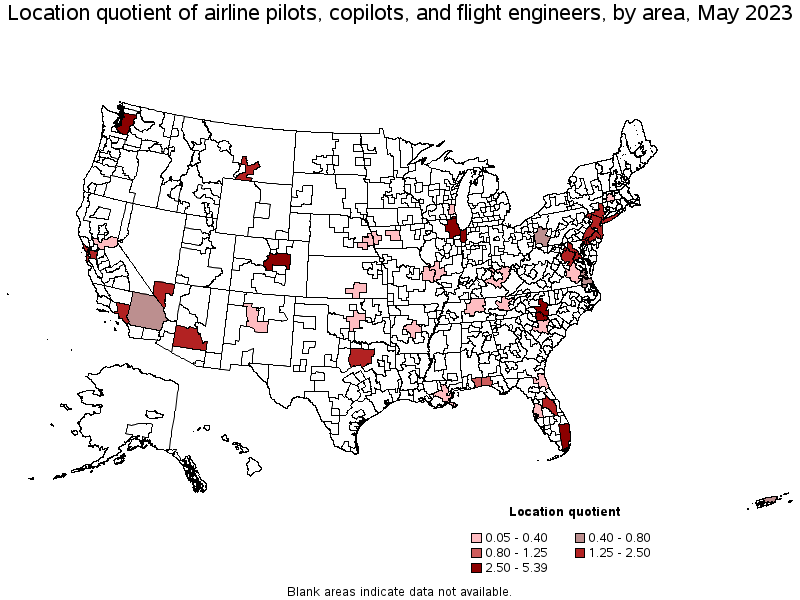
Metropolitan areas with the highest concentration of jobs and location quotients in Airline Pilots, Copilots, and Flight Engineers:
| Metropolitan area | Employment (1) | Employment per thousand jobs | Location quotient (9) | Hourly mean wage | Annual mean wage (2) |
|---|---|---|---|---|---|
| Denver-Aurora-Lakewood, CO | 5,280 | 3.32 | 5.39 | (4) | $ 180,980 |
| Charlotte-Concord-Gastonia, NC-SC | 3,840 | 2.93 | 4.75 | (4) | $ 143,030 |
| Chicago-Naperville-Elgin, IL-IN-WI | 7,800 | 1.73 | 2.81 | (4) | $ 298,250 |
| Seattle-Tacoma-Bellevue, WA | 3,510 | 1.69 | 2.74 | (4) | $ 379,080 |
| Miami-Fort Lauderdale-West Palm Beach, FL | 4,380 | 1.61 | 2.61 | (4) | $ 312,870 |
| Las Vegas-Henderson-Paradise, NV | 1,610 | 1.49 | 2.41 | (4) | $ 221,970 |
| Orlando-Kissimmee-Sanford, FL | 1,560 | 1.14 | 1.85 | (4) | $ 260,920 |
| Philadelphia-Camden-Wilmington, PA-NJ-DE-MD | 3,170 | 1.12 | 1.81 | (8) | (8) |
| Dallas-Fort Worth-Arlington, TX | 4,240 | 1.07 | 1.73 | (4) | $ 241,930 |
| New York-Newark-Jersey City, NY-NJ-PA | 10,150 | 1.07 | 1.73 | (4) | $ 235,290 |
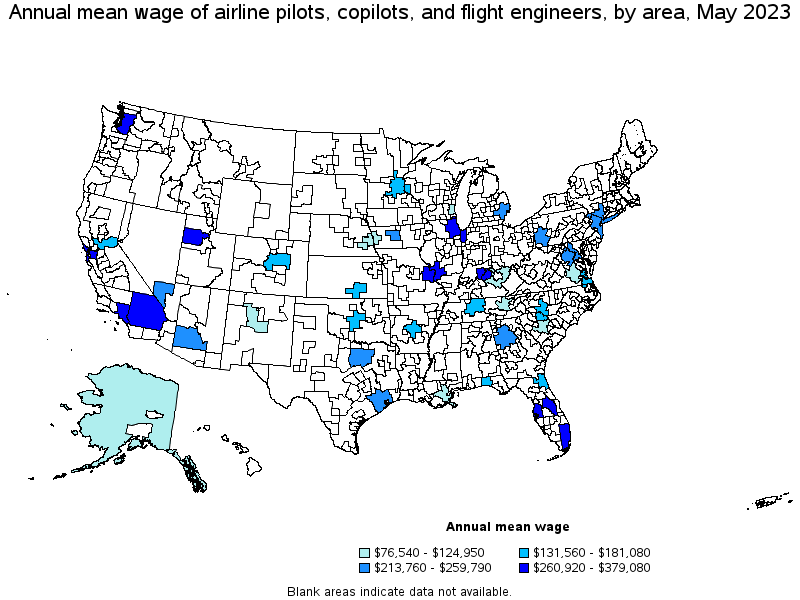
Top paying metropolitan areas for Airline Pilots, Copilots, and Flight Engineers:
| Metropolitan area | Employment (1) | Employment per thousand jobs | Location quotient (9) | Hourly mean wage | Annual mean wage (2) |
|---|---|---|---|---|---|
| Seattle-Tacoma-Bellevue, WA | 3,510 | 1.69 | 2.74 | (4) | $ 379,080 |
| Louisville/Jefferson County, KY-IN | (8) | (8) | (8) | (4) | $ 371,770 |
| Miami-Fort Lauderdale-West Palm Beach, FL | 4,380 | 1.61 | 2.61 | (4) | $ 312,870 |
| San Francisco-Oakland-Hayward, CA | 2,560 | 1.06 | 1.72 | (4) | $ 309,650 |
| Riverside-San Bernardino-Ontario, CA | 470 | 0.29 | 0.46 | (4) | $ 299,310 |
| Chicago-Naperville-Elgin, IL-IN-WI | 7,800 | 1.73 | 2.81 | (4) | $ 298,250 |
| St. Louis, MO-IL | 40 | 0.03 | 0.05 | (4) | $ 289,740 |
| Los Angeles-Long Beach-Anaheim, CA | 5,750 | 0.93 | 1.51 | (4) | $ 279,870 |
| Salt Lake City, UT | (8) | (8) | (8) | (4) | $ 270,550 |
| Tampa-St. Petersburg-Clearwater, FL | 250 | 0.18 | 0.28 | (4) | $ 260,930 |
Nonmetropolitan areas with the highest employment in Airline Pilots, Copilots, and Flight Engineers:
| Nonmetropolitan area | Employment (1) | Employment per thousand jobs | Location quotient (9) | Hourly mean wage | Annual mean wage (2) |
|---|---|---|---|---|---|
| Central Kentucky nonmetropolitan area | 40 | 0.21 | 0.34 | (4) | $ 76,540 |
Nonmetropolitan areas with the highest concentration of jobs and location quotients in Airline Pilots, Copilots, and Flight Engineers:
| Nonmetropolitan area | Employment (1) | Employment per thousand jobs | Location quotient (9) | Hourly mean wage | Annual mean wage (2) |
|---|---|---|---|---|---|
| Central Kentucky nonmetropolitan area | 40 | 0.21 | 0.34 | (4) | $ 76,540 |
Top paying nonmetropolitan areas for Airline Pilots, Copilots, and Flight Engineers:
| Nonmetropolitan area | Employment (1) | Employment per thousand jobs | Location quotient (9) | Hourly mean wage | Annual mean wage (2) |
|---|---|---|---|---|---|
| Alaska nonmetropolitan area | (8) | (8) | (8) | (4) | $ 98,270 |
| Central Kentucky nonmetropolitan area | 40 | 0.21 | 0.34 | (4) | $ 76,540 |
These estimates are calculated with data collected from employers in all industry sectors, all metropolitan and nonmetropolitan areas, and all states and the District of Columbia. The top employment and wage figures are provided above. The complete list is available in the downloadable XLS files.
The percentile wage estimate is the value of a wage below which a certain percent of workers fall. The median wage is the 50th percentile wage estimate—50 percent of workers earn less than the median and 50 percent of workers earn more than the median. More about percentile wages.
(1) Estimates for detailed occupations do not sum to the totals because the totals include occupations not shown separately. Estimates do not include self-employed workers.
(2) Annual wages have been calculated by multiplying the hourly mean wage by a "year-round, full-time" hours figure of 2,080 hours; for those occupations where there is not an hourly wage published, the annual wage has been directly calculated from the reported survey data.
(3) The relative standard error (RSE) is a measure of the reliability of a survey statistic. The smaller the relative standard error, the more precise the estimate.
(4) Wages for some occupations that do not generally work year-round, full time, are reported either as hourly wages or annual salaries depending on how they are typically paid.
(5) This wage is equal to or greater than $115.00 per hour or $239,200 per year.
(8) Estimate not released.
(9) The location quotient is the ratio of the area concentration of occupational employment to the national average concentration. A location quotient greater than one indicates the occupation has a higher share of employment than average, and a location quotient less than one indicates the occupation is less prevalent in the area than average.
Other OEWS estimates and related information:
May 2023 National Occupational Employment and Wage Estimates
May 2023 State Occupational Employment and Wage Estimates
May 2023 Metropolitan and Nonmetropolitan Area Occupational Employment and Wage Estimates
May 2023 National Industry-Specific Occupational Employment and Wage Estimates
Last Modified Date: April 3, 2024