
An official website of the United States government
An official website of the United States government
The .gov means it's official.
Federal government websites often end in .gov or .mil. Before sharing sensitive information,
make sure you're on a federal government site.
The site is secure.
The
https:// ensures that you are connecting to the official website and that any
information you provide is encrypted and transmitted securely.
All motor vehicle operators not listed separately.
Employment estimate and mean wage estimates for Motor Vehicle Operators, All Other:
| Employment (1) | Employment RSE (3) |
Mean hourly wage |
Mean annual wage (2) |
Wage RSE (3) |
|---|---|---|---|---|
| 51,140 | 3.5 % | $ 19.22 | $ 39,970 | 1.4 % |
Percentile wage estimates for Motor Vehicle Operators, All Other:
| Percentile | 10% | 25% | 50% (Median) |
75% | 90% |
|---|---|---|---|---|---|
| Hourly Wage | $ 11.80 | $ 13.89 | $ 17.16 | $ 22.33 | $ 30.49 |
| Annual Wage (2) | $ 24,550 | $ 28,890 | $ 35,690 | $ 46,440 | $ 63,410 |
Industries with the highest published employment and wages for Motor Vehicle Operators, All Other are provided. For a list of all industries with employment in Motor Vehicle Operators, All Other, see the Create Customized Tables function.
Industries with the highest levels of employment in Motor Vehicle Operators, All Other:
| Industry | Employment (1) | Percent of industry employment | Hourly mean wage | Annual mean wage (2) |
|---|---|---|---|---|
| Automobile Dealers | 8,320 | 0.66 | $ 14.52 | $ 30,200 |
| Automotive Equipment Rental and Leasing | 5,830 | 2.80 | $ 14.34 | $ 29,820 |
| Federal, State, and Local Government, excluding State and Local Government Schools and Hospitals and the U.S. Postal Service (OEWS Designation) | 4,510 | 0.21 | $ 27.22 | $ 56,610 |
| Support Activities for Water Transportation | 2,990 | 3.14 | $ 29.02 | $ 60,360 |
| Services to Buildings and Dwellings | 2,710 | 0.12 | $ 20.89 | $ 43,450 |
Industries with the highest concentration of employment in Motor Vehicle Operators, All Other:
| Industry | Employment (1) | Percent of industry employment | Hourly mean wage | Annual mean wage (2) |
|---|---|---|---|---|
| Support Activities for Water Transportation | 2,990 | 3.14 | $ 29.02 | $ 60,360 |
| Automotive Equipment Rental and Leasing | 5,830 | 2.80 | $ 14.34 | $ 29,820 |
| Support Activities for Road Transportation | 1,760 | 1.54 | $ 18.20 | $ 37,860 |
| Support Activities for Rail Transportation | 400 | 1.09 | $ 17.11 | $ 35,580 |
| Automobile Dealers | 8,320 | 0.66 | $ 14.52 | $ 30,200 |
Top paying industries for Motor Vehicle Operators, All Other:
| Industry | Employment (1) | Percent of industry employment | Hourly mean wage | Annual mean wage (2) |
|---|---|---|---|---|
| Electric Power Generation, Transmission and Distribution | 30 | 0.01 | $ 45.34 | $ 94,310 |
| Merchant Wholesalers, Nondurable Goods (4241, 4247, and 4249 only) | 50 | 0.01 | $ 38.86 | $ 80,820 |
| Motor Vehicle Manufacturing | 160 | 0.06 | $ 33.12 | $ 68,890 |
| Other Specialty Trade Contractors | 230 | 0.03 | $ 32.41 | $ 67,410 |
| Support Activities for Water Transportation | 2,990 | 3.14 | $ 29.02 | $ 60,360 |
States and areas with the highest published employment, location quotients, and wages for Motor Vehicle Operators, All Other are provided. For a list of all areas with employment in Motor Vehicle Operators, All Other, see the Create Customized Tables function.
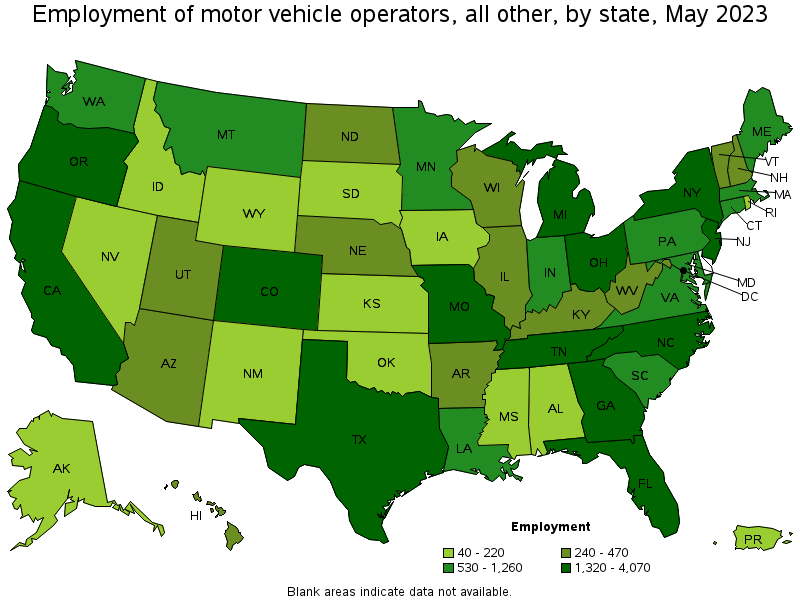
States with the highest employment level in Motor Vehicle Operators, All Other:
| State | Employment (1) | Employment per thousand jobs | Location quotient (9) | Hourly mean wage | Annual mean wage (2) |
|---|---|---|---|---|---|
| Texas | 4,070 | 0.30 | 0.89 | $ 17.18 | $ 35,730 |
| Georgia | 3,940 | 0.83 | 2.46 | $ 18.68 | $ 38,850 |
| Ohio | 3,700 | 0.68 | 2.01 | $ 16.33 | $ 33,970 |
| California | 3,090 | 0.17 | 0.51 | $ 24.14 | $ 50,200 |
| Florida | 2,690 | 0.28 | 0.83 | $ 16.75 | $ 34,830 |
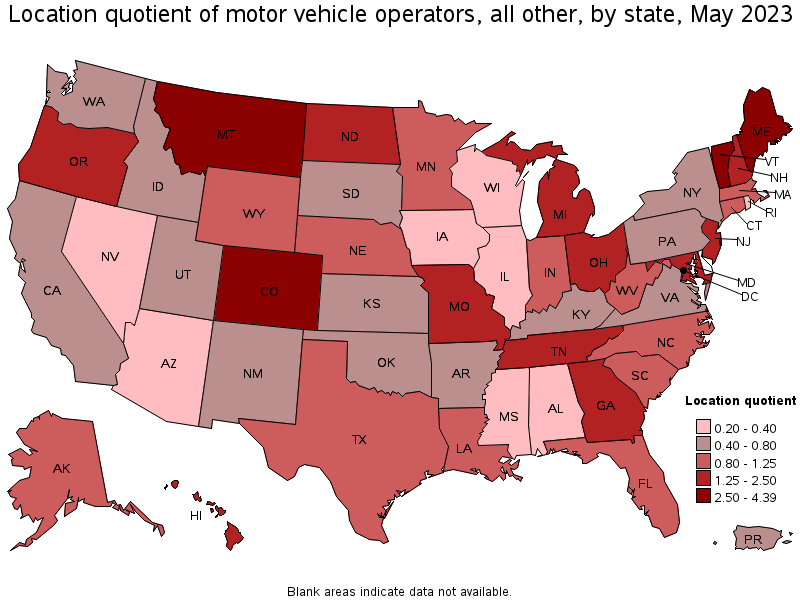
States with the highest concentration of jobs and location quotients in Motor Vehicle Operators, All Other:
| State | Employment (1) | Employment per thousand jobs | Location quotient (9) | Hourly mean wage | Annual mean wage (2) |
|---|---|---|---|---|---|
| District of Columbia | 1,040 | 1.48 | 4.39 | $ 29.84 | $ 62,070 |
| Montana | 620 | 1.24 | 3.69 | $ 19.22 | $ 39,980 |
| Vermont | 280 | 0.93 | 2.76 | $ 14.09 | $ 29,300 |
| Colorado | 2,560 | 0.91 | 2.69 | $ 19.39 | $ 40,330 |
| Maine | 530 | 0.86 | 2.55 | $ 15.20 | $ 31,620 |
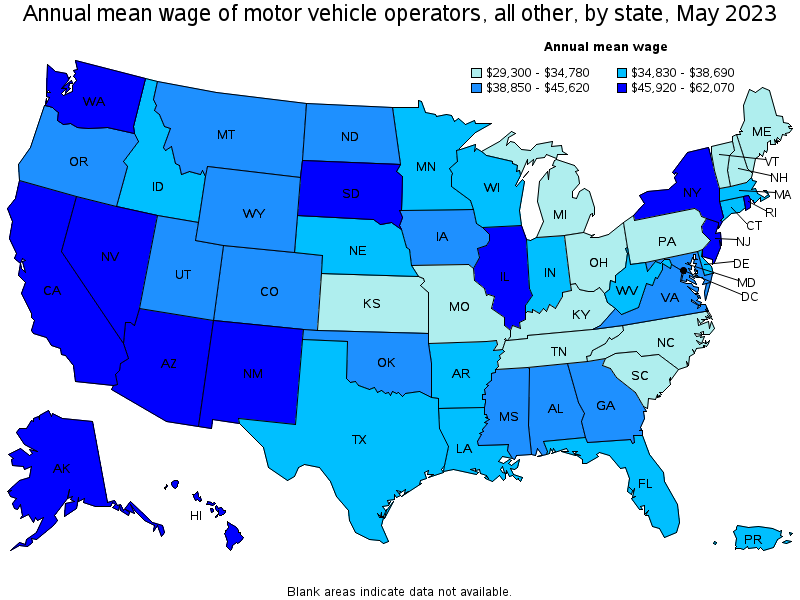
Top paying states for Motor Vehicle Operators, All Other:
| State | Employment (1) | Employment per thousand jobs | Location quotient (9) | Hourly mean wage | Annual mean wage (2) |
|---|---|---|---|---|---|
| District of Columbia | 1,040 | 1.48 | 4.39 | $ 29.84 | $ 62,070 |
| Alaska | 100 | 0.32 | 0.95 | $ 29.56 | $ 61,470 |
| Nevada | 160 | 0.11 | 0.32 | $ 29.13 | $ 60,580 |
| Illinois | 470 | 0.08 | 0.23 | $ 28.54 | $ 59,350 |
| New Jersey | 2,300 | 0.55 | 1.63 | $ 27.46 | $ 57,130 |
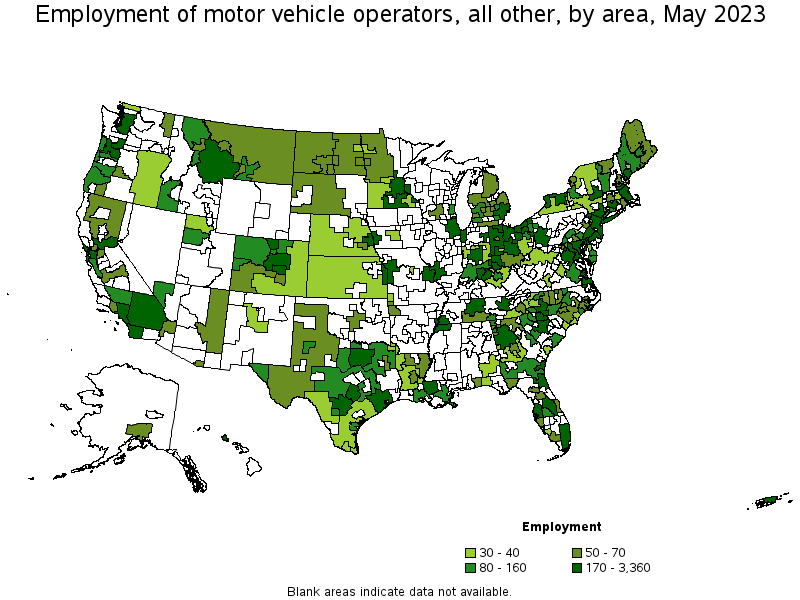
Metropolitan areas with the highest employment level in Motor Vehicle Operators, All Other:
| Metropolitan area | Employment (1) | Employment per thousand jobs | Location quotient (9) | Hourly mean wage | Annual mean wage (2) |
|---|---|---|---|---|---|
| New York-Newark-Jersey City, NY-NJ-PA | 3,360 | 0.35 | 1.05 | $ 26.90 | $ 55,950 |
| Atlanta-Sandy Springs-Roswell, GA | 1,880 | 0.67 | 1.99 | $ 15.77 | $ 32,810 |
| Washington-Arlington-Alexandria, DC-VA-MD-WV | 1,610 | 0.52 | 1.54 | $ 26.91 | $ 55,960 |
| Detroit-Warren-Dearborn, MI | 1,590 | 0.83 | 2.48 | $ 16.50 | $ 34,310 |
| Denver-Aurora-Lakewood, CO | 1,500 | 0.94 | 2.79 | $ 19.88 | $ 41,360 |
| Boston-Cambridge-Nashua, MA-NH | 1,280 | 0.46 | 1.37 | $ 17.89 | $ 37,210 |
| Dallas-Fort Worth-Arlington, TX | 1,150 | 0.29 | 0.86 | $ 17.62 | $ 36,660 |
| Los Angeles-Long Beach-Anaheim, CA | 960 | 0.16 | 0.46 | $ 23.32 | $ 48,510 |
| Houston-The Woodlands-Sugar Land, TX | 920 | 0.29 | 0.86 | $ 16.20 | $ 33,700 |
| Portland-Vancouver-Hillsboro, OR-WA | 840 | 0.69 | 2.06 | $ 21.01 | $ 43,710 |
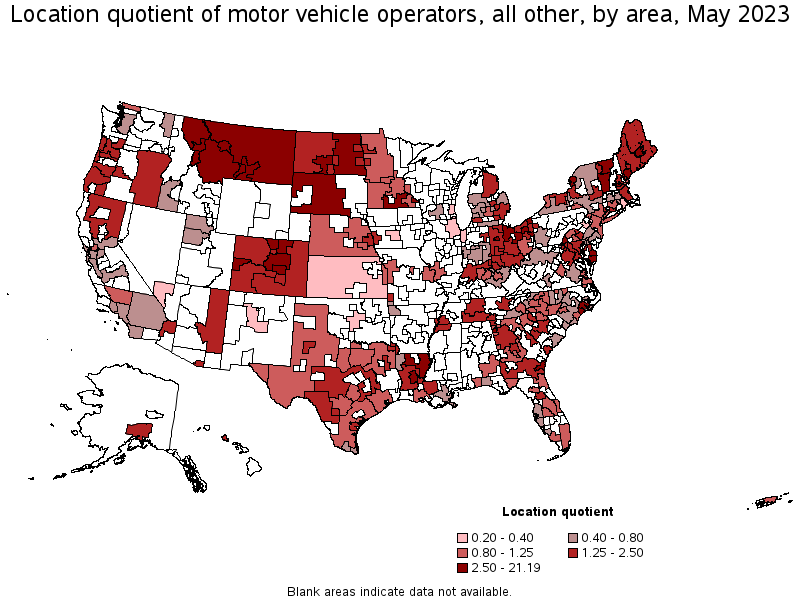
Metropolitan areas with the highest concentration of jobs and location quotients in Motor Vehicle Operators, All Other:
| Metropolitan area | Employment (1) | Employment per thousand jobs | Location quotient (9) | Hourly mean wage | Annual mean wage (2) |
|---|---|---|---|---|---|
| Brunswick, GA | 320 | 7.14 | 21.19 | $ 27.41 | $ 57,010 |
| Rome, GA | 90 | 2.10 | 6.23 | $ 12.01 | $ 24,990 |
| Billings, MT | 150 | 1.65 | 4.90 | $ 18.07 | $ 37,590 |
| Jacksonville, NC | 80 | 1.57 | 4.67 | $ 26.13 | $ 54,350 |
| Chambersburg-Waynesboro, PA | 90 | 1.48 | 4.40 | $ 24.06 | $ 50,040 |
| Great Falls, MT | 50 | 1.46 | 4.35 | $ 17.82 | $ 37,060 |
| Watertown-Fort Drum, NY | 50 | 1.39 | 4.12 | $ 25.21 | $ 52,440 |
| Lima, OH | 70 | 1.31 | 3.89 | $ 16.10 | $ 33,480 |
| Grand Junction, CO | 80 | 1.29 | 3.82 | $ 17.61 | $ 36,620 |
| Greeley, CO | 140 | 1.24 | 3.68 | $ 18.04 | $ 37,530 |
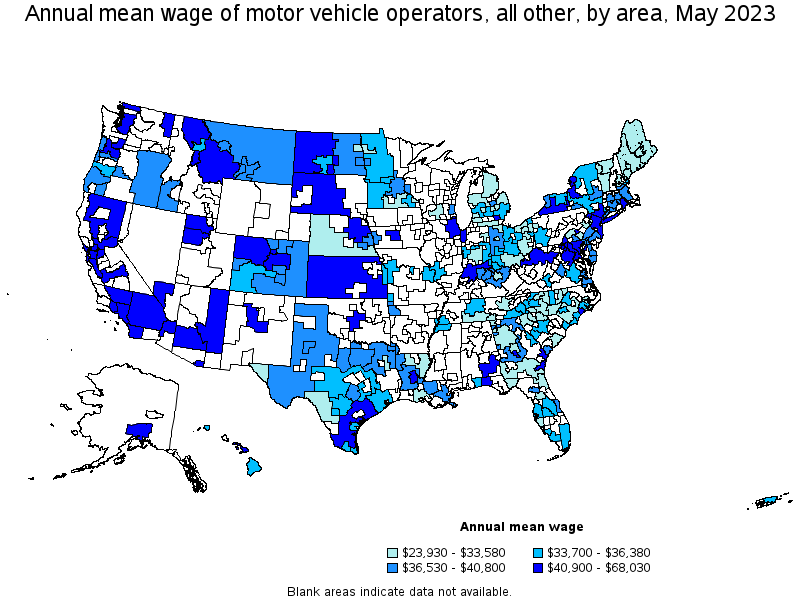
Top paying metropolitan areas for Motor Vehicle Operators, All Other:
| Metropolitan area | Employment (1) | Employment per thousand jobs | Location quotient (9) | Hourly mean wage | Annual mean wage (2) |
|---|---|---|---|---|---|
| Vallejo-Fairfield, CA | 50 | 0.34 | 1.01 | $ 32.71 | $ 68,030 |
| Chicago-Naperville-Elgin, IL-IN-WI | 430 | 0.10 | 0.29 | $ 32.07 | $ 66,700 |
| Las Vegas-Henderson-Paradise, NV | 120 | 0.11 | 0.32 | $ 30.39 | $ 63,200 |
| San Francisco-Oakland-Hayward, CA | 330 | 0.14 | 0.41 | $ 28.64 | $ 59,580 |
| Savannah, GA | (8) | (8) | (8) | $ 28.62 | $ 59,520 |
| Anchorage, AK | 70 | 0.43 | 1.26 | $ 28.56 | $ 59,410 |
| Brunswick, GA | 320 | 7.14 | 21.19 | $ 27.41 | $ 57,010 |
| Fresno, CA | 70 | 0.17 | 0.50 | $ 27.36 | $ 56,910 |
| Washington-Arlington-Alexandria, DC-VA-MD-WV | 1,610 | 0.52 | 1.54 | $ 26.91 | $ 55,960 |
| New York-Newark-Jersey City, NY-NJ-PA | 3,360 | 0.35 | 1.05 | $ 26.90 | $ 55,950 |
Nonmetropolitan areas with the highest employment in Motor Vehicle Operators, All Other:
| Nonmetropolitan area | Employment (1) | Employment per thousand jobs | Location quotient (9) | Hourly mean wage | Annual mean wage (2) |
|---|---|---|---|---|---|
| North Northeastern Ohio nonmetropolitan area (noncontiguous) | 270 | 0.84 | 2.50 | $ 16.81 | $ 34,960 |
| Southwest Montana nonmetropolitan area | 200 | 1.34 | 3.98 | $ 20.96 | $ 43,600 |
| West Northwestern Ohio nonmetropolitan area | 200 | 0.79 | 2.34 | $ 18.40 | $ 38,260 |
| Southeast Minnesota nonmetropolitan area | 190 | 1.27 | 3.77 | $ 15.83 | $ 32,930 |
| Southwest Maine nonmetropolitan area | 140 | 0.76 | 2.26 | $ 14.62 | $ 30,400 |
Nonmetropolitan areas with the highest concentration of jobs and location quotients in Motor Vehicle Operators, All Other:
| Nonmetropolitan area | Employment (1) | Employment per thousand jobs | Location quotient (9) | Hourly mean wage | Annual mean wage (2) |
|---|---|---|---|---|---|
| Southwest Montana nonmetropolitan area | 200 | 1.34 | 3.98 | $ 20.96 | $ 43,600 |
| Southeast Minnesota nonmetropolitan area | 190 | 1.27 | 3.77 | $ 15.83 | $ 32,930 |
| Southern Vermont nonmetropolitan area | 120 | 1.20 | 3.57 | $ 14.27 | $ 29,680 |
| Northern Vermont nonmetropolitan area | 70 | 1.05 | 3.11 | $ 13.97 | $ 29,050 |
| East North Dakota nonmetropolitan area | 70 | 1.05 | 3.11 | $ 19.24 | $ 40,010 |
Top paying nonmetropolitan areas for Motor Vehicle Operators, All Other:
| Nonmetropolitan area | Employment (1) | Employment per thousand jobs | Location quotient (9) | Hourly mean wage | Annual mean wage (2) |
|---|---|---|---|---|---|
| North Valley-Northern Mountains Region of California nonmetropolitan area | 50 | 0.50 | 1.49 | $ 26.34 | $ 54,800 |
| Southeast Alabama nonmetropolitan area | 30 | 0.36 | 1.07 | $ 26.05 | $ 54,190 |
| West North Dakota nonmetropolitan area | 70 | 0.63 | 1.87 | $ 24.69 | $ 51,350 |
| Arizona nonmetropolitan area | 60 | 0.66 | 1.96 | $ 24.43 | $ 50,820 |
| West South Dakota nonmetropolitan area | 50 | 0.87 | 2.57 | $ 23.93 | $ 49,770 |
These estimates are calculated with data collected from employers in all industry sectors, all metropolitan and nonmetropolitan areas, and all states and the District of Columbia. The top employment and wage figures are provided above. The complete list is available in the downloadable XLS files.
The percentile wage estimate is the value of a wage below which a certain percent of workers fall. The median wage is the 50th percentile wage estimate—50 percent of workers earn less than the median and 50 percent of workers earn more than the median. More about percentile wages.
(1) Estimates for detailed occupations do not sum to the totals because the totals include occupations not shown separately. Estimates do not include self-employed workers.
(2) Annual wages have been calculated by multiplying the hourly mean wage by a "year-round, full-time" hours figure of 2,080 hours; for those occupations where there is not an hourly wage published, the annual wage has been directly calculated from the reported survey data.
(3) The relative standard error (RSE) is a measure of the reliability of a survey statistic. The smaller the relative standard error, the more precise the estimate.
(8) Estimate not released.
(9) The location quotient is the ratio of the area concentration of occupational employment to the national average concentration. A location quotient greater than one indicates the occupation has a higher share of employment than average, and a location quotient less than one indicates the occupation is less prevalent in the area than average.
Other OEWS estimates and related information:
May 2023 National Occupational Employment and Wage Estimates
May 2023 State Occupational Employment and Wage Estimates
May 2023 Metropolitan and Nonmetropolitan Area Occupational Employment and Wage Estimates
May 2023 National Industry-Specific Occupational Employment and Wage Estimates
Last Modified Date: April 3, 2024