An official website of the United States government
 United States Department of Labor
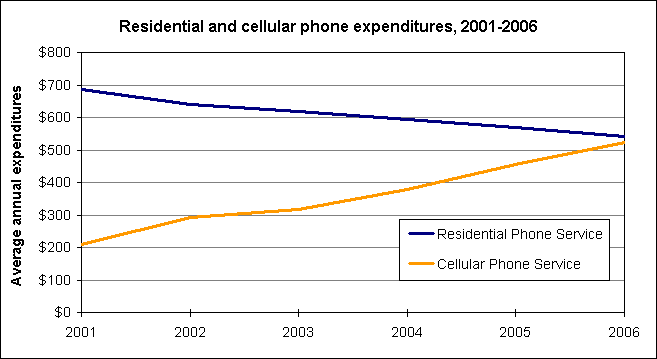
Data from the Bureau of Labor Statistics’ Consumer Expenditure Survey (CE) show that cellular phone expenditures increased rapidly from 2001 through 2006. Coupled with a decrease in spending on residential landline phone services (residential phone services) over the same period, spending on the two types of services were practically equal in 2006.
Expenditures for cellular phone services per consumer unit rose from $210 in 2001 to $524 in 2006, an increase of 149 percent. Expenditures for residential phone services per consumer unit fell from $686 in 2001 to $542 in 2006, a decline of 21 percent.

In 2001, the ratio of spending on residential phone services to spending on cellular phone services was greater than 3 to 1. In 2006, the shares of these two components were almost equal, with residential phone expenditures accounting for 49.9 percent of total telephone expenditures and cellular phone expenditures constituting 48.2 percent.
Data on cellular and residential telephones are unpublished components of telephone expenditures from the CE. Data for 2006 were released on October 26, 2007. Learn more in “Consumer Expenditures in 2006,” news release USDL 07-1644, on the Internet at https://www.bls.gov/news.release/cesan.nr0.htm. For more information, contact the CE program by email or call (202) 691-6900.
| 2001 | 2002 | 2003 | 2004 | 2005 | 2006 | |
|---|---|---|---|---|---|---|
Telephone services | $914 | $957 | $956 | $990 | $1,048 | $1,087 |
Residential telephone/pay phone | 686 | 641 | 620 | 592 | 570 | 542 |
Cellular phone service | 210 | 294 | 316 | 378 | 455 | 524 |
Other services (phone cards and pager services) | 19 | 22 | 20 | 20 | 23 | 21 |
| 2001 | 2002 | 2003 | 2004 | 2005 | 2006 | |
|---|---|---|---|---|---|---|
Telephone services | 100.0 | 100.0 | 100.0 | 100.0 | 100.0 | 100.0 |
Residential telephone/pay phone | 75.0 | 67.0 | 64.8 | 59.8 | 54.4 | 49.9 |
Cellular phone service | 23.0 | 30.7 | 33.1 | 38.2 | 43.4 | 48.2 |
Other services (phone cards and pager services) | 2.0 | 2.3 | 2.1 | 2.0 | 2.2 | 2.0 |
Last Modified Date: December 13, 2007