
An official website of the United States government
An official website of the United States government
The .gov means it's official.
Federal government websites often end in .gov or .mil. Before sharing sensitive information,
make sure you're on a federal government site.
The site is secure.
The
https:// ensures that you are connecting to the official website and that any
information you provide is encrypted and transmitted securely.
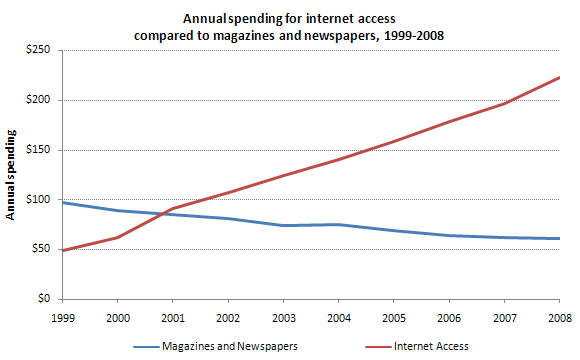
Detailed data from the BLS Consumer Expenditure Survey (CE) show a decade-long slide in spending on newspapers and magazines. In almost every year the average amount has fallen. This corresponds to information from the Newspaper Association of America showing a continuous decline in the number of readers.1 The most recent CE information shows that from 1999 to 2008 the nominal amount spent per consumer unit2 per year decreased by 38 percent, from about $97 to less than $61.
Over the same period, the amount spent by American consumers on accessing the internet through computer information services, which can be used to view online content, has been climbing steadily. While consumers were spending less on newspapers and magazines in the past decade, the amount they spent on computer information services more than quadrupled; increasing from $49 in 1999 to $222 in 2008.
The falloff in purchases of newspapers and magazines, both through subscriptions and from vendors and vending machines, has been steepest for the under-25 population, down 58 percent in the past 10 years. The amount spent increases by age group. The 65-and-over group spent the most on newspapers and magazines in 2008 -- $95 -- but that was still down 22 percent from 1999. This amount was also less than the amount they spent on computer information services -- $136.
For computer information services, the under-25 and the 65-and-over population spent the least, amount in both 1999 and 2008, but had the largest percentage increases in spending over the period.
| Newspaper and Magazines Demographic | 1999 | 2008 | Percent Drop |
|---|---|---|---|
Under 25 | $36 | $15 | 58 |
25-34 | 62 | 29 | 53 |
35-44 | 86 | 42 | 51 |
45-54 | 120 | 62 | 48 |
55-64 | 127 | 88 | 31 |
65 & over | 122 | 95 | 22 |
| Internet Access Demographic | 1999 | 2008 | Percent Increase |
|---|---|---|---|
Under 25 | $22 | $130 | 490 |
25-34 | 49 | 239 | 388 |
35-44 | 59 | 267 | 353 |
45-54 | 75 | 259 | 245 |
55-64 | 51 | 245 | 380 |
65 & over | 19 | 138 | 626 |
Data are summed from unpublished CE information. Total spending for internet access comes from Computer Information Services plus Internet Services Away from Home.
1 According to the Newspaper Association of America, total circulation figures for Daily plus Sunday papers have been falling since 1993. From 1999 to 2008 circulation was down 16 percent. http://www.naa.org/Trends-and-Numbers/Circulation/Newspaper-Circulation-Volume.aspx, as of February 10, 2012.
2 Consumer units include families, single persons living alone or sharing a household with others but who are financially independent, or two or more persons living together who share expenses.
Last Modified Date: February 10, 2012