An official website of the United States government
An official website of the United States government
The .gov means it's official.
Federal government websites often end in .gov or .mil. Before sharing sensitive information,
make sure you're on a federal government site.
The site is secure.
The
https:// ensures that you are connecting to the official website and that any
information you provide is encrypted and transmitted securely.
|
|
BLS has developed estimates of employment and hourly compensation costs in India's organized manufacturing sector. Compensation costs for India are not directly comparable with the data for the other countries published by BLS (see Data Features section below).
A complete discussion of data comparability issues and methods used to calculate the estimates can be found in the May 2010 Monthly Labor Review article "Labor costs in India's organized manufacturing sector".
The "organized sector" refers to the portion of India's manufacturing activity that is formally registered with state governments, and is thus subject to regulation.
It is important to note the following aspects of Indian source data that limit comparability with BLS estimates of compensation in other countries:
India’s central statistics office does not adjust data from its Annual Survey of Industries (ASI), the source of the BLS estimates, to correct for missing, incomplete, or incorrect data. In addition, penalties for noncompliance are rarely enforced. The data are thus less reliable than survey data that have been adjusted by the receiving statistical agency, or than data that are weighted to be representative of the entire survey population.
These data cover India's organized manufacturing sector only, that is, the portion of India's manufacturing activity that is formally registered with state governments, and is thus subject to regulation. The unorganized sector is not regulated, and little data exist for its enterprises. The organized sector produces two-thirds of India's manufacturing output; however, close to 80 percent of Indian manufacturing employees work in the unorganized sector. The lack of information on the unorganized sector means that a large segment of the manufacturing workforce is not represented in these data.
Contract workers, who are cheaper to employ because they are often not provided with benefits such as social insurance and paid vacation, make up a significant and growing portion of manufacturing workers in India (see Table 1). Data do not exist to remove contract workers' earnings from the earnings of other workers, as BLS does for its main series; as a result, it is likely that the labor cost estimates are lower than they would be if they excluded contract workers.
Hours actually worked are not recorded by the ASI; thus, it is not clear how much work occurs "off the books." Information gained from personal interviews indicates that overtime work is common, but that it is not always compensated at the legally required rate of two times the usual salary. Although earnings, hours, and employment that are not documented by employers likely affect the hourly compensation estimates presented below, no adjustments have been made because the magnitude of the unrecorded data is not known.
Chart 1.
Hourly compensation costs have grown steadily in both rupees and in U.S. dollars, but the rate of increase for production workers has been slower than the rate for all manufacturing employees. See Chart 1 and Table 1.
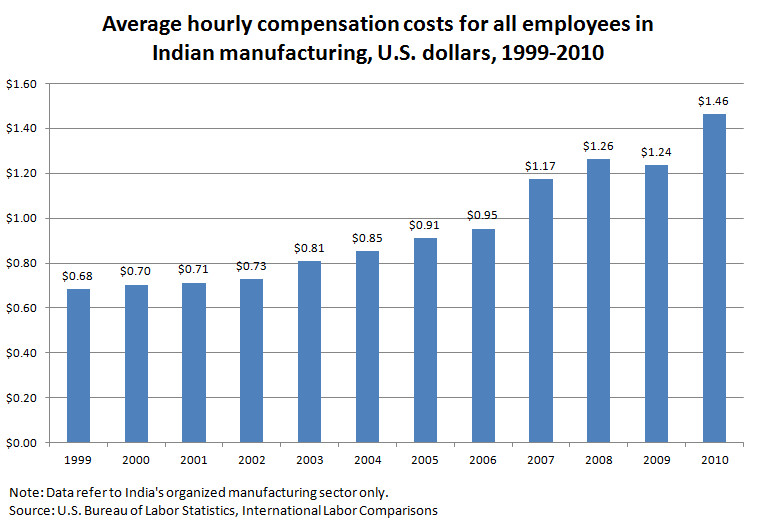
Table 1.
| YEAR | Average hourly earnings in rupees (hourly pay for time worked) | Hourly compensation in rupees | Hourly Compensation in U.S. dollars | |||
|---|---|---|---|---|---|---|
| All employees | Production Workers | All employees | Production Workers | All employees | Production Workers | |
| 1999 | 20.86 | 16.17 | 29.43 | 22.68 | 0.68 | 0.53 |
| 2000 | 22.74 | 17.16 | 31.68 | 23.75 | 0.70 | 0.53 |
| 2001 | 23.99 | 17.78 | 33.65 | 24.77 | 0.71 | 0.52 |
| 2002 | 25.20 | 18.48 | 35.36 | 25.73 | 0.73 | 0.53 |
| 2003 | 26.86 | 19.27 | 37.68 | 26.81 | 0.81 | 0.58 |
| 2004 | 27.88 | 19.78 | 38.55 | 27.10 | 0.85 | 0.60 |
| 2005 | 29.44 | 20.42 | 40.02 | 27.49 | 0.91 | 0.62 |
| 2006 | 31.76 | 21.57 | 43.07 | 28.94 | 0.95 | 0.64 |
| 2007 | 35.90 | 23.74 | 48.30 | 31.57 | 1.17 | 0.77 |
| 2008 | 41.06 | 26.22 | 54.76 | 34.54 | 1.26 | 0.80 |
| 2009 | 44.77 | 28.67 | 59.72 | 37.77 | 1.24 | 0.78 |
| 2010 | 51.00 | 32.37 | 66.84 | 41.87 | 1.46 | 0.92 |
| Note: | ||||||
Chart 2.
The gap between the compensation costs of production workers and non-production workers has nearly doubled in the past five years.
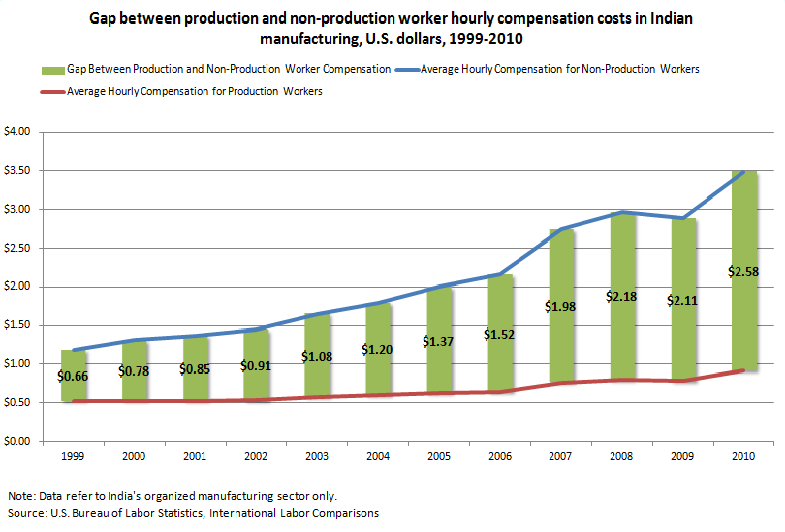
Table 2.
Employment of non-production and directly employed production workers has been growing since 2004, but not nearly as quickly as production workers employed through contractors. Workers hired through contractors likely earn less than directly hired workers, and their increasing numbers are one of the underlying reasons for the increasing gap between production and non-production worker compensation.
| Index: 1999 = 100 | All employees | Non-production workers | Production workers directly employed | Production workers employed through contractors | ||
|---|---|---|---|---|---|---|
| 1999 | 100 | 100 | 100 | 100 | ||
| 2000 | 96 | 91 | 96 | 106 | ||
| 2001 | 94 | 88 | 92 | 109 | ||
| 2002 | 95 | 86 | 92 | 118 | ||
| 2003 | 95 | 86 | 91 | 126 | ||
| 2004 | 99 | 89 | 93 | 144 | ||
| 2005 | 107 | 94 | 98 | 168 | ||
| 2006 | 117 | 102 | 105 | 195 | ||
| 2007 | 124 | 107 | 110 | 214 | ||
| 2008 | 133 | 120 | 115 | 234 | ||
| 2009 | 140 | 127 | 120 | 252 | ||
| 2010 | 150 | 134 | 126 | 280 | ||
| Source: U.S. Bureau of Labor Statistics, International Labor Comparisons | ||||||
Chart 3.
There is a fairly wide disparity in hourly compensation costs across manufacturing industries in India. In 2010, compensation for industries in the top quartile was on average about three times the compensation for industries in the bottom quartile. But the highest and lowest compensated industries in India tended to be similar to those in other countries: coke and petroleum products is generally among the highest paid industries, while wood, leather, textiles, and apparel products manufacturing are commonly lower paid industries.
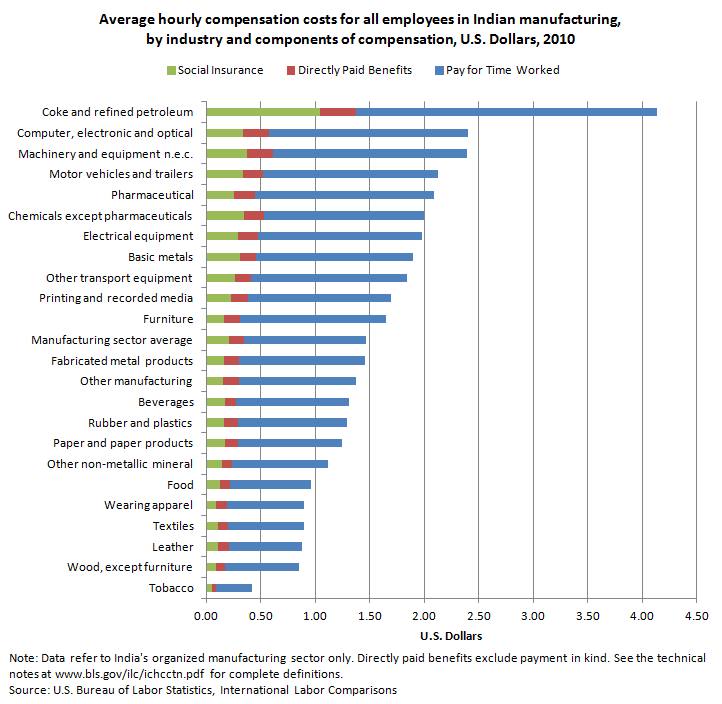
Chart 4.
In India, nearly 40 percent of organized manufacturing sector employees are in the low-paying food, beverage, and tobacco and the textiles, leather, and apparel industries.
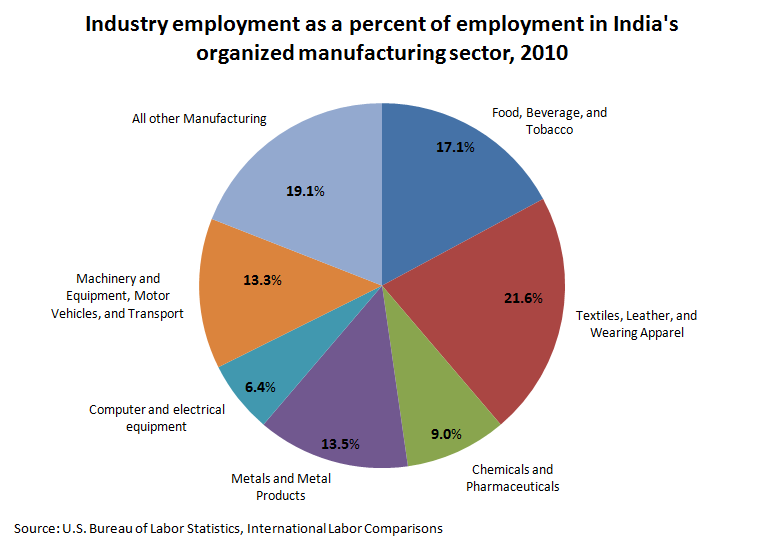
Chart 5.
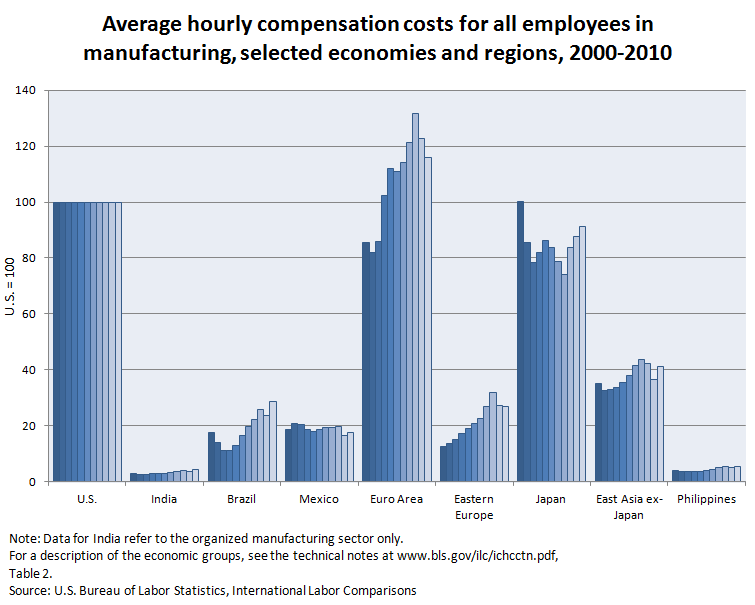
Indian manufacturing compensation costs are increasing relative to other countries, but still remain far below those of most other countries covered by BLS.
Although BLS hourly compensation cost estimates for India are not directly comparable with those for China or the United States, it is possible to look at them together for a rough indication of their relative compensation costs.
Chart 6.
There are several technical limitations with comparing India's manufacturing compensation costs with China’s that diminish the meaningfulness of direct level comparisons between the two. It does appear, however, that costs in China are growing at a faster rate than in India.
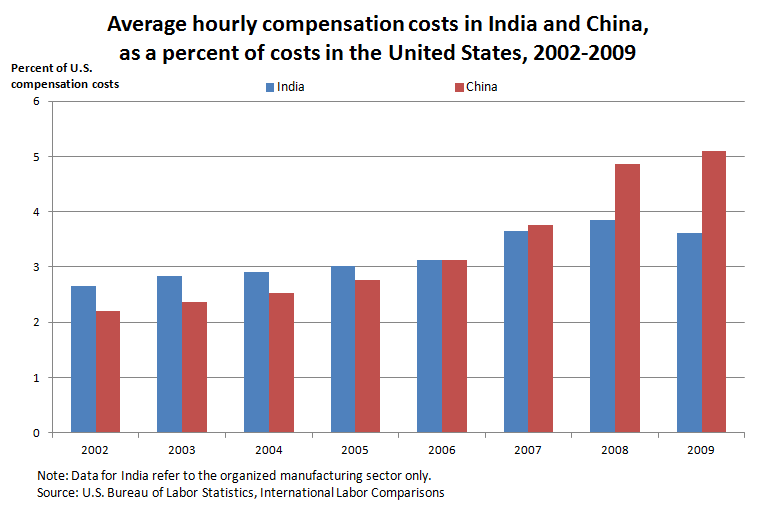
Chart 7.
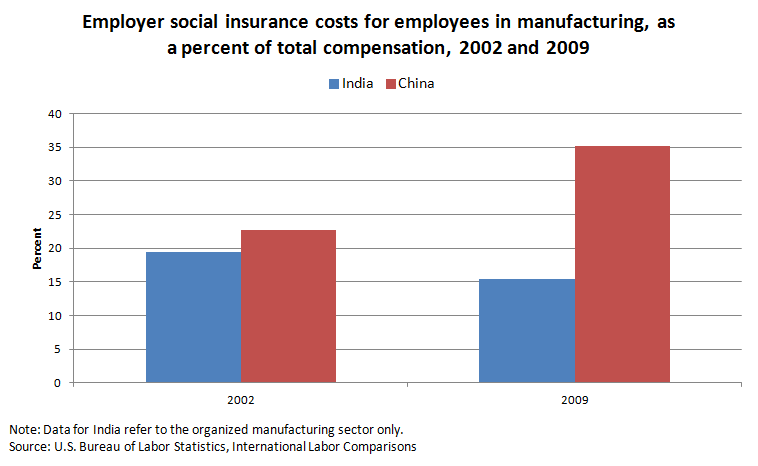
While social insurance costs as a percentage of total compensation have been rising in China, they have been on the decline in India. These diverging trends are a major reason why total compensation costs in China are increasing relative to costs in India.
Last Modified Date: August 28, 2013