
An official website of the United States government
An official website of the United States government
The .gov means it's official.
Federal government websites often end in .gov or .mil. Before sharing sensitive information,
make sure you're on a federal government site.
The site is secure.
The
https:// ensures that you are connecting to the official website and that any
information you provide is encrypted and transmitted securely.
Set up, maintain, and dismantle light fixtures, lighting control devices, and the associated lighting electrical and rigging equipment used for photography, television, film, video, and live productions. May focus or operate light fixtures, or attach color filters or other lighting accessories. Excludes �Audio and Video Technicians� (27-4011).
Employment estimate and mean wage estimates for Lighting Technicians:
| Employment (1) | Employment RSE (3) |
Mean hourly wage |
Mean annual wage (2) |
Wage RSE (3) |
|---|---|---|---|---|
| 8,540 | 5.3 % | $ 35.59 | $ 74,020 | 2.4 % |
Percentile wage estimates for Lighting Technicians:
| Percentile | 10% | 25% | 50% (Median) |
75% | 90% |
|---|---|---|---|---|---|
| Hourly Wage | $ 16.25 | $ 21.00 | $ 29.64 | $ 40.48 | $ 65.16 |
| Annual Wage (2) | $ 33,800 | $ 43,690 | $ 61,650 | $ 84,210 | $ 135,540 |
Industries with the highest published employment and wages for Lighting Technicians are provided. For a list of all industries with employment in Lighting Technicians, see the Create Customized Tables function.
Industries with the highest levels of employment in Lighting Technicians:
| Industry | Employment (1) | Percent of industry employment | Hourly mean wage | Annual mean wage (2) |
|---|---|---|---|---|
| Motion Picture and Video Industries | 3,100 | 0.74 | $ 46.79 | $ 97,320 |
| Traveler Accommodation | 780 | 0.05 | $ 33.12 | $ 68,880 |
| Independent Artists, Writers, and Performers | 700 | 1.13 | $ 33.46 | $ 69,590 |
| Performing Arts Companies | 630 | 0.52 | $ 30.68 | $ 63,810 |
| Promoters of Performing Arts, Sports, and Similar Events | 510 | 0.36 | $ 24.87 | $ 51,720 |
Industries with the highest concentration of employment in Lighting Technicians:
| Industry | Employment (1) | Percent of industry employment | Hourly mean wage | Annual mean wage (2) |
|---|---|---|---|---|
| Independent Artists, Writers, and Performers | 700 | 1.13 | $ 33.46 | $ 69,590 |
| Motion Picture and Video Industries | 3,100 | 0.74 | $ 46.79 | $ 97,320 |
| Performing Arts Companies | 630 | 0.52 | $ 30.68 | $ 63,810 |
| Promoters of Performing Arts, Sports, and Similar Events | 510 | 0.36 | $ 24.87 | $ 51,720 |
| Radio and Television Broadcasting Stations | 120 | 0.10 | $ 32.19 | $ 66,950 |
Top paying industries for Lighting Technicians:
| Industry | Employment (1) | Percent of industry employment | Hourly mean wage | Annual mean wage (2) |
|---|---|---|---|---|
| Motion Picture and Video Industries | 3,100 | 0.74 | $ 46.79 | $ 97,320 |
| Merchant Wholesalers, Durable Goods (4232, 4233, 4235, 4236, 4237, and 4239 only) | 40 | (7) | $ 40.43 | $ 84,100 |
| Independent Artists, Writers, and Performers | 700 | 1.13 | $ 33.46 | $ 69,590 |
| Traveler Accommodation | 780 | 0.05 | $ 33.12 | $ 68,880 |
| Radio and Television Broadcasting Stations | 120 | 0.10 | $ 32.19 | $ 66,950 |
States and areas with the highest published employment, location quotients, and wages for Lighting Technicians are provided. For a list of all areas with employment in Lighting Technicians, see the Create Customized Tables function.
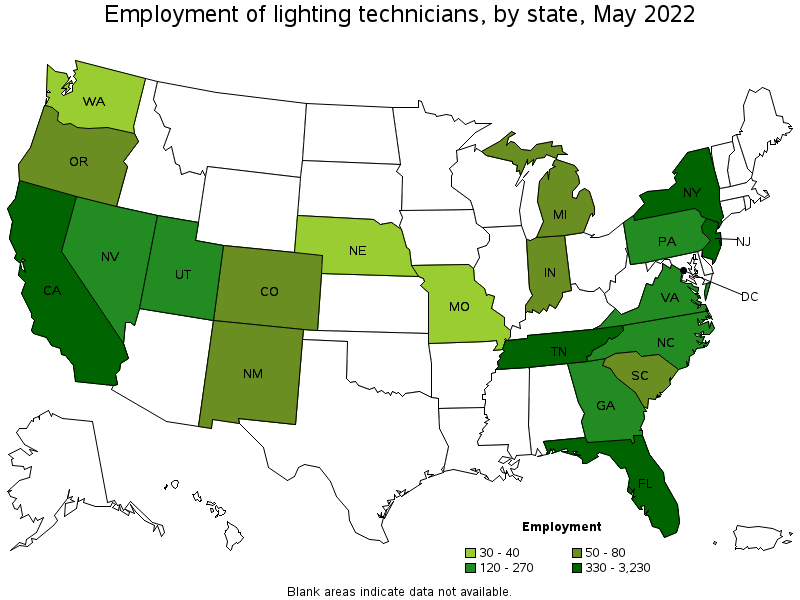
States with the highest employment level in Lighting Technicians:
| State | Employment (1) | Employment per thousand jobs | Location quotient (9) | Hourly mean wage | Annual mean wage (2) |
|---|---|---|---|---|---|
| California | 3,230 | 0.18 | 3.17 | $ 44.79 | $ 93,170 |
| Florida | 980 | 0.11 | 1.84 | $ 23.69 | $ 49,280 |
| New Jersey | 680 | 0.16 | 2.85 | $ 38.03 | $ 79,100 |
| New York | 510 | 0.06 | 0.98 | $ 38.05 | $ 79,140 |
| Tennessee | 330 | 0.10 | 1.81 | (8) | (8) |
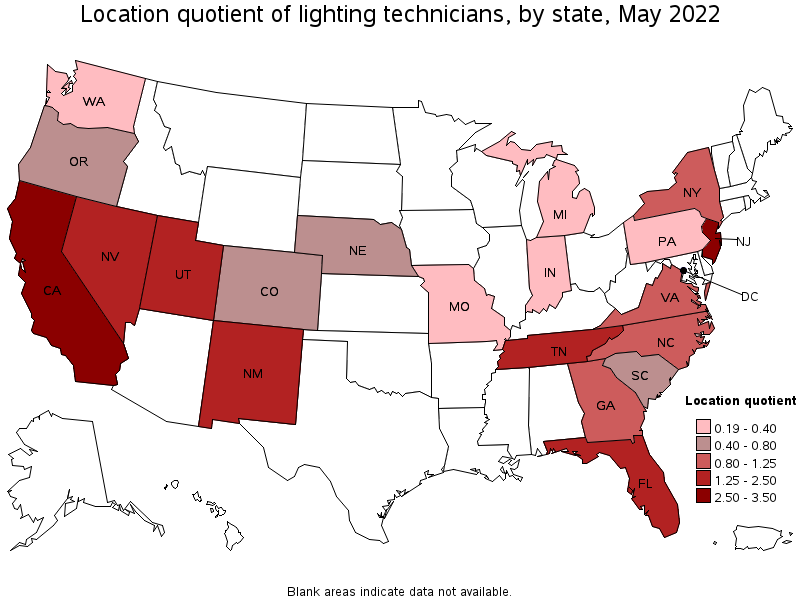
States with the highest concentration of jobs and location quotients in Lighting Technicians:
| State | Employment (1) | Employment per thousand jobs | Location quotient (9) | Hourly mean wage | Annual mean wage (2) |
|---|---|---|---|---|---|
| California | 3,230 | 0.18 | 3.17 | $ 44.79 | $ 93,170 |
| New Jersey | 680 | 0.16 | 2.85 | $ 38.03 | $ 79,100 |
| Utah | 200 | 0.12 | 2.11 | $ 24.09 | $ 50,120 |
| Florida | 980 | 0.11 | 1.84 | $ 23.69 | $ 49,280 |
| Tennessee | 330 | 0.10 | 1.81 | (8) | (8) |

Top paying states for Lighting Technicians:
| State | Employment (1) | Employment per thousand jobs | Location quotient (9) | Hourly mean wage | Annual mean wage (2) |
|---|---|---|---|---|---|
| California | 3,230 | 0.18 | 3.17 | $ 44.79 | $ 93,170 |
| Washington | 40 | 0.01 | 0.20 | $ 43.56 | $ 90,610 |
| Georgia | 230 | 0.05 | 0.85 | $ 39.14 | $ 81,410 |
| New York | 510 | 0.06 | 0.98 | $ 38.05 | $ 79,140 |
| New Jersey | 680 | 0.16 | 2.85 | $ 38.03 | $ 79,100 |
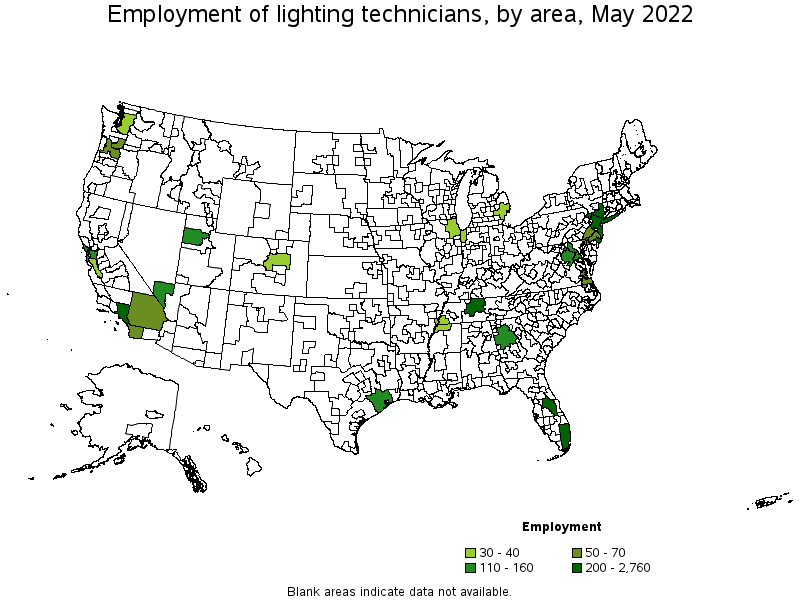
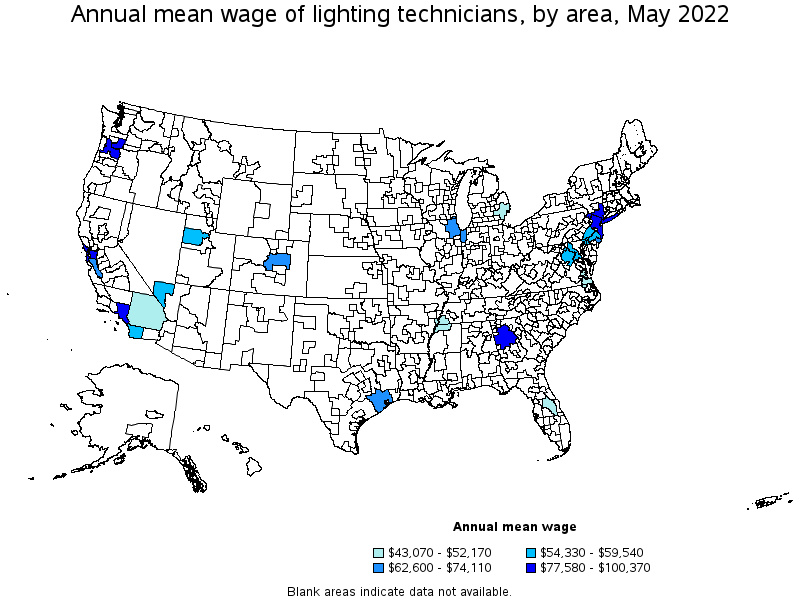
Metropolitan areas with the highest employment level in Lighting Technicians:
| Metropolitan area | Employment (1) | Employment per thousand jobs | Location quotient (9) | Hourly mean wage | Annual mean wage (2) |
|---|---|---|---|---|---|
| Los Angeles-Long Beach-Anaheim, CA | 2,760 | 0.45 | 7.83 | $ 47.21 | $ 98,190 |
| Atlantic City-Hammonton, NJ | 550 | 4.40 | 76.23 | $ 35.63 | $ 74,110 |
| New York-Newark-Jersey City, NY-NJ-PA | 530 | 0.06 | 1.01 | $ 39.94 | $ 83,080 |
| Orlando-Kissimmee-Sanford, FL | 490 | 0.37 | 6.47 | $ 25.08 | $ 52,170 |
| Miami-Fort Lauderdale-West Palm Beach, FL | 360 | 0.14 | 2.36 | (8) | (8) |
| Nashville-Davidson--Murfreesboro--Franklin, TN | 200 | 0.19 | 3.36 | (8) | (8) |
| Atlanta-Sandy Springs-Roswell, GA | 160 | 0.06 | 1.02 | $ 41.19 | $ 85,670 |
| San Francisco-Oakland-Hayward, CA | 150 | 0.06 | 1.12 | $ 37.30 | $ 77,580 |
| Salt Lake City, UT | 140 | 0.17 | 3.00 | $ 26.40 | $ 54,910 |
| Washington-Arlington-Alexandria, DC-VA-MD-WV | 130 | 0.04 | 0.76 | $ 28.63 | $ 59,540 |
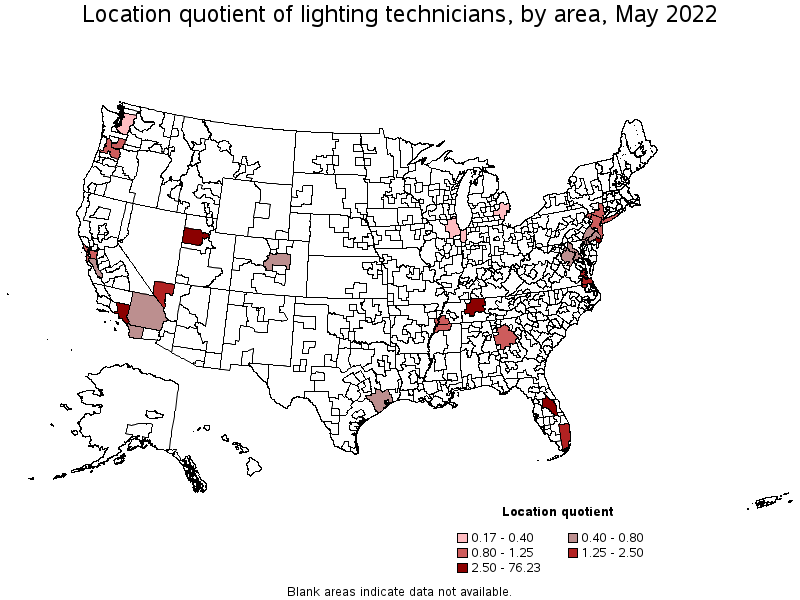
Metropolitan areas with the highest concentration of jobs and location quotients in Lighting Technicians:
| Metropolitan area | Employment (1) | Employment per thousand jobs | Location quotient (9) | Hourly mean wage | Annual mean wage (2) |
|---|---|---|---|---|---|
| Atlantic City-Hammonton, NJ | 550 | 4.40 | 76.23 | $ 35.63 | $ 74,110 |
| Los Angeles-Long Beach-Anaheim, CA | 2,760 | 0.45 | 7.83 | $ 47.21 | $ 98,190 |
| Orlando-Kissimmee-Sanford, FL | 490 | 0.37 | 6.47 | $ 25.08 | $ 52,170 |
| Nashville-Davidson--Murfreesboro--Franklin, TN | 200 | 0.19 | 3.36 | (8) | (8) |
| Salt Lake City, UT | 140 | 0.17 | 3.00 | $ 26.40 | $ 54,910 |
| Miami-Fort Lauderdale-West Palm Beach, FL | 360 | 0.14 | 2.36 | (8) | (8) |
| Las Vegas-Henderson-Paradise, NV | 110 | 0.11 | 1.92 | $ 28.11 | $ 58,480 |
| Virginia Beach-Norfolk-Newport News, VA-NC | 60 | 0.09 | 1.48 | $ 22.91 | $ 47,660 |
| San Francisco-Oakland-Hayward, CA | 150 | 0.06 | 1.12 | $ 37.30 | $ 77,580 |
| Atlanta-Sandy Springs-Roswell, GA | 160 | 0.06 | 1.02 | $ 41.19 | $ 85,670 |
Top paying metropolitan areas for Lighting Technicians:
| Metropolitan area | Employment (1) | Employment per thousand jobs | Location quotient (9) | Hourly mean wage | Annual mean wage (2) |
|---|---|---|---|---|---|
| Portland-Vancouver-Hillsboro, OR-WA | 70 | 0.06 | 0.96 | $ 48.26 | $ 100,370 |
| Los Angeles-Long Beach-Anaheim, CA | 2,760 | 0.45 | 7.83 | $ 47.21 | $ 98,190 |
| Atlanta-Sandy Springs-Roswell, GA | 160 | 0.06 | 1.02 | $ 41.19 | $ 85,670 |
| New York-Newark-Jersey City, NY-NJ-PA | 530 | 0.06 | 1.01 | $ 39.94 | $ 83,080 |
| San Francisco-Oakland-Hayward, CA | 150 | 0.06 | 1.12 | $ 37.30 | $ 77,580 |
| Atlantic City-Hammonton, NJ | 550 | 4.40 | 76.23 | $ 35.63 | $ 74,110 |
| San Jose-Sunnyvale-Santa Clara, CA | 40 | 0.03 | 0.59 | $ 32.62 | $ 67,850 |
| Chicago-Naperville-Elgin, IL-IN-WI | 40 | 0.01 | 0.17 | $ 31.21 | $ 64,910 |
| Houston-The Woodlands-Sugar Land, TX | 120 | 0.04 | 0.68 | $ 30.46 | $ 63,350 |
| Denver-Aurora-Lakewood, CO | 40 | 0.03 | 0.44 | $ 30.10 | $ 62,600 |
These estimates are calculated with data collected from employers in all industry sectors, all metropolitan and nonmetropolitan areas, and all states and the District of Columbia. The top employment and wage figures are provided above. The complete list is available in the downloadable XLS files.
The percentile wage estimate is the value of a wage below which a certain percent of workers fall. The median wage is the 50th percentile wage estimate—50 percent of workers earn less than the median and 50 percent of workers earn more than the median. More about percentile wages.
(1) Estimates for detailed occupations do not sum to the totals because the totals include occupations not shown separately. Estimates do not include self-employed workers.
(2) Annual wages have been calculated by multiplying the hourly mean wage by a "year-round, full-time" hours figure of 2,080 hours; for those occupations where there is not an hourly wage published, the annual wage has been directly calculated from the reported survey data.
(3) The relative standard error (RSE) is a measure of the reliability of a survey statistic. The smaller the relative standard error, the more precise the estimate.
(7) The value is less than .005 percent of industry employment.
(8) Estimate not released.
(9) The location quotient is the ratio of the area concentration of occupational employment to the national average concentration. A location quotient greater than one indicates the occupation has a higher share of employment than average, and a location quotient less than one indicates the occupation is less prevalent in the area than average.
Other OEWS estimates and related information:
May 2022 National Occupational Employment and Wage Estimates
May 2022 State Occupational Employment and Wage Estimates
May 2022 Metropolitan and Nonmetropolitan Area Occupational Employment and Wage Estimates
May 2022 National Industry-Specific Occupational Employment and Wage Estimates
Last Modified Date: April 25, 2023