
An official website of the United States government
An official website of the United States government
The .gov means it's official.
Federal government websites often end in .gov or .mil. Before sharing sensitive information,
make sure you're on a federal government site.
The site is secure.
The
https:// ensures that you are connecting to the official website and that any
information you provide is encrypted and transmitted securely.
Plan, direct, or coordinate the training and development activities and staff of an organization.
Employment estimate and mean wage estimates for Training and Development Managers:
| Employment (1) | Employment RSE (3) |
Mean hourly wage |
Mean annual wage (2) |
Wage RSE (3) |
|---|---|---|---|---|
| 41,540 | 2.4 % | $ 66.56 | $ 138,450 | 0.4 % |
Percentile wage estimates for Training and Development Managers:
| Percentile | 10% | 25% | 50% (Median) |
75% | 90% |
|---|---|---|---|---|---|
| Hourly Wage | $ 35.29 | $ 45.31 | $ 60.12 | $ 80.19 | $ 105.80 |
| Annual Wage (2) | $ 73,410 | $ 94,240 | $ 125,040 | $ 166,780 | $ 220,060 |
Industries with the highest published employment and wages for Training and Development Managers are provided. For a list of all industries with employment in Training and Development Managers, see the Create Customized Tables function.
Industries with the highest levels of employment in Training and Development Managers:
| Industry | Employment (1) | Percent of industry employment | Hourly mean wage | Annual mean wage (2) |
|---|---|---|---|---|
| Management of Companies and Enterprises | 6,230 | 0.22 | $ 70.17 | $ 145,950 |
| Colleges, Universities, and Professional Schools | 1,610 | 0.05 | $ 59.40 | $ 123,550 |
| General Medical and Surgical Hospitals | 1,520 | 0.03 | $ 69.70 | $ 144,980 |
| Computer Systems Design and Related Services | 1,480 | 0.06 | $ 73.02 | $ 151,880 |
| Management, Scientific, and Technical Consulting Services | 1,480 | 0.08 | $ 70.57 | $ 146,790 |
Industries with the highest concentration of employment in Training and Development Managers:
| Industry | Employment (1) | Percent of industry employment | Hourly mean wage | Annual mean wage (2) |
|---|---|---|---|---|
| Business Schools and Computer and Management Training | 860 | 1.03 | $ 62.56 | $ 130,110 |
| Lessors of Nonfinancial Intangible Assets (except Copyrighted Works) | 140 | 0.64 | $ 53.31 | $ 110,890 |
| Technical and Trade Schools | 440 | 0.30 | $ 55.79 | $ 116,050 |
| Business, Professional, Labor, Political, and Similar Organizations | 1,020 | 0.24 | $ 68.44 | $ 142,360 |
| Management of Companies and Enterprises | 6,230 | 0.22 | $ 70.17 | $ 145,950 |
Top paying industries for Training and Development Managers:
| Industry | Employment (1) | Percent of industry employment | Hourly mean wage | Annual mean wage (2) |
|---|---|---|---|---|
| Media Streaming Distribution Services, Social Networks, and Other Media Networks and Content Providers | 210 | 0.09 | $ 104.30 | $ 216,940 |
| Web Search Portals, Libraries, Archives, and Other Information Services | 120 | 0.06 | $ 104.26 | $ 216,870 |
| Legal Services | 450 | 0.04 | $ 93.00 | $ 193,440 |
| Merchant Wholesalers, Nondurable Goods (4242 and 4246 only) | 460 | 0.12 | $ 88.34 | $ 183,750 |
| Scientific Research and Development Services | 910 | 0.10 | $ 88.05 | $ 183,150 |
States and areas with the highest published employment, location quotients, and wages for Training and Development Managers are provided. For a list of all areas with employment in Training and Development Managers, see the Create Customized Tables function.
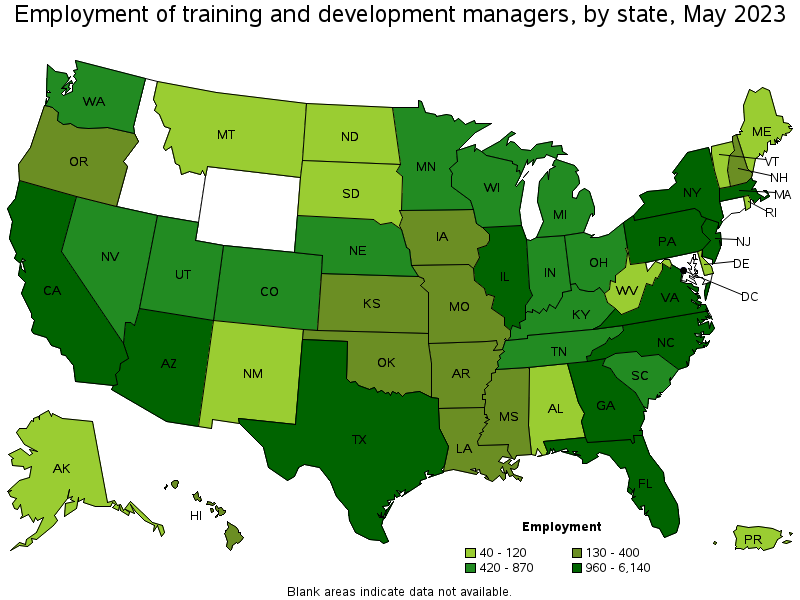
States with the highest employment level in Training and Development Managers:
| State | Employment (1) | Employment per thousand jobs | Location quotient (9) | Hourly mean wage | Annual mean wage (2) |
|---|---|---|---|---|---|
| California | 6,140 | 0.34 | 1.25 | $ 80.83 | $ 168,130 |
| Texas | 5,600 | 0.41 | 1.51 | $ 60.83 | $ 126,530 |
| New York | 2,730 | 0.29 | 1.06 | $ 86.16 | $ 179,210 |
| Florida | 2,490 | 0.26 | 0.95 | $ 58.21 | $ 121,070 |
| North Carolina | 1,770 | 0.37 | 1.35 | $ 61.62 | $ 128,170 |
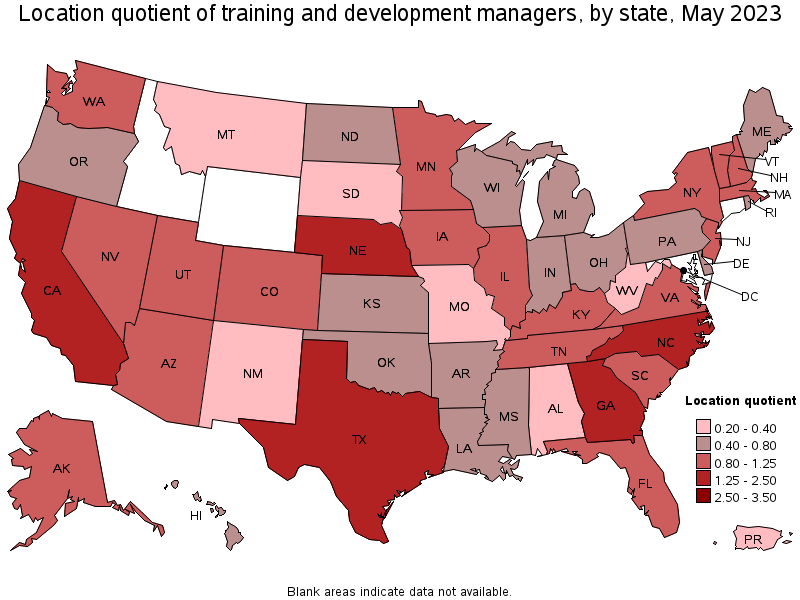
States with the highest concentration of jobs and location quotients in Training and Development Managers:
| State | Employment (1) | Employment per thousand jobs | Location quotient (9) | Hourly mean wage | Annual mean wage (2) |
|---|---|---|---|---|---|
| Nebraska | 420 | 0.42 | 1.53 | $ 55.72 | $ 115,900 |
| Texas | 5,600 | 0.41 | 1.51 | $ 60.83 | $ 126,530 |
| North Carolina | 1,770 | 0.37 | 1.35 | $ 61.62 | $ 128,170 |
| Georgia | 1,640 | 0.34 | 1.26 | $ 63.62 | $ 132,330 |
| California | 6,140 | 0.34 | 1.25 | $ 80.83 | $ 168,130 |
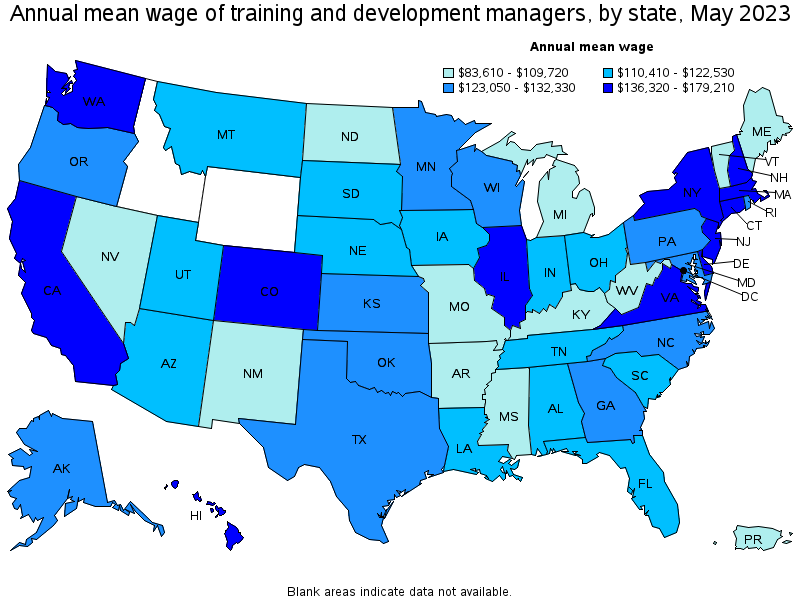
Top paying states for Training and Development Managers:
| State | Employment (1) | Employment per thousand jobs | Location quotient (9) | Hourly mean wage | Annual mean wage (2) |
|---|---|---|---|---|---|
| New York | 2,730 | 0.29 | 1.06 | $ 86.16 | $ 179,210 |
| California | 6,140 | 0.34 | 1.25 | $ 80.83 | $ 168,130 |
| New Jersey | 1,320 | 0.31 | 1.15 | $ 78.76 | $ 163,820 |
| District of Columbia | 160 | 0.23 | 0.82 | $ 78.28 | $ 162,820 |
| Massachusetts | 1,100 | 0.30 | 1.10 | $ 76.30 | $ 158,710 |
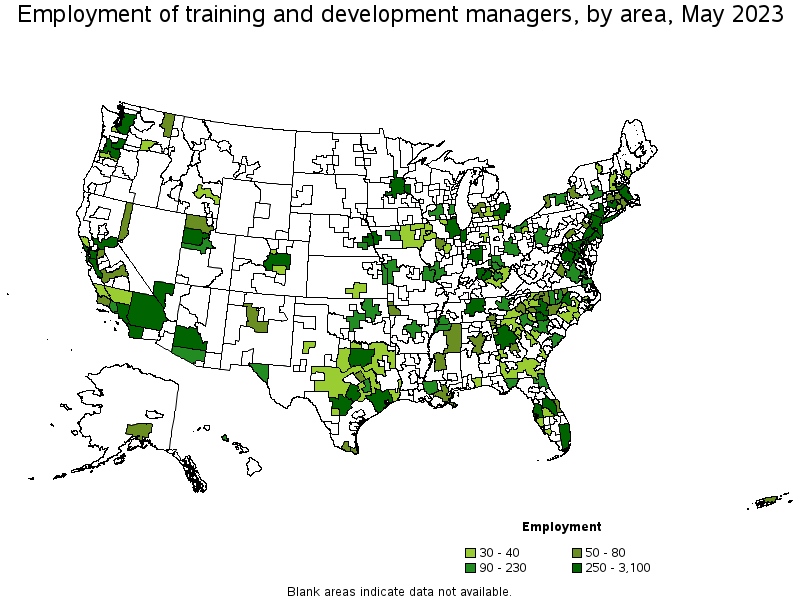
Metropolitan areas with the highest employment level in Training and Development Managers:
| Metropolitan area | Employment (1) | Employment per thousand jobs | Location quotient (9) | Hourly mean wage | Annual mean wage (2) |
|---|---|---|---|---|---|
| New York-Newark-Jersey City, NY-NJ-PA | 3,100 | 0.33 | 1.19 | $ 88.52 | $ 184,120 |
| Los Angeles-Long Beach-Anaheim, CA | 1,880 | 0.30 | 1.11 | $ 73.10 | $ 152,060 |
| Dallas-Fort Worth-Arlington, TX | 1,870 | 0.47 | 1.72 | $ 64.11 | $ 133,360 |
| Houston-The Woodlands-Sugar Land, TX | 1,380 | 0.43 | 1.59 | $ 63.65 | $ 132,400 |
| San Francisco-Oakland-Hayward, CA | 1,310 | 0.54 | 1.98 | $ 90.77 | $ 188,790 |
| Chicago-Naperville-Elgin, IL-IN-WI | 1,220 | 0.27 | 0.99 | $ 71.07 | $ 147,820 |
| Atlanta-Sandy Springs-Roswell, GA | 1,160 | 0.41 | 1.50 | $ 67.70 | $ 140,810 |
| Washington-Arlington-Alexandria, DC-VA-MD-WV | 1,150 | 0.37 | 1.36 | $ 74.08 | $ 154,090 |
| Boston-Cambridge-Nashua, MA-NH | 970 | 0.35 | 1.29 | $ 78.06 | $ 162,370 |
| San Jose-Sunnyvale-Santa Clara, CA | 780 | 0.69 | 2.51 | $ 110.10 | $ 229,000 |
Metropolitan areas with the highest concentration of jobs and location quotients in Training and Development Managers:
| Metropolitan area | Employment (1) | Employment per thousand jobs | Location quotient (9) | Hourly mean wage | Annual mean wage (2) |
|---|---|---|---|---|---|
| College Station-Bryan, TX | 130 | 0.98 | 3.58 | $ 49.31 | $ 102,560 |
| Macon, GA | 70 | 0.72 | 2.62 | $ 40.57 | $ 84,390 |
| Durham-Chapel Hill, NC | 230 | 0.70 | 2.56 | $ 66.70 | $ 138,740 |
| San Jose-Sunnyvale-Santa Clara, CA | 780 | 0.69 | 2.51 | $ 110.10 | $ 229,000 |
| Tallahassee, FL | 110 | 0.59 | 2.17 | $ 39.84 | $ 82,870 |
| Baltimore-Columbia-Towson, MD | 770 | 0.59 | 2.16 | $ 57.18 | $ 118,940 |
| Lincoln, NE | 100 | 0.55 | 2.01 | $ 46.09 | $ 95,870 |
| Austin-Round Rock, TX | 670 | 0.54 | 1.99 | $ 65.71 | $ 136,680 |
| San Francisco-Oakland-Hayward, CA | 1,310 | 0.54 | 1.98 | $ 90.77 | $ 188,790 |
| Omaha-Council Bluffs, NE-IA | 250 | 0.52 | 1.89 | $ 58.30 | $ 121,270 |
Top paying metropolitan areas for Training and Development Managers:
| Metropolitan area | Employment (1) | Employment per thousand jobs | Location quotient (9) | Hourly mean wage | Annual mean wage (2) |
|---|---|---|---|---|---|
| San Jose-Sunnyvale-Santa Clara, CA | 780 | 0.69 | 2.51 | $ 110.10 | $ 229,000 |
| San Francisco-Oakland-Hayward, CA | 1,310 | 0.54 | 1.98 | $ 90.77 | $ 188,790 |
| New York-Newark-Jersey City, NY-NJ-PA | 3,100 | 0.33 | 1.19 | $ 88.52 | $ 184,120 |
| Santa Maria-Santa Barbara, CA | 60 | 0.31 | 1.14 | $ 81.14 | $ 168,770 |
| Bridgeport-Stamford-Norwalk, CT | (8) | (8) | (8) | $ 79.75 | $ 165,880 |
| Seattle-Tacoma-Bellevue, WA | 640 | 0.31 | 1.13 | $ 79.43 | $ 165,220 |
| Boston-Cambridge-Nashua, MA-NH | 970 | 0.35 | 1.29 | $ 78.06 | $ 162,370 |
| San Diego-Carlsbad, CA | 630 | 0.41 | 1.50 | $ 77.65 | $ 161,520 |
| San Luis Obispo-Paso Robles-Arroyo Grande, CA | 30 | 0.29 | 1.04 | $ 76.30 | $ 158,710 |
| Trenton, NJ | 120 | 0.51 | 1.86 | $ 75.66 | $ 157,380 |
Nonmetropolitan areas with the highest employment in Training and Development Managers:
| Nonmetropolitan area | Employment (1) | Employment per thousand jobs | Location quotient (9) | Hourly mean wage | Annual mean wage (2) |
|---|---|---|---|---|---|
| Piedmont North Carolina nonmetropolitan area | 50 | 0.20 | 0.73 | $ 45.12 | $ 93,850 |
| Northeast Mississippi nonmetropolitan area | 50 | 0.23 | 0.82 | $ 50.31 | $ 104,650 |
| South Georgia nonmetropolitan area | 40 | 0.23 | 0.83 | $ 41.51 | $ 86,350 |
| Southeast Coastal North Carolina nonmetropolitan area | 40 | 0.16 | 0.59 | $ 52.92 | $ 110,060 |
| Southeast Iowa nonmetropolitan area | 40 | 0.18 | 0.65 | $ 47.44 | $ 98,680 |
Nonmetropolitan areas with the highest concentration of jobs and location quotients in Training and Development Managers:
| Nonmetropolitan area | Employment (1) | Employment per thousand jobs | Location quotient (9) | Hourly mean wage | Annual mean wage (2) |
|---|---|---|---|---|---|
| West Central-Southwest New Hampshire nonmetropolitan area | 40 | 0.37 | 1.36 | $ 68.80 | $ 143,110 |
| Mountain North Carolina nonmetropolitan area | 30 | 0.25 | 0.90 | $ 44.37 | $ 92,290 |
| South Georgia nonmetropolitan area | 40 | 0.23 | 0.83 | $ 41.51 | $ 86,350 |
| Northeast Mississippi nonmetropolitan area | 50 | 0.23 | 0.82 | $ 50.31 | $ 104,650 |
| Piedmont North Carolina nonmetropolitan area | 50 | 0.20 | 0.73 | $ 45.12 | $ 93,850 |
Top paying nonmetropolitan areas for Training and Development Managers:
| Nonmetropolitan area | Employment (1) | Employment per thousand jobs | Location quotient (9) | Hourly mean wage | Annual mean wage (2) |
|---|---|---|---|---|---|
| West Central-Southwest New Hampshire nonmetropolitan area | 40 | 0.37 | 1.36 | $ 68.80 | $ 143,110 |
| North Georgia nonmetropolitan area | 30 | 0.18 | 0.66 | $ 58.16 | $ 120,960 |
| Southeast Coastal North Carolina nonmetropolitan area | 40 | 0.16 | 0.59 | $ 52.92 | $ 110,060 |
| Northeast Mississippi nonmetropolitan area | 50 | 0.23 | 0.82 | $ 50.31 | $ 104,650 |
| Central Kentucky nonmetropolitan area | 30 | 0.18 | 0.66 | $ 48.99 | $ 101,900 |
These estimates are calculated with data collected from employers in all industry sectors, all metropolitan and nonmetropolitan areas, and all states and the District of Columbia. The top employment and wage figures are provided above. The complete list is available in the downloadable XLS files.
The percentile wage estimate is the value of a wage below which a certain percent of workers fall. The median wage is the 50th percentile wage estimate—50 percent of workers earn less than the median and 50 percent of workers earn more than the median. More about percentile wages.
(1) Estimates for detailed occupations do not sum to the totals because the totals include occupations not shown separately. Estimates do not include self-employed workers.
(2) Annual wages have been calculated by multiplying the hourly mean wage by a "year-round, full-time" hours figure of 2,080 hours; for those occupations where there is not an hourly wage published, the annual wage has been directly calculated from the reported survey data.
(3) The relative standard error (RSE) is a measure of the reliability of a survey statistic. The smaller the relative standard error, the more precise the estimate.
(8) Estimate not released.
(9) The location quotient is the ratio of the area concentration of occupational employment to the national average concentration. A location quotient greater than one indicates the occupation has a higher share of employment than average, and a location quotient less than one indicates the occupation is less prevalent in the area than average.
Other OEWS estimates and related information:
May 2023 National Occupational Employment and Wage Estimates
May 2023 State Occupational Employment and Wage Estimates
May 2023 Metropolitan and Nonmetropolitan Area Occupational Employment and Wage Estimates
May 2023 National Industry-Specific Occupational Employment and Wage Estimates
Last Modified Date: April 3, 2024