
An official website of the United States government
An official website of the United States government
The .gov means it's official.
Federal government websites often end in .gov or .mil. Before sharing sensitive information,
make sure you're on a federal government site.
The site is secure.
The
https:// ensures that you are connecting to the official website and that any
information you provide is encrypted and transmitted securely.
Apply engineering theory and principles to problems of industrial layout or manufacturing production, usually under the direction of engineering staff. May perform time and motion studies on worker operations in a variety of industries for purposes such as establishing standard production rates or improving efficiency.
Employment estimate and mean wage estimates for Industrial Engineering Technologists and Technicians:
| Employment (1) | Employment RSE (3) |
Mean hourly wage |
Mean annual wage (2) |
Wage RSE (3) |
|---|---|---|---|---|
| 73,020 | 1.0 % | $ 32.04 | $ 66,640 | 0.6 % |
Percentile wage estimates for Industrial Engineering Technologists and Technicians:
| Percentile | 10% | 25% | 50% (Median) |
75% | 90% |
|---|---|---|---|---|---|
| Hourly Wage | $ 21.61 | $ 24.36 | $ 30.10 | $ 37.21 | $ 45.45 |
| Annual Wage (2) | $ 44,950 | $ 50,680 | $ 62,610 | $ 77,390 | $ 94,540 |
Industries with the highest published employment and wages for Industrial Engineering Technologists and Technicians are provided. For a list of all industries with employment in Industrial Engineering Technologists and Technicians, see the Create Customized Tables function.
Industries with the highest levels of employment in Industrial Engineering Technologists and Technicians:
| Industry | Employment (1) | Percent of industry employment | Hourly mean wage | Annual mean wage (2) |
|---|---|---|---|---|
| Semiconductor and Other Electronic Component Manufacturing | 8,380 | 2.14 | $ 31.57 | $ 65,660 |
| Architectural, Engineering, and Related Services | 4,730 | 0.29 | $ 32.92 | $ 68,470 |
| Motor Vehicle Parts Manufacturing | 4,240 | 0.76 | $ 28.38 | $ 59,020 |
| Machinery Manufacturing (3331, 3332, 3334, and 3339 only) | 3,730 | 0.48 | $ 29.85 | $ 62,080 |
| Plastics Product Manufacturing | 3,460 | 0.57 | $ 29.19 | $ 60,720 |
Industries with the highest concentration of employment in Industrial Engineering Technologists and Technicians:
| Industry | Employment (1) | Percent of industry employment | Hourly mean wage | Annual mean wage (2) |
|---|---|---|---|---|
| Semiconductor and Other Electronic Component Manufacturing | 8,380 | 2.14 | $ 31.57 | $ 65,660 |
| Engine, Turbine, and Power Transmission Equipment Manufacturing | 1,570 | 1.70 | $ 32.96 | $ 68,550 |
| Medical Equipment and Supplies Manufacturing | 3,180 | 0.94 | $ 29.48 | $ 61,310 |
| Navigational, Measuring, Electromedical, and Control Instruments Manufacturing | 3,430 | 0.81 | $ 31.35 | $ 65,210 |
| Motor Vehicle Parts Manufacturing | 4,240 | 0.76 | $ 28.38 | $ 59,020 |
Top paying industries for Industrial Engineering Technologists and Technicians:
| Industry | Employment (1) | Percent of industry employment | Hourly mean wage | Annual mean wage (2) |
|---|---|---|---|---|
| Petroleum and Coal Products Manufacturing | 190 | 0.18 | $ 60.32 | $ 125,470 |
| Oil and Gas Extraction | 250 | 0.23 | $ 52.40 | $ 108,990 |
| Electric Power Generation, Transmission and Distribution | 120 | 0.03 | $ 51.79 | $ 107,720 |
| Pipeline Transportation of Natural Gas | 80 | 0.25 | $ 47.40 | $ 98,590 |
| Natural Gas Distribution | 340 | 0.30 | $ 45.28 | $ 94,190 |
States and areas with the highest published employment, location quotients, and wages for Industrial Engineering Technologists and Technicians are provided. For a list of all areas with employment in Industrial Engineering Technologists and Technicians, see the Create Customized Tables function.
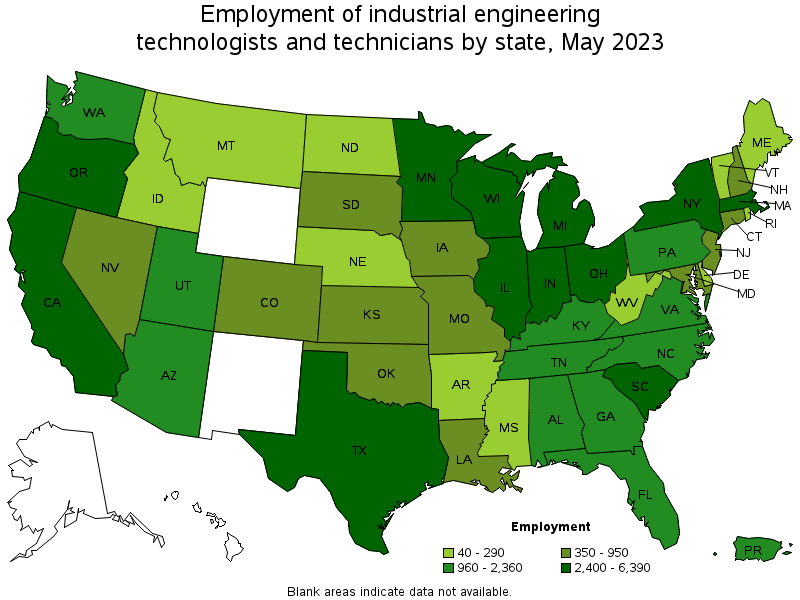
States with the highest employment level in Industrial Engineering Technologists and Technicians:
| State | Employment (1) | Employment per thousand jobs | Location quotient (9) | Hourly mean wage | Annual mean wage (2) |
|---|---|---|---|---|---|
| Michigan | 6,390 | 1.47 | 3.06 | $ 29.97 | $ 62,350 |
| Ohio | 5,700 | 1.04 | 2.17 | $ 29.58 | $ 61,520 |
| Texas | 5,210 | 0.38 | 0.80 | $ 36.07 | $ 75,030 |
| Minnesota | 4,830 | 1.68 | 3.48 | $ 33.27 | $ 69,200 |
| California | 4,210 | 0.23 | 0.49 | $ 37.29 | $ 77,560 |
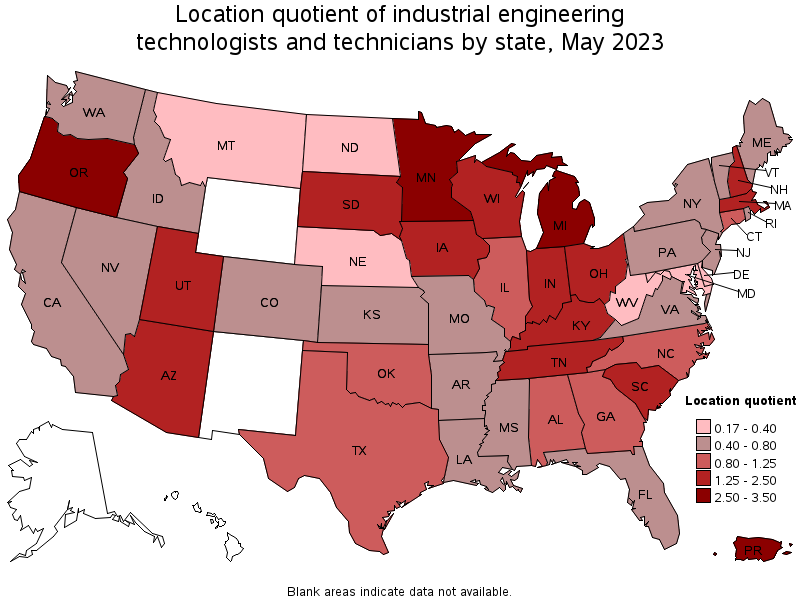
States with the highest concentration of jobs and location quotients in Industrial Engineering Technologists and Technicians:
| State | Employment (1) | Employment per thousand jobs | Location quotient (9) | Hourly mean wage | Annual mean wage (2) |
|---|---|---|---|---|---|
| Minnesota | 4,830 | 1.68 | 3.48 | $ 33.27 | $ 69,200 |
| Michigan | 6,390 | 1.47 | 3.06 | $ 29.97 | $ 62,350 |
| Oregon | 2,440 | 1.25 | 2.61 | $ 31.63 | $ 65,790 |
| South Carolina | 2,420 | 1.09 | 2.26 | $ 31.93 | $ 66,420 |
| Ohio | 5,700 | 1.04 | 2.17 | $ 29.58 | $ 61,520 |
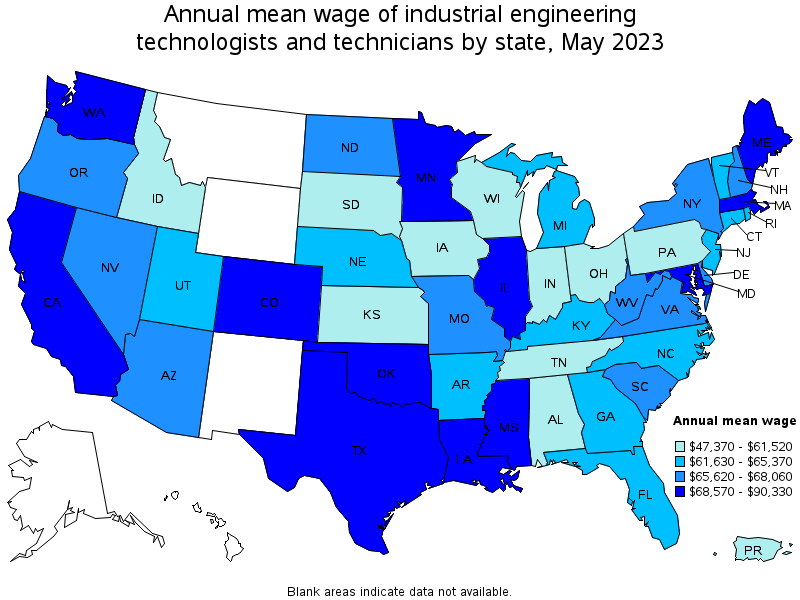
Top paying states for Industrial Engineering Technologists and Technicians:
| State | Employment (1) | Employment per thousand jobs | Location quotient (9) | Hourly mean wage | Annual mean wage (2) |
|---|---|---|---|---|---|
| Louisiana | 440 | 0.24 | 0.50 | $ 43.43 | $ 90,330 |
| Washington | 1,040 | 0.30 | 0.62 | $ 40.26 | $ 83,740 |
| Maryland | 470 | 0.18 | 0.37 | $ 38.28 | $ 79,620 |
| California | 4,210 | 0.23 | 0.49 | $ 37.29 | $ 77,560 |
| Texas | 5,210 | 0.38 | 0.80 | $ 36.07 | $ 75,030 |
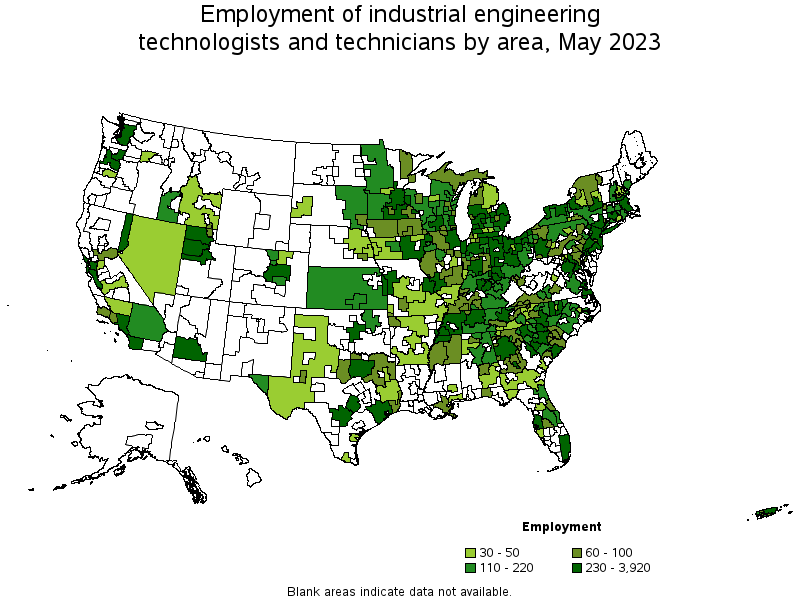
Metropolitan areas with the highest employment level in Industrial Engineering Technologists and Technicians:
| Metropolitan area | Employment (1) | Employment per thousand jobs | Location quotient (9) | Hourly mean wage | Annual mean wage (2) |
|---|---|---|---|---|---|
| Minneapolis-St. Paul-Bloomington, MN-WI | 3,920 | 2.05 | 4.27 | $ 34.09 | $ 70,910 |
| Detroit-Warren-Dearborn, MI | 3,080 | 1.62 | 3.37 | $ 31.24 | $ 64,970 |
| Portland-Vancouver-Hillsboro, OR-WA | 2,380 | 1.98 | 4.11 | $ 31.62 | $ 65,770 |
| Boston-Cambridge-Nashua, MA-NH | 2,170 | 0.79 | 1.64 | $ 34.07 | $ 70,870 |
| Chicago-Naperville-Elgin, IL-IN-WI | 1,790 | 0.40 | 0.83 | $ 33.30 | $ 69,270 |
| Phoenix-Mesa-Scottsdale, AZ | 1,720 | 0.75 | 1.56 | $ 33.46 | $ 69,590 |
| Houston-The Woodlands-Sugar Land, TX | 1,560 | 0.49 | 1.02 | $ 40.46 | $ 84,160 |
| Los Angeles-Long Beach-Anaheim, CA | 1,400 | 0.23 | 0.47 | $ 38.16 | $ 79,370 |
| Dallas-Fort Worth-Arlington, TX | 1,370 | 0.34 | 0.72 | $ 31.89 | $ 66,330 |
| New York-Newark-Jersey City, NY-NJ-PA | 1,280 | 0.13 | 0.28 | $ 32.42 | $ 67,440 |
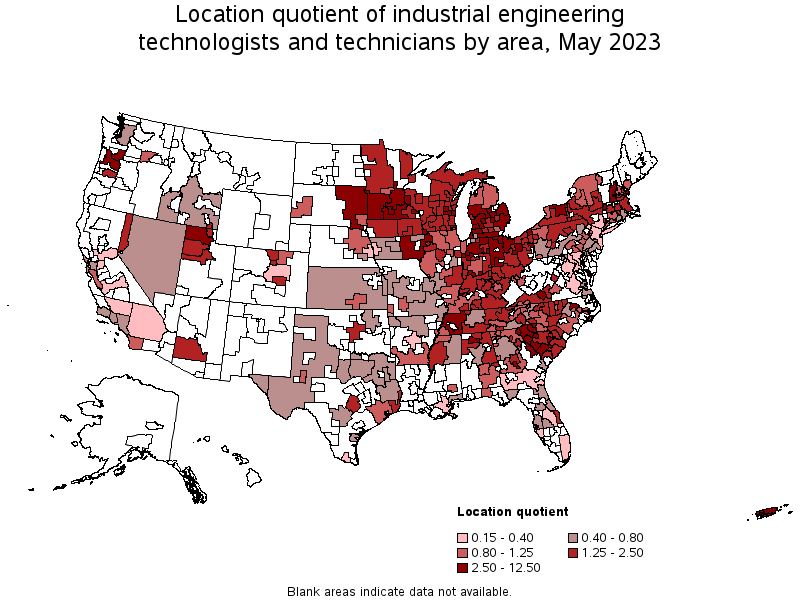
Metropolitan areas with the highest concentration of jobs and location quotients in Industrial Engineering Technologists and Technicians:
| Metropolitan area | Employment (1) | Employment per thousand jobs | Location quotient (9) | Hourly mean wage | Annual mean wage (2) |
|---|---|---|---|---|---|
| Columbus, IN | 300 | 6.01 | 12.50 | $ 31.22 | $ 64,930 |
| Warner Robins, GA | 290 | 3.77 | 7.84 | $ 36.10 | $ 75,090 |
| Saginaw, MI | 280 | 3.57 | 7.42 | $ 24.26 | $ 50,460 |
| Kalamazoo-Portage, MI | 490 | 3.53 | 7.35 | $ 28.33 | $ 58,930 |
| Rocky Mount, NC | 140 | 2.67 | 5.55 | $ 33.91 | $ 70,530 |
| Fond du Lac, WI | 110 | 2.38 | 4.95 | $ 33.76 | $ 70,220 |
| Sumter, SC | 70 | 2.11 | 4.38 | $ 31.43 | $ 65,380 |
| Bloomington, IN | 150 | 2.07 | 4.31 | $ 29.00 | $ 60,310 |
| Minneapolis-St. Paul-Bloomington, MN-WI | 3,920 | 2.05 | 4.27 | $ 34.09 | $ 70,910 |
| Grand Rapids-Wyoming, MI | 1,100 | 2.05 | 4.26 | $ 29.41 | $ 61,170 |
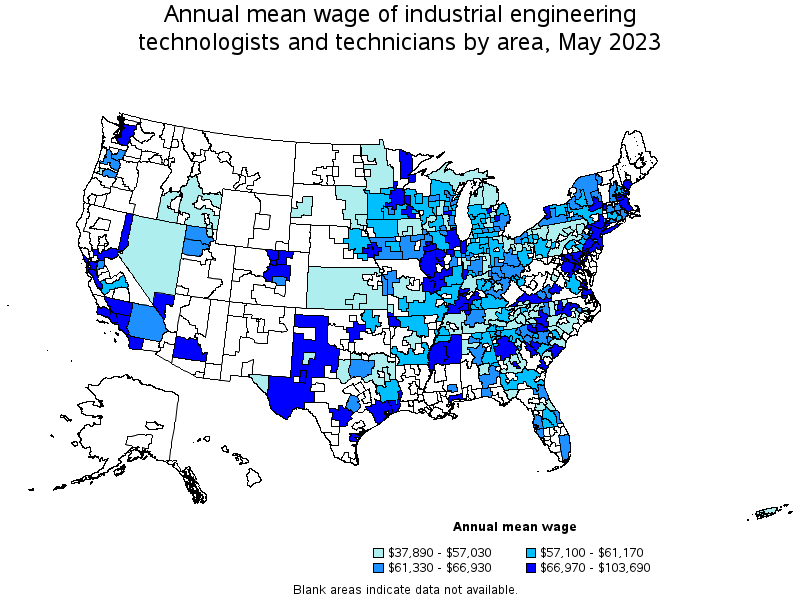
Top paying metropolitan areas for Industrial Engineering Technologists and Technicians:
| Metropolitan area | Employment (1) | Employment per thousand jobs | Location quotient (9) | Hourly mean wage | Annual mean wage (2) |
|---|---|---|---|---|---|
| Beaumont-Port Arthur, TX | 100 | 0.66 | 1.37 | $ 49.85 | $ 103,690 |
| Midland, TX | 60 | 0.52 | 1.07 | $ 46.96 | $ 97,670 |
| Fayetteville-Springdale-Rogers, AR-MO | 80 | 0.30 | 0.63 | $ 44.81 | $ 93,200 |
| Seattle-Tacoma-Bellevue, WA | 690 | 0.33 | 0.69 | $ 44.63 | $ 92,840 |
| Albany-Schenectady-Troy, NY | 380 | 0.87 | 1.81 | $ 40.69 | $ 84,640 |
| Houston-The Woodlands-Sugar Land, TX | 1,560 | 0.49 | 1.02 | $ 40.46 | $ 84,160 |
| Bakersfield, CA | 40 | 0.13 | 0.27 | $ 40.33 | $ 83,880 |
| San Jose-Sunnyvale-Santa Clara, CA | 620 | 0.54 | 1.12 | $ 40.16 | $ 83,520 |
| Santa Maria-Santa Barbara, CA | 70 | 0.36 | 0.75 | $ 39.30 | $ 81,750 |
| Peoria, IL | 180 | 1.08 | 2.24 | $ 39.20 | $ 81,530 |
Nonmetropolitan areas with the highest employment in Industrial Engineering Technologists and Technicians:
| Nonmetropolitan area | Employment (1) | Employment per thousand jobs | Location quotient (9) | Hourly mean wage | Annual mean wage (2) |
|---|---|---|---|---|---|
| West Northwestern Ohio nonmetropolitan area | 660 | 2.66 | 5.52 | $ 28.77 | $ 59,830 |
| North Northeastern Ohio nonmetropolitan area (noncontiguous) | 430 | 1.32 | 2.75 | $ 27.38 | $ 56,950 |
| Balance of Lower Peninsula of Michigan nonmetropolitan area | 400 | 1.51 | 3.15 | $ 28.98 | $ 60,280 |
| Northern Indiana nonmetropolitan area | 290 | 1.35 | 2.81 | $ 28.86 | $ 60,040 |
| Southeast Iowa nonmetropolitan area | 260 | 1.25 | 2.60 | $ 29.67 | $ 61,720 |
Nonmetropolitan areas with the highest concentration of jobs and location quotients in Industrial Engineering Technologists and Technicians:
| Nonmetropolitan area | Employment (1) | Employment per thousand jobs | Location quotient (9) | Hourly mean wage | Annual mean wage (2) |
|---|---|---|---|---|---|
| West Northwestern Ohio nonmetropolitan area | 660 | 2.66 | 5.52 | $ 28.77 | $ 59,830 |
| Lower Savannah South Carolina nonmetropolitan area | 140 | 2.61 | 5.43 | $ 27.58 | $ 57,360 |
| West Tennessee nonmetropolitan area | 260 | 1.97 | 4.11 | $ 24.51 | $ 50,970 |
| Upper Savannah South Carolina nonmetropolitan area | 130 | 1.61 | 3.34 | $ 30.13 | $ 62,660 |
| Southeast Minnesota nonmetropolitan area | 240 | 1.59 | 3.30 | $ 28.24 | $ 58,730 |
Top paying nonmetropolitan areas for Industrial Engineering Technologists and Technicians:
| Nonmetropolitan area | Employment (1) | Employment per thousand jobs | Location quotient (9) | Hourly mean wage | Annual mean wage (2) |
|---|---|---|---|---|---|
| West Texas Region of Texas nonmetropolitan area | 40 | 0.21 | 0.44 | $ 45.57 | $ 94,780 |
| Southwest Virginia nonmetropolitan area | 80 | 0.67 | 1.39 | $ 36.88 | $ 76,710 |
| Northwest Mississippi nonmetropolitan area | 60 | 0.70 | 1.47 | $ 35.03 | $ 72,870 |
| West Central Illinois nonmetropolitan area | 70 | 0.44 | 0.92 | $ 34.50 | $ 71,770 |
| Northeast Mississippi nonmetropolitan area | 80 | 0.36 | 0.74 | $ 32.75 | $ 68,120 |
These estimates are calculated with data collected from employers in all industry sectors, all metropolitan and nonmetropolitan areas, and all states and the District of Columbia. The top employment and wage figures are provided above. The complete list is available in the downloadable XLS files.
The percentile wage estimate is the value of a wage below which a certain percent of workers fall. The median wage is the 50th percentile wage estimate—50 percent of workers earn less than the median and 50 percent of workers earn more than the median. More about percentile wages.
(1) Estimates for detailed occupations do not sum to the totals because the totals include occupations not shown separately. Estimates do not include self-employed workers.
(2) Annual wages have been calculated by multiplying the hourly mean wage by a "year-round, full-time" hours figure of 2,080 hours; for those occupations where there is not an hourly wage published, the annual wage has been directly calculated from the reported survey data.
(3) The relative standard error (RSE) is a measure of the reliability of a survey statistic. The smaller the relative standard error, the more precise the estimate.
(9) The location quotient is the ratio of the area concentration of occupational employment to the national average concentration. A location quotient greater than one indicates the occupation has a higher share of employment than average, and a location quotient less than one indicates the occupation is less prevalent in the area than average.
Other OEWS estimates and related information:
May 2023 National Occupational Employment and Wage Estimates
May 2023 State Occupational Employment and Wage Estimates
May 2023 Metropolitan and Nonmetropolitan Area Occupational Employment and Wage Estimates
May 2023 National Industry-Specific Occupational Employment and Wage Estimates
Last Modified Date: April 3, 2024