
An official website of the United States government
An official website of the United States government
The .gov means it's official.
Federal government websites often end in .gov or .mil. Before sharing sensitive information,
make sure you're on a federal government site.
The site is secure.
The
https:// ensures that you are connecting to the official website and that any
information you provide is encrypted and transmitted securely.
Operate table games. Stand or sit behind table and operate games of chance by dispensing the appropriate number of cards or blocks to players, or operating other gambling equipment. Distribute winnings or collect players� money or chips. May compare the house�s hand against players� hands.
Employment estimate and mean wage estimates for Gambling Dealers:
| Employment (1) | Employment RSE (3) |
Mean hourly wage |
Mean annual wage (2) |
Wage RSE (3) |
|---|---|---|---|---|
| 80,570 | 1.1 % | $ 19.25 | $ 40,030 | 1.0 % |
Percentile wage estimates for Gambling Dealers:
| Percentile | 10% | 25% | 50% (Median) |
75% | 90% |
|---|---|---|---|---|---|
| Hourly Wage | $ 10.29 | $ 11.23 | $ 15.50 | $ 22.60 | $ 36.16 |
| Annual Wage (2) | $ 21,410 | $ 23,350 | $ 32,240 | $ 47,010 | $ 75,200 |
Industries with the highest published employment and wages for Gambling Dealers are provided. For a list of all industries with employment in Gambling Dealers, see the Create Customized Tables function.
Industries with the highest levels of employment in Gambling Dealers:
| Industry | Employment (1) | Percent of industry employment | Hourly mean wage | Annual mean wage (2) |
|---|---|---|---|---|
| Traveler Accommodation | 41,480 | 2.24 | $ 18.31 | $ 38,070 |
| Gambling Industries | 33,200 | 15.29 | $ 20.74 | $ 43,140 |
| Spectator Sports | 1,320 | 0.88 | $ 17.10 | $ 35,560 |
| Other Personal Services | 690 | 0.17 | (8) | (8) |
| Civic and Social Organizations | 360 | 0.11 | $ 16.33 | $ 33,970 |
Industries with the highest concentration of employment in Gambling Dealers:
| Industry | Employment (1) | Percent of industry employment | Hourly mean wage | Annual mean wage (2) |
|---|---|---|---|---|
| Gambling Industries | 33,200 | 15.29 | $ 20.74 | $ 43,140 |
| Traveler Accommodation | 41,480 | 2.24 | $ 18.31 | $ 38,070 |
| Spectator Sports | 1,320 | 0.88 | $ 17.10 | $ 35,560 |
| Other Personal Services | 690 | 0.17 | (8) | (8) |
| Promoters of Performing Arts, Sports, and Similar Events | 200 | 0.12 | $ 25.64 | $ 53,330 |
Top paying industries for Gambling Dealers:
| Industry | Employment (1) | Percent of industry employment | Hourly mean wage | Annual mean wage (2) |
|---|---|---|---|---|
| Promoters of Performing Arts, Sports, and Similar Events | 200 | 0.12 | $ 25.64 | $ 53,330 |
| Gambling Industries | 33,200 | 15.29 | $ 20.74 | $ 43,140 |
| Traveler Accommodation | 41,480 | 2.24 | $ 18.31 | $ 38,070 |
| Spectator Sports | 1,320 | 0.88 | $ 17.10 | $ 35,560 |
| Civic and Social Organizations | 360 | 0.11 | $ 16.33 | $ 33,970 |
States and areas with the highest published employment, location quotients, and wages for Gambling Dealers are provided. For a list of all areas with employment in Gambling Dealers, see the Create Customized Tables function.
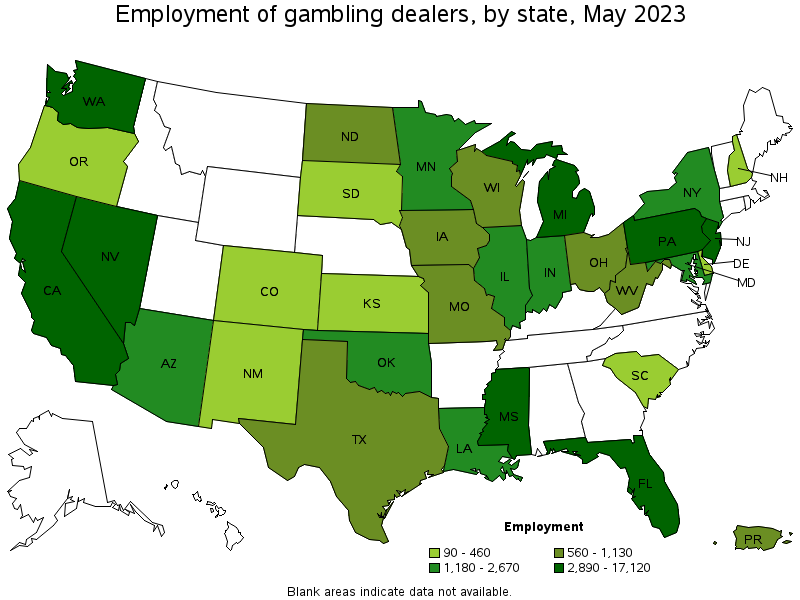
States with the highest employment level in Gambling Dealers:
| State | Employment (1) | Employment per thousand jobs | Location quotient (9) | Hourly mean wage | Annual mean wage (2) |
|---|---|---|---|---|---|
| Nevada | 17,120 | 11.55 | 21.77 | $ 14.16 | $ 29,450 |
| California | 15,910 | 0.89 | 1.67 | $ 20.62 | $ 42,880 |
| Washington | 4,030 | 1.15 | 2.17 | $ 29.47 | $ 61,290 |
| Florida | 3,970 | 0.41 | 0.78 | $ 20.97 | $ 43,620 |
| New Jersey | 3,490 | 0.83 | 1.56 | $ 22.17 | $ 46,120 |
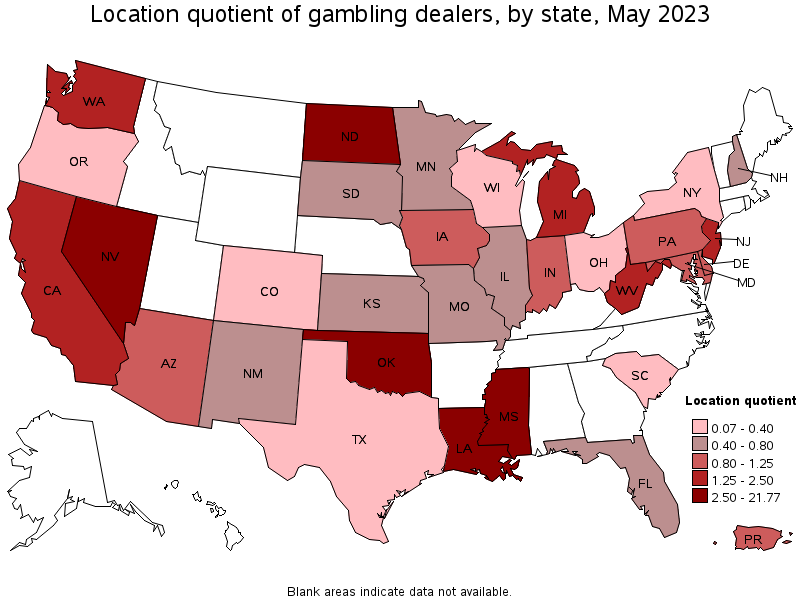
States with the highest concentration of jobs and location quotients in Gambling Dealers:
| State | Employment (1) | Employment per thousand jobs | Location quotient (9) | Hourly mean wage | Annual mean wage (2) |
|---|---|---|---|---|---|
| Nevada | 17,120 | 11.55 | 21.77 | $ 14.16 | $ 29,450 |
| North Dakota | 1,130 | 2.71 | 5.11 | $ 15.19 | $ 31,600 |
| Mississippi | 2,890 | 2.51 | 4.73 | $ 21.11 | $ 43,920 |
| Louisiana | 2,670 | 1.44 | 2.71 | $ 19.56 | $ 40,670 |
| Oklahoma | 2,350 | 1.41 | 2.66 | $ 11.50 | $ 23,920 |
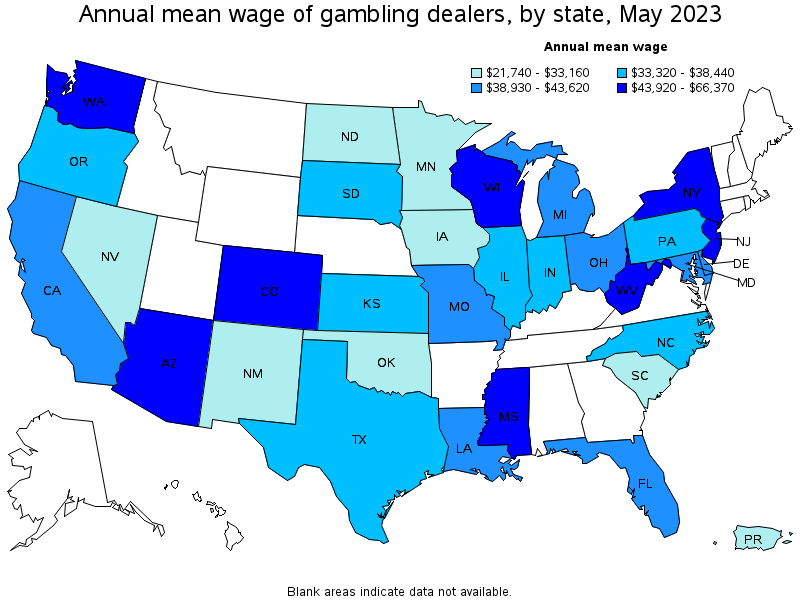
Top paying states for Gambling Dealers:
| State | Employment (1) | Employment per thousand jobs | Location quotient (9) | Hourly mean wage | Annual mean wage (2) |
|---|---|---|---|---|---|
| Arizona | 1,760 | 0.56 | 1.06 | $ 31.91 | $ 66,370 |
| Washington | 4,030 | 1.15 | 2.17 | $ 29.47 | $ 61,290 |
| New York | 1,660 | 0.18 | 0.33 | $ 26.96 | $ 56,080 |
| West Virginia | 630 | 0.91 | 1.72 | $ 26.78 | $ 55,700 |
| New Jersey | 3,490 | 0.83 | 1.56 | $ 22.17 | $ 46,120 |
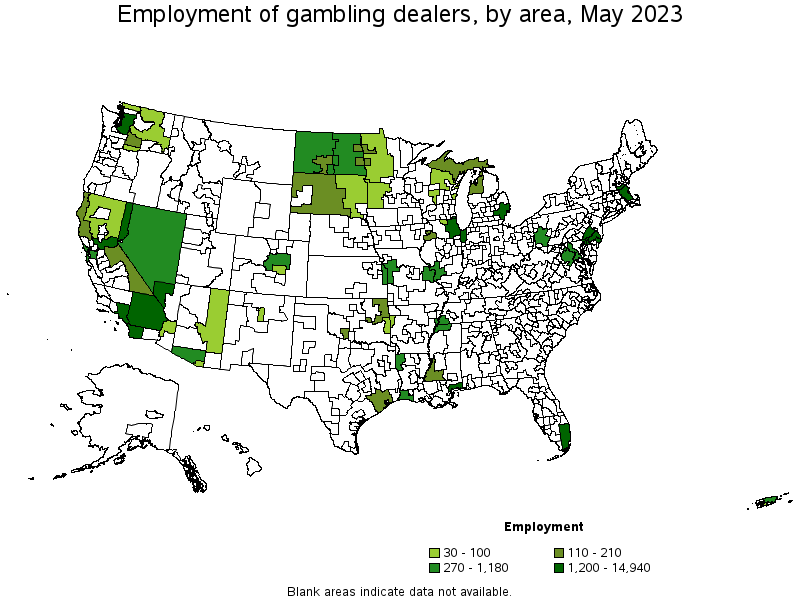
Metropolitan areas with the highest employment level in Gambling Dealers:
| Metropolitan area | Employment (1) | Employment per thousand jobs | Location quotient (9) | Hourly mean wage | Annual mean wage (2) |
|---|---|---|---|---|---|
| Las Vegas-Henderson-Paradise, NV | 14,940 | 13.79 | 25.99 | $ 14.61 | $ 30,390 |
| Los Angeles-Long Beach-Anaheim, CA | 3,990 | 0.64 | 1.22 | $ 18.88 | $ 39,270 |
| Atlantic City-Hammonton, NJ | 3,030 | 24.15 | 45.52 | $ 21.53 | $ 44,780 |
| Riverside-San Bernardino-Ontario, CA | 2,650 | 1.59 | 3.00 | $ 19.79 | $ 41,160 |
| Seattle-Tacoma-Bellevue, WA | 2,330 | 1.12 | 2.12 | $ 32.65 | $ 67,910 |
| Sacramento--Roseville--Arden-Arcade, CA | 2,130 | 2.03 | 3.83 | $ 19.80 | $ 41,190 |
| Miami-Fort Lauderdale-West Palm Beach, FL | 1,980 | 0.73 | 1.37 | $ 20.15 | $ 41,910 |
| Gulfport-Biloxi-Pascagoula, MS | 1,750 | 11.59 | 21.84 | $ 25.12 | $ 52,240 |
| San Diego-Carlsbad, CA | 1,660 | 1.09 | 2.06 | $ 20.77 | $ 43,190 |
| Philadelphia-Camden-Wilmington, PA-NJ-DE-MD | 1,580 | 0.56 | 1.05 | $ 18.41 | $ 38,290 |
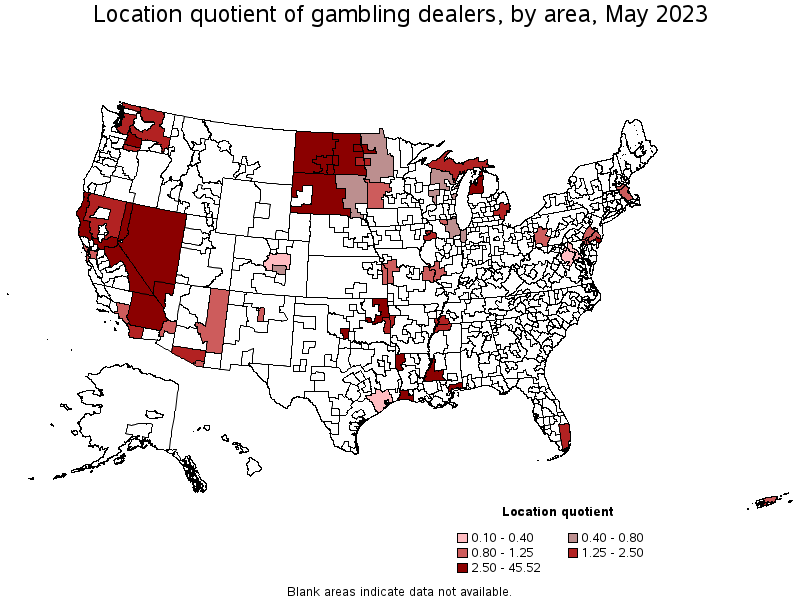
Metropolitan areas with the highest concentration of jobs and location quotients in Gambling Dealers:
| Metropolitan area | Employment (1) | Employment per thousand jobs | Location quotient (9) | Hourly mean wage | Annual mean wage (2) |
|---|---|---|---|---|---|
| Atlantic City-Hammonton, NJ | 3,030 | 24.15 | 45.52 | $ 21.53 | $ 44,780 |
| Las Vegas-Henderson-Paradise, NV | 14,940 | 13.79 | 25.99 | $ 14.61 | $ 30,390 |
| Gulfport-Biloxi-Pascagoula, MS | 1,750 | 11.59 | 21.84 | $ 25.12 | $ 52,240 |
| Lake Charles, LA | 820 | 8.96 | 16.89 | $ 16.85 | $ 35,050 |
| Reno, NV | 1,200 | 4.74 | 8.93 | $ 11.35 | $ 23,600 |
| Shreveport-Bossier City, LA | 550 | 3.25 | 6.12 | $ 22.05 | $ 45,860 |
| Bismarck, ND | 210 | 2.92 | 5.50 | $ 15.99 | $ 33,270 |
| Grand Forks, ND-MN | 140 | 2.69 | 5.07 | $ 15.29 | $ 31,790 |
| Lawton, OK | 110 | 2.49 | 4.69 | $ 15.04 | $ 31,290 |
| Sacramento--Roseville--Arden-Arcade, CA | 2,130 | 2.03 | 3.83 | $ 19.80 | $ 41,190 |
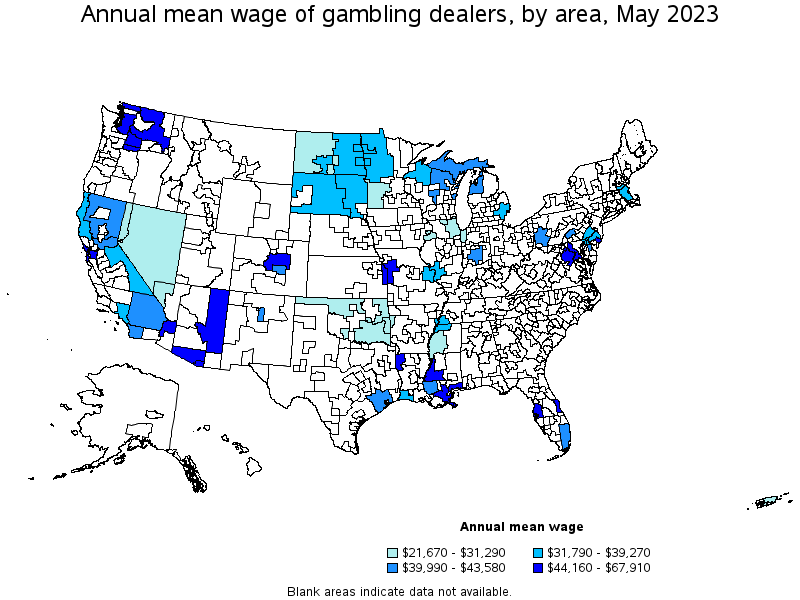
Top paying metropolitan areas for Gambling Dealers:
| Metropolitan area | Employment (1) | Employment per thousand jobs | Location quotient (9) | Hourly mean wage | Annual mean wage (2) |
|---|---|---|---|---|---|
| Seattle-Tacoma-Bellevue, WA | 2,330 | 1.12 | 2.12 | $ 32.65 | $ 67,910 |
| Tucson, AZ | 320 | 0.83 | 1.57 | $ 28.62 | $ 59,520 |
| Bellingham, WA | 100 | 1.06 | 2.00 | $ 27.09 | $ 56,360 |
| Washington-Arlington-Alexandria, DC-VA-MD-WV | 590 | 0.19 | 0.36 | $ 26.78 | $ 55,710 |
| Gulfport-Biloxi-Pascagoula, MS | 1,750 | 11.59 | 21.84 | $ 25.12 | $ 52,240 |
| Tampa-St. Petersburg-Clearwater, FL | (8) | (8) | (8) | $ 24.05 | $ 50,020 |
| Kansas City, MO-KS | 520 | 0.49 | 0.92 | $ 23.98 | $ 49,880 |
| Denver-Aurora-Lakewood, CO | 330 | 0.21 | 0.39 | $ 22.21 | $ 46,190 |
| Shreveport-Bossier City, LA | 550 | 3.25 | 6.12 | $ 22.05 | $ 45,860 |
| San Francisco-Oakland-Hayward, CA | 1,180 | 0.49 | 0.92 | $ 21.76 | $ 45,270 |
Nonmetropolitan areas with the highest employment in Gambling Dealers:
| Nonmetropolitan area | Employment (1) | Employment per thousand jobs | Location quotient (9) | Hourly mean wage | Annual mean wage (2) |
|---|---|---|---|---|---|
| Nevada nonmetropolitan area | 900 | 8.97 | 16.91 | $ 10.63 | $ 22,110 |
| West North Dakota nonmetropolitan area | 330 | 2.93 | 5.52 | $ 13.70 | $ 28,500 |
| East North Dakota nonmetropolitan area | 270 | 4.38 | 8.26 | $ 15.32 | $ 31,860 |
| Northwest Lower Peninsula of Michigan nonmetropolitan area | 210 | 1.70 | 3.20 | $ 19.97 | $ 41,540 |
| Northeast Oklahoma nonmetropolitan area | 190 | 1.59 | 3.00 | $ 12.84 | $ 26,700 |
Nonmetropolitan areas with the highest concentration of jobs and location quotients in Gambling Dealers:
| Nonmetropolitan area | Employment (1) | Employment per thousand jobs | Location quotient (9) | Hourly mean wage | Annual mean wage (2) |
|---|---|---|---|---|---|
| Nevada nonmetropolitan area | 900 | 8.97 | 16.91 | $ 10.63 | $ 22,110 |
| East North Dakota nonmetropolitan area | 270 | 4.38 | 8.26 | $ 15.32 | $ 31,860 |
| Eastern Sierra-Mother Lode Region of California nonmetropolitan area | 180 | 2.96 | 5.58 | $ 18.00 | $ 37,430 |
| West North Dakota nonmetropolitan area | 330 | 2.93 | 5.52 | $ 13.70 | $ 28,500 |
| Southwest Mississippi nonmetropolitan area | 170 | 2.44 | 4.59 | $ 21.67 | $ 45,080 |
Top paying nonmetropolitan areas for Gambling Dealers:
| Nonmetropolitan area | Employment (1) | Employment per thousand jobs | Location quotient (9) | Hourly mean wage | Annual mean wage (2) |
|---|---|---|---|---|---|
| Eastern Washington nonmetropolitan area | 100 | 0.99 | 1.86 | $ 29.24 | $ 60,810 |
| Arizona nonmetropolitan area | 50 | 0.56 | 1.06 | $ 24.38 | $ 50,700 |
| Southwest Mississippi nonmetropolitan area | 170 | 2.44 | 4.59 | $ 21.67 | $ 45,080 |
| Northeastern Wisconsin nonmetropolitan area | 80 | 0.39 | 0.74 | $ 20.93 | $ 43,530 |
| Northwest Lower Peninsula of Michigan nonmetropolitan area | 210 | 1.70 | 3.20 | $ 19.97 | $ 41,540 |
These estimates are calculated with data collected from employers in all industry sectors, all metropolitan and nonmetropolitan areas, and all states and the District of Columbia. The top employment and wage figures are provided above. The complete list is available in the downloadable XLS files.
The percentile wage estimate is the value of a wage below which a certain percent of workers fall. The median wage is the 50th percentile wage estimate—50 percent of workers earn less than the median and 50 percent of workers earn more than the median. More about percentile wages.
(1) Estimates for detailed occupations do not sum to the totals because the totals include occupations not shown separately. Estimates do not include self-employed workers.
(2) Annual wages have been calculated by multiplying the hourly mean wage by a "year-round, full-time" hours figure of 2,080 hours; for those occupations where there is not an hourly wage published, the annual wage has been directly calculated from the reported survey data.
(3) The relative standard error (RSE) is a measure of the reliability of a survey statistic. The smaller the relative standard error, the more precise the estimate.
(8) Estimate not released.
(9) The location quotient is the ratio of the area concentration of occupational employment to the national average concentration. A location quotient greater than one indicates the occupation has a higher share of employment than average, and a location quotient less than one indicates the occupation is less prevalent in the area than average.
Other OEWS estimates and related information:
May 2023 National Occupational Employment and Wage Estimates
May 2023 State Occupational Employment and Wage Estimates
May 2023 Metropolitan and Nonmetropolitan Area Occupational Employment and Wage Estimates
May 2023 National Industry-Specific Occupational Employment and Wage Estimates
Last Modified Date: April 3, 2024