
An official website of the United States government
An official website of the United States government
The .gov means it's official.
Federal government websites often end in .gov or .mil. Before sharing sensitive information,
make sure you're on a federal government site.
The site is secure.
The
https:// ensures that you are connecting to the official website and that any
information you provide is encrypted and transmitted securely.
Identify, remove, pack, transport, or dispose of hazardous materials, including asbestos, lead-based paint, waste oil, fuel, transmission fluid, radioactive materials, or contaminated soil. Specialized training and certification in hazardous materials handling or a confined entry permit are generally required. May operate earth-moving equipment or trucks.
Employment estimate and mean wage estimates for Hazardous Materials Removal Workers:
| Employment (1) | Employment RSE (3) |
Mean hourly wage |
Mean annual wage (2) |
Wage RSE (3) |
|---|---|---|---|---|
| 49,960 | 2.3 % | $ 25.69 | $ 53,430 | 1.0 % |
Percentile wage estimates for Hazardous Materials Removal Workers:
| Percentile | 10% | 25% | 50% (Median) |
75% | 90% |
|---|---|---|---|---|---|
| Hourly Wage | $ 17.09 | $ 18.85 | $ 22.73 | $ 29.27 | $ 39.24 |
| Annual Wage (2) | $ 35,550 | $ 39,200 | $ 47,280 | $ 60,870 | $ 81,610 |
Industries with the highest published employment and wages for Hazardous Materials Removal Workers are provided. For a list of all industries with employment in Hazardous Materials Removal Workers, see the Create Customized Tables function.
Industries with the highest levels of employment in Hazardous Materials Removal Workers:
| Industry | Employment (1) | Percent of industry employment | Hourly mean wage | Annual mean wage (2) |
|---|---|---|---|---|
| Remediation and Other Waste Management Services | 31,400 | 17.41 | $ 25.16 | $ 52,340 |
| Waste Treatment and Disposal | 5,540 | 5.46 | $ 25.04 | $ 52,080 |
| Management, Scientific, and Technical Consulting Services | 1,660 | 0.09 | $ 23.29 | $ 48,440 |
| Waste Collection | 1,520 | 0.73 | $ 30.28 | $ 62,990 |
| Local Government, excluding Schools and Hospitals (OEWS Designation) | 1,170 | 0.02 | $ 29.62 | $ 61,600 |
Industries with the highest concentration of employment in Hazardous Materials Removal Workers:
| Industry | Employment (1) | Percent of industry employment | Hourly mean wage | Annual mean wage (2) |
|---|---|---|---|---|
| Remediation and Other Waste Management Services | 31,400 | 17.41 | $ 25.16 | $ 52,340 |
| Waste Treatment and Disposal | 5,540 | 5.46 | $ 25.04 | $ 52,080 |
| Waste Collection | 1,520 | 0.73 | $ 30.28 | $ 62,990 |
| Residential Building Construction | 1,060 | 0.11 | $ 26.18 | $ 54,440 |
| Management, Scientific, and Technical Consulting Services | 1,660 | 0.09 | $ 23.29 | $ 48,440 |
Top paying industries for Hazardous Materials Removal Workers:
| Industry | Employment (1) | Percent of industry employment | Hourly mean wage | Annual mean wage (2) |
|---|---|---|---|---|
| Electric Power Generation, Transmission and Distribution | 70 | 0.02 | $ 43.50 | $ 90,470 |
| Scientific Research and Development Services | 270 | 0.03 | $ 43.30 | $ 90,060 |
| Architectural, Engineering, and Related Services | 890 | 0.05 | $ 36.44 | $ 75,800 |
| Support Activities for Air Transportation | 30 | 0.01 | $ 34.85 | $ 72,490 |
| Aerospace Product and Parts Manufacturing | 50 | 0.01 | $ 34.67 | $ 72,110 |
States and areas with the highest published employment, location quotients, and wages for Hazardous Materials Removal Workers are provided. For a list of all areas with employment in Hazardous Materials Removal Workers, see the Create Customized Tables function.
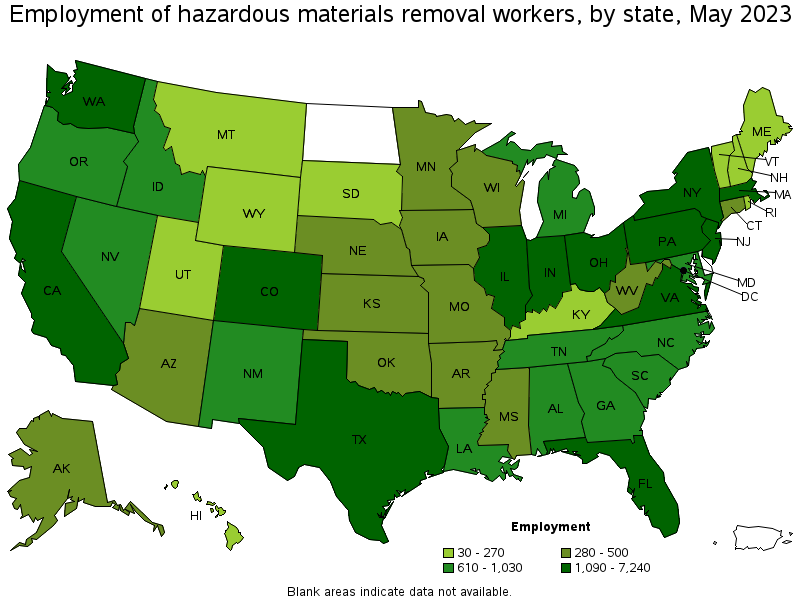
States with the highest employment level in Hazardous Materials Removal Workers:
| State | Employment (1) | Employment per thousand jobs | Location quotient (9) | Hourly mean wage | Annual mean wage (2) |
|---|---|---|---|---|---|
| California | 7,240 | 0.40 | 1.23 | $ 28.09 | $ 58,420 |
| Texas | 4,150 | 0.31 | 0.93 | $ 20.82 | $ 43,300 |
| New York | 3,890 | 0.41 | 1.26 | $ 34.66 | $ 72,100 |
| Massachusetts | 3,050 | 0.84 | 2.54 | $ 26.44 | $ 55,000 |
| Florida | 2,190 | 0.23 | 0.69 | $ 20.93 | $ 43,540 |
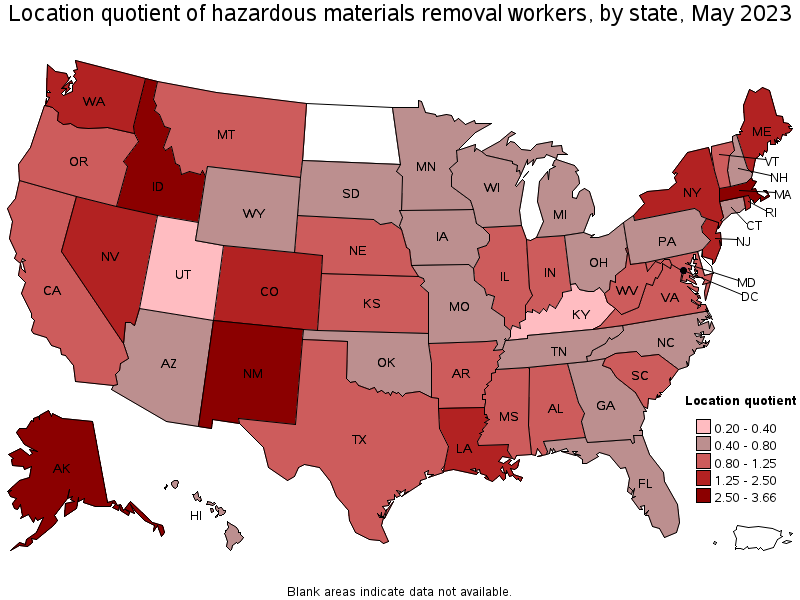
States with the highest concentration of jobs and location quotients in Hazardous Materials Removal Workers:
| State | Employment (1) | Employment per thousand jobs | Location quotient (9) | Hourly mean wage | Annual mean wage (2) |
|---|---|---|---|---|---|
| Idaho | 990 | 1.21 | 3.66 | $ 23.45 | $ 48,780 |
| Alaska | 320 | 1.03 | 3.12 | $ 26.34 | $ 54,780 |
| New Mexico | 780 | 0.92 | 2.79 | $ 26.97 | $ 56,100 |
| Massachusetts | 3,050 | 0.84 | 2.54 | $ 26.44 | $ 55,000 |
| Colorado | 1,670 | 0.59 | 1.79 | $ 28.24 | $ 58,730 |
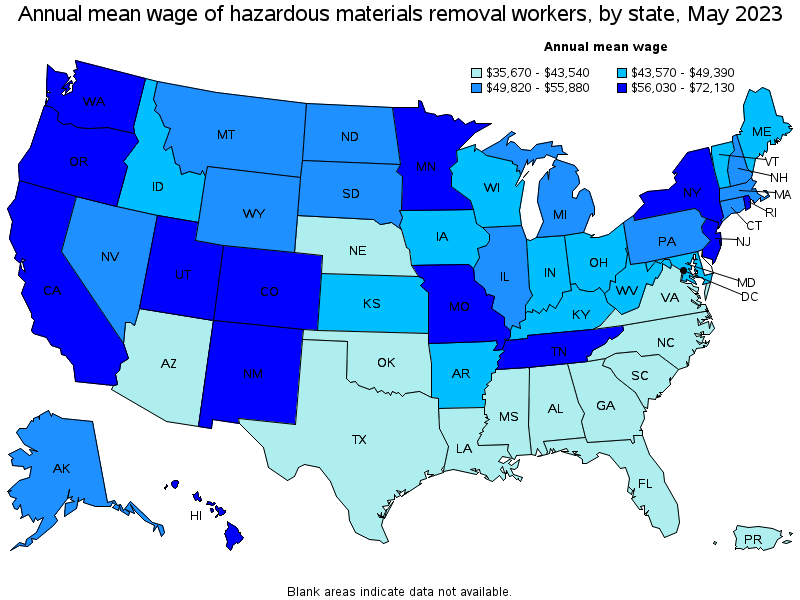
Top paying states for Hazardous Materials Removal Workers:
| State | Employment (1) | Employment per thousand jobs | Location quotient (9) | Hourly mean wage | Annual mean wage (2) |
|---|---|---|---|---|---|
| Washington | 1,830 | 0.52 | 1.60 | $ 34.68 | $ 72,130 |
| New York | 3,890 | 0.41 | 1.26 | $ 34.66 | $ 72,100 |
| New Jersey | 2,160 | 0.51 | 1.56 | $ 31.79 | $ 66,130 |
| Minnesota | 420 | 0.15 | 0.44 | $ 31.69 | $ 65,910 |
| Utah | 140 | 0.08 | 0.25 | $ 28.50 | $ 59,270 |
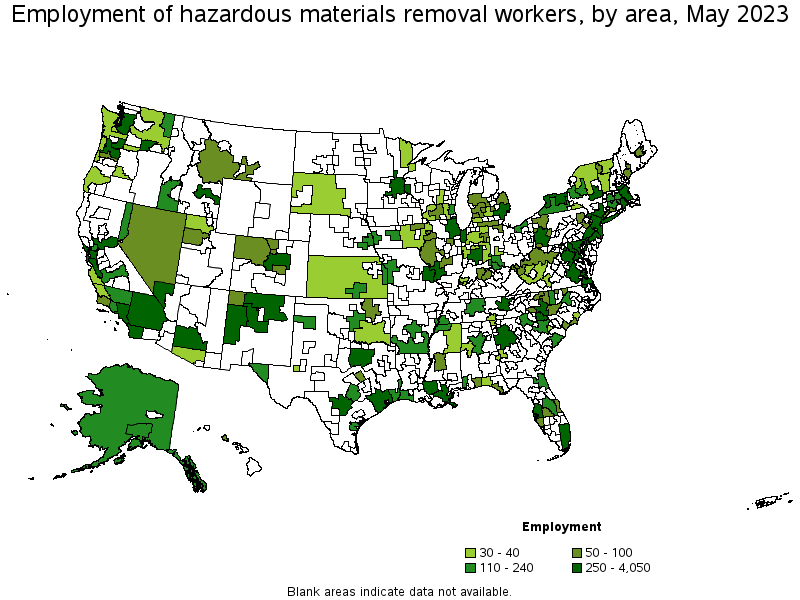
Metropolitan areas with the highest employment level in Hazardous Materials Removal Workers:
| Metropolitan area | Employment (1) | Employment per thousand jobs | Location quotient (9) | Hourly mean wage | Annual mean wage (2) |
|---|---|---|---|---|---|
| New York-Newark-Jersey City, NY-NJ-PA | 4,050 | 0.43 | 1.30 | $ 35.58 | $ 74,010 |
| Los Angeles-Long Beach-Anaheim, CA | 2,810 | 0.45 | 1.38 | $ 26.77 | $ 55,690 |
| Boston-Cambridge-Nashua, MA-NH | 2,420 | 0.87 | 2.66 | $ 26.39 | $ 54,880 |
| Chicago-Naperville-Elgin, IL-IN-WI | 1,610 | 0.36 | 1.08 | $ 26.60 | $ 55,340 |
| Houston-The Woodlands-Sugar Land, TX | 1,480 | 0.46 | 1.41 | $ 20.25 | $ 42,130 |
| San Francisco-Oakland-Hayward, CA | 1,300 | 0.54 | 1.63 | $ 31.03 | $ 64,540 |
| Dallas-Fort Worth-Arlington, TX | 980 | 0.25 | 0.75 | $ 21.44 | $ 44,600 |
| Denver-Aurora-Lakewood, CO | 980 | 0.62 | 1.87 | $ 27.49 | $ 57,180 |
| Washington-Arlington-Alexandria, DC-VA-MD-WV | 890 | 0.29 | 0.88 | $ 23.14 | $ 48,140 |
| Seattle-Tacoma-Bellevue, WA | 830 | 0.40 | 1.21 | $ 33.07 | $ 68,790 |
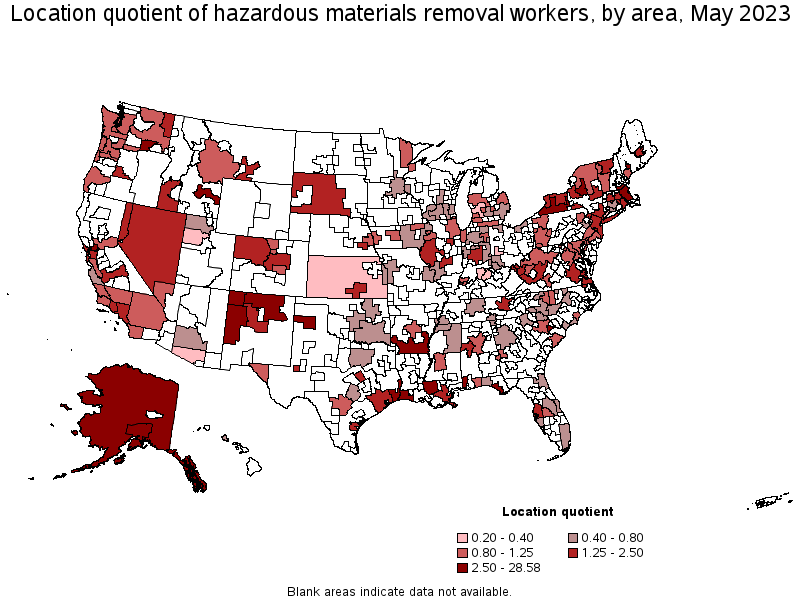
Metropolitan areas with the highest concentration of jobs and location quotients in Hazardous Materials Removal Workers:
| Metropolitan area | Employment (1) | Employment per thousand jobs | Location quotient (9) | Hourly mean wage | Annual mean wage (2) |
|---|---|---|---|---|---|
| Idaho Falls, ID | 740 | 9.40 | 28.58 | $ 23.42 | $ 48,720 |
| Kennewick-Richland, WA | 580 | 4.62 | 14.06 | $ 40.96 | $ 85,190 |
| Farmington, NM | 60 | 1.39 | 4.22 | $ 20.09 | $ 41,790 |
| Beaumont-Port Arthur, TX | 180 | 1.17 | 3.56 | $ 18.96 | $ 39,440 |
| Lake Charles, LA | 110 | 1.16 | 3.53 | $ 17.82 | $ 37,060 |
| Baton Rouge, LA | 450 | 1.16 | 3.53 | $ 18.98 | $ 39,480 |
| Vallejo-Fairfield, CA | 150 | 1.08 | 3.27 | $ 30.58 | $ 63,610 |
| Utica-Rome, NY | 120 | 1.06 | 3.21 | $ 34.85 | $ 72,490 |
| Sumter, SC | 40 | 1.03 | 3.15 | $ 19.86 | $ 41,300 |
| Amarillo, TX | 120 | 1.01 | 3.08 | $ 36.89 | $ 76,730 |
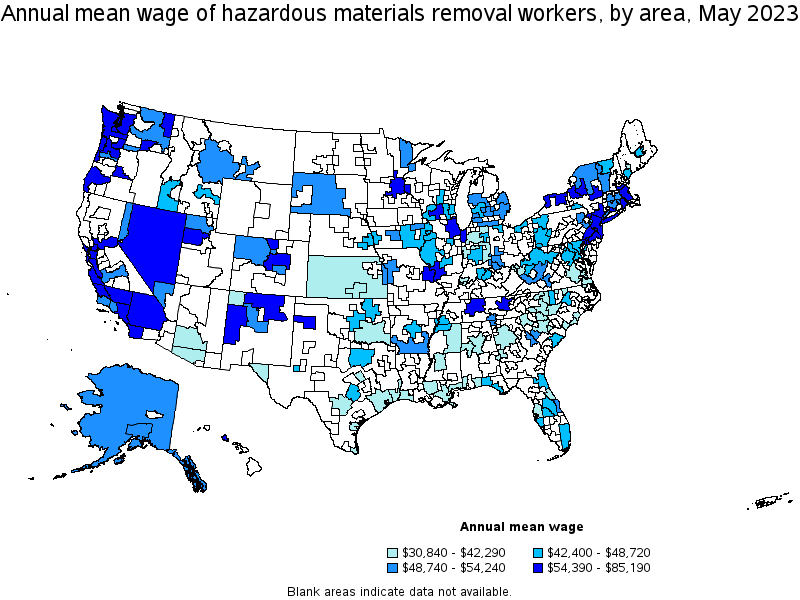
Top paying metropolitan areas for Hazardous Materials Removal Workers:
| Metropolitan area | Employment (1) | Employment per thousand jobs | Location quotient (9) | Hourly mean wage | Annual mean wage (2) |
|---|---|---|---|---|---|
| Kennewick-Richland, WA | 580 | 4.62 | 14.06 | $ 40.96 | $ 85,190 |
| Bremerton-Silverdale, WA | 40 | 0.40 | 1.21 | $ 39.94 | $ 83,070 |
| San Luis Obispo-Paso Robles-Arroyo Grande, CA | 40 | 0.35 | 1.05 | $ 37.16 | $ 77,290 |
| Amarillo, TX | 120 | 1.01 | 3.08 | $ 36.89 | $ 76,730 |
| New York-Newark-Jersey City, NY-NJ-PA | 4,050 | 0.43 | 1.30 | $ 35.58 | $ 74,010 |
| Utica-Rome, NY | 120 | 1.06 | 3.21 | $ 34.85 | $ 72,490 |
| San Jose-Sunnyvale-Santa Clara, CA | 300 | 0.27 | 0.81 | $ 33.74 | $ 70,180 |
| Seattle-Tacoma-Bellevue, WA | 830 | 0.40 | 1.21 | $ 33.07 | $ 68,790 |
| Minneapolis-St. Paul-Bloomington, MN-WI | 290 | 0.15 | 0.45 | $ 32.89 | $ 68,400 |
| Knoxville, TN | 270 | 0.64 | 1.96 | $ 32.63 | $ 67,860 |
Nonmetropolitan areas with the highest employment in Hazardous Materials Removal Workers:
| Nonmetropolitan area | Employment (1) | Employment per thousand jobs | Location quotient (9) | Hourly mean wage | Annual mean wage (2) |
|---|---|---|---|---|---|
| Northern New Mexico nonmetropolitan area | 250 | 3.06 | 9.30 | $ 35.28 | $ 73,380 |
| Southwest New York nonmetropolitan area | 170 | 1.01 | 3.08 | (8) | (8) |
| South Arkansas nonmetropolitan area | 140 | 1.57 | 4.78 | $ 25.33 | $ 52,690 |
| Alaska nonmetropolitan area | 140 | 1.37 | 4.17 | $ 25.55 | $ 53,140 |
| Balance of Lower Peninsula of Michigan nonmetropolitan area | 80 | 0.30 | 0.92 | $ 24.21 | $ 50,350 |
Nonmetropolitan areas with the highest concentration of jobs and location quotients in Hazardous Materials Removal Workers:
| Nonmetropolitan area | Employment (1) | Employment per thousand jobs | Location quotient (9) | Hourly mean wage | Annual mean wage (2) |
|---|---|---|---|---|---|
| Northern New Mexico nonmetropolitan area | 250 | 3.06 | 9.30 | $ 35.28 | $ 73,380 |
| South Arkansas nonmetropolitan area | 140 | 1.57 | 4.78 | $ 25.33 | $ 52,690 |
| Alaska nonmetropolitan area | 140 | 1.37 | 4.17 | $ 25.55 | $ 53,140 |
| Southwest New York nonmetropolitan area | 170 | 1.01 | 3.08 | (8) | (8) |
| Nevada nonmetropolitan area | 60 | 0.60 | 1.83 | $ 29.35 | $ 61,060 |
Top paying nonmetropolitan areas for Hazardous Materials Removal Workers:
| Nonmetropolitan area | Employment (1) | Employment per thousand jobs | Location quotient (9) | Hourly mean wage | Annual mean wage (2) |
|---|---|---|---|---|---|
| Northern New Mexico nonmetropolitan area | 250 | 3.06 | 9.30 | $ 35.28 | $ 73,380 |
| Nevada nonmetropolitan area | 60 | 0.60 | 1.83 | $ 29.35 | $ 61,060 |
| Coast Oregon nonmetropolitan area | 40 | 0.39 | 1.19 | $ 28.82 | $ 59,950 |
| Western Washington nonmetropolitan area | 40 | 0.29 | 0.88 | $ 28.68 | $ 59,650 |
| Eastern Washington nonmetropolitan area | 40 | 0.37 | 1.11 | $ 25.93 | $ 53,940 |
These estimates are calculated with data collected from employers in all industry sectors, all metropolitan and nonmetropolitan areas, and all states and the District of Columbia. The top employment and wage figures are provided above. The complete list is available in the downloadable XLS files.
The percentile wage estimate is the value of a wage below which a certain percent of workers fall. The median wage is the 50th percentile wage estimate—50 percent of workers earn less than the median and 50 percent of workers earn more than the median. More about percentile wages.
(1) Estimates for detailed occupations do not sum to the totals because the totals include occupations not shown separately. Estimates do not include self-employed workers.
(2) Annual wages have been calculated by multiplying the hourly mean wage by a "year-round, full-time" hours figure of 2,080 hours; for those occupations where there is not an hourly wage published, the annual wage has been directly calculated from the reported survey data.
(3) The relative standard error (RSE) is a measure of the reliability of a survey statistic. The smaller the relative standard error, the more precise the estimate.
(8) Estimate not released.
(9) The location quotient is the ratio of the area concentration of occupational employment to the national average concentration. A location quotient greater than one indicates the occupation has a higher share of employment than average, and a location quotient less than one indicates the occupation is less prevalent in the area than average.
Other OEWS estimates and related information:
May 2023 National Occupational Employment and Wage Estimates
May 2023 State Occupational Employment and Wage Estimates
May 2023 Metropolitan and Nonmetropolitan Area Occupational Employment and Wage Estimates
May 2023 National Industry-Specific Occupational Employment and Wage Estimates
Last Modified Date: April 3, 2024