
An official website of the United States government
An official website of the United States government
The .gov means it's official.
Federal government websites often end in .gov or .mil. Before sharing sensitive information,
make sure you're on a federal government site.
The site is secure.
The
https:// ensures that you are connecting to the official website and that any
information you provide is encrypted and transmitted securely.
February 2010
Although most industry sectors have lost jobs during the current downturn, there have been some bright spots in the economy: educational services, and health care and social assistance, have gained employment over the past two years. This highlight looks at occupational employment and wages for several industries in these sectors as of May 2008, several months into the recession. In addition to strong employment growth, all but one of the selected industries had average wages above the national average of $20.32 per hour or $42,270 annually. Even in growing industries, not all occupations will experience employment increases; however, this analysis illustrates the types of jobs that are most common in these industries and that may benefit from positive overall employment trends.
Between December 2007 and December 2009, state, local, and private sector education gained a combined total of nearly 180,000 jobs, an increase of about 1.3 percent. This employment increase occurred primarily in state government and private sector education, which have most of their employment in colleges and universities; employment in local government education, which is concentrated in elementary and secondary schools, edged down over this period.
Click here to see these data in table format.
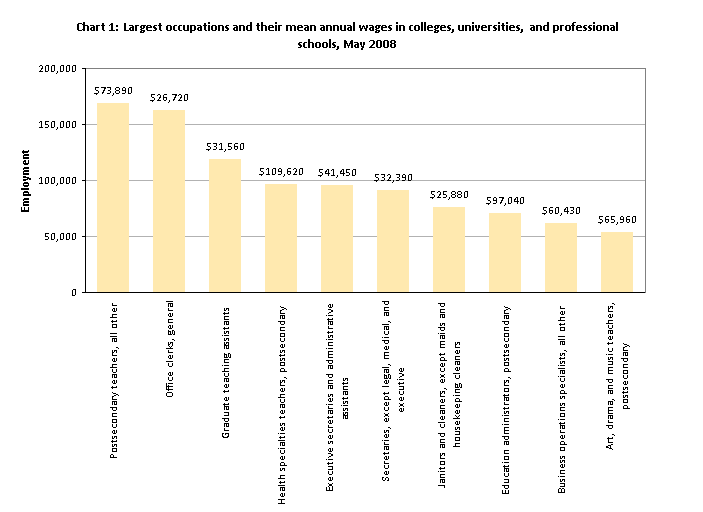
Chart 1 shows the largest occupations in colleges, universities, and professional schools. Colleges and universities employed a total of over 825,000 postsecondary teachers, including the three postsecondary teaching occupations shown in the chart; collectively, postsecondary teachers accounted for about 30 percent of industry employment.
Two other large occupations, graduate teaching assistants (employment of 118,650) and postsecondary education administrators (70,860), were directly related to the provision of educational services. The remaining occupations shown in the chart were involved in office and administrative, facilities, or business operations support functions. These occupations included general office clerks (employment of 162,380); janitors and cleaners, except maids and housekeeping cleaners (75,900); and business operations specialists, all other (61,480).
Colleges and universities were relatively high paying overall, with an average wage of $26.68 per hour or $55,490 annually. The largest occupations in colleges and universities included a mix of high- and low-paying jobs. The high concentration of postsecondary teaching jobs is one factor contributing to this industry’s high average wage. Annual mean wages in this industry for all postsecondary teaching occupations were above the U.S. average of $42,270, ranging from $51,470 for postsecondary vocational education teachers to $103,750 for postsecondary law teachers and $109,620 for postsecondary health specialties teachers. Postsecondary education administrators also received wages significantly above the U.S. average, with an annual mean salary of $97,040. On the other hand, several other large occupations in this industry were relatively low paying, including janitors and cleaners ($12.44 per hour); general office clerks ($12.85); and secretaries, except legal, medical, and executive ($15.57).
The health care and social assistance industry sector experienced the largest employment increase between December 2007 and December 2009, gaining about 758,000 private sector jobs, an increase of approximately 4.9 percent. Over 83 percent of this employment growth was in health care industries, with social assistance accounting for the remaining 17 percent. This relatively strong performance may be due partly to the nature of the services provided by this sector. To the extent that health care is viewed as a necessity rather than an optional expenditure, demand for health care services may be less affected by an economic downturn, while the need for social services may tend to increase during recessions.
Click here to see these data in table format.
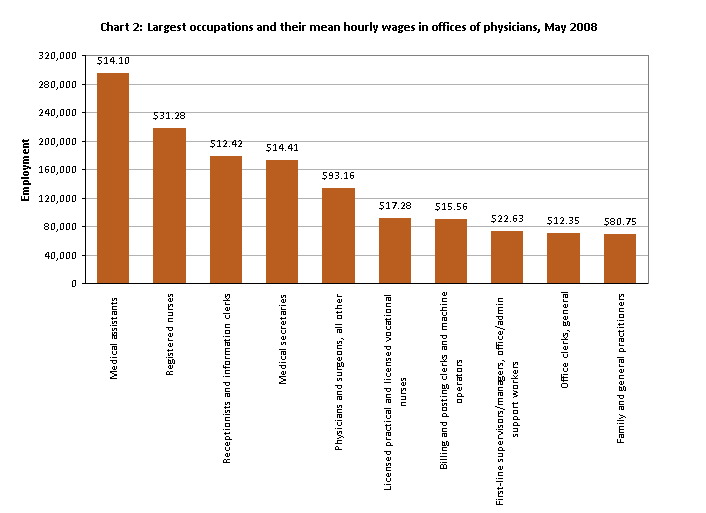
While offices of physicians and home health care services accounted for about 20 percent of December 2007 employment in the health care and social assistance sector, they accounted for nearly one-third of the sector’s job gains over the past two years. Chart 2 shows the largest occupations for offices of physicians, which together represented more than 60 percent of employment in this industry. The largest occupation in the industry, medical assistants, had employment of 294,380. Registered nurses were the second largest occupation, with employment of 218,110. The other large occupations were concentrated in two occupational groups: healthcare practitioner and technical occupations (physicians and surgeons, all other; licensed practical and licensed vocational nurses; and family and general practitioners) and office and administrative support occupations (receptionists and information clerks, medical secretaries, billing and posting clerks and machine operators, first-line supervisors/managers of office and administrative support workers, and general office clerks).
The average wage for offices of physicians was $30.31 per hour or $63,040 annually. Among the occupations shown in chart 2, the highest paid were physicians and surgeons, all other, with an average hourly wage of $93.16; and family and general practitioners, with an average hourly wage of $80.75. Registered nurses earned an average of $31.28 per hour in this industry. However, most of the remaining occupations shown in chart 2, including medical assistants ($14.10) and several of the office and administrative support occupations, had mean wages significantly below the U.S. average.
Click here to see these data in table format.
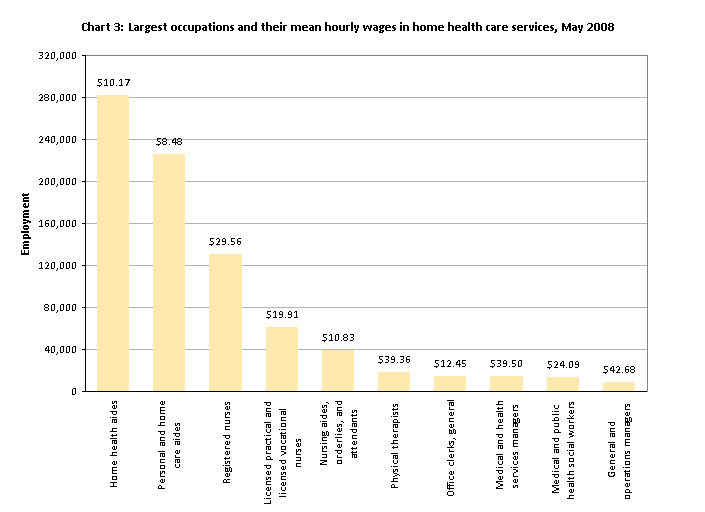
Chart 3 shows some of the largest occupations in home health care services, representing more than 85 percent of employment in the industry. The two largest occupations—home health aides and personal and home care aides—represented more than half of total jobs in this industry, with employment of 281,840 and 225,370, respectively. Nationally, home health care services were one of the largest employers of both occupations, employing about 32 percent of home health aides and 37 percent of personal and home care aides.
While most of the largest jobs in offices of physicians were concentrated in two occupational groups, the occupational composition of the home health care services industry was somewhat more diversified. In addition to the two occupations discussed above, the other large occupations in this industry included three healthcare practitioner and technical occupations (registered nurses, licensed practical and licensed vocational nurses, and physical therapists), two management occupations (medical and health services managers and general and operations managers), and one occupation each from the healthcare support, office and administrative support, and community and social services groups.
Of the industries discussed in this highlight, only home health care services had an average wage below the U.S. mean. This industry’s low hourly mean of $16.27 is due in part to the high concentration of two very low paying occupations: average wages for home health aides and personal and home care aides were $10.17 and $8.48, respectively. In addition, several of the largest occupations received lower wages in this industry than in other industries. For example, the mean wages for general and operations managers and medical and health services managers were $9.23 and $3.17 below their respective U.S. averages.
Click here to see these data in table format.
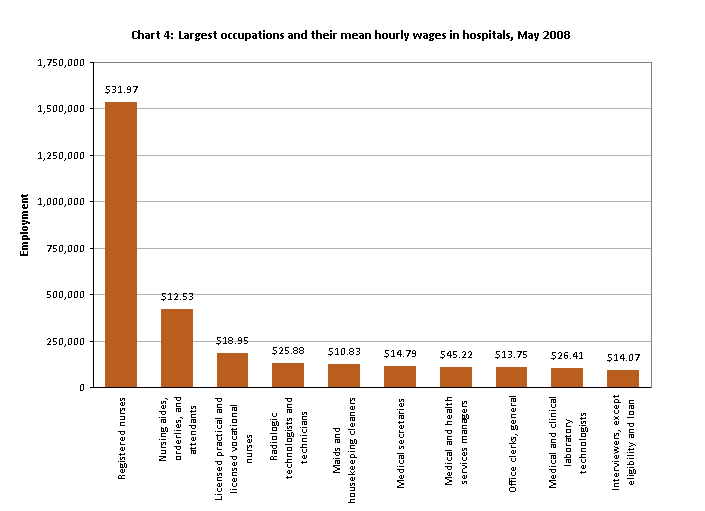
Public and private sector hospitals have gained approximately a quarter of a million jobs since December 2007. Chart 4 shows the largest occupations in hospitals, representing more than half of employment in this industry. Of the 10 large occupations shown in the chart, four were healthcare practitioner and technical occupations: registered nurses, licensed practical and licensed vocational nurses, radiologic technologists and technicians, and medical and clinical laboratory technologists. The largest of these occupations was registered nurses, with employment of 1,535,440. Nationally, hospitals were the primary employer of registered nurses, radiologic technologists and technicians, and medical and clinical laboratory technologists, accounting for over 60 percent of employment in each of these occupations. Among the other large occupations in this industry were three office and administrative support occupations (medical secretaries; general office clerks; and interviewers, except eligibility and loan); nursing aides, orderlies, and attendants; maids and housekeeping cleaners; and medical and health services managers.
The average hourly wage in hospitals was $24.44, approximately $4.12 above the U.S. mean wage for all occupations. Of the occupations shown in chart 4, only medical and health services managers, with an hourly mean of $45.22, earned more than twice the U.S. average, while maids and housekeeping cleaners, nursing aides, and all three office support occupations had average wages below $15.00 per hour. However, the high employment concentration of registered nurses, which had an above average hourly mean wage of $31.97, helped to push up average wages for this industry. In addition, although most of the differences were relatively small, the majority of occupations shown in the chart had higher wages in hospitals than across all industries. For example, wages for medical and health services managers and maids and housekeeping cleaners exceeded their respective U.S. averages by $2.55 and $1.07, respectively.
Employment changes by industry are based primarily on seasonally adjusted data from the Current Employment Statistics program, with the exception of hospitals, for which data are not seasonally adjusted. CES data for November and December 2009 are preliminary. Private sector, state government, and local government education employment by detailed industry are derived from the Quarterly Census of Employment and Wages. Detailed occupational employment and wage data, including complete data for the industries featured in this highlight, are available from the OES home page. This highlight was prepared by Fatemeh Hajiha and Audrey Watson. For more information, please contact the OES program.
Last Modified Date: February 4, 2010