
An official website of the United States government
An official website of the United States government
The .gov means it's official.
Federal government websites often end in .gov or .mil. Before sharing sensitive information,
make sure you're on a federal government site.
The site is secure.
The
https:// ensures that you are connecting to the official website and that any
information you provide is encrypted and transmitted securely.
December 2009
The holidays are here, a time when the retail trade sector traditionally attracts more shoppers and hires more workers. With the current recession, job seekers this season are especially eager to find stores that have the most jobs and the highest wages. While department stores are a popular destination for work during the holidays, people have increasingly turned to other types of stores for jobs over the past few years. Higher wages and growing employment may draw some job seekers to warehouse clubs and supercenters, for instance, while more diverse employment opportunities may attract others to certain occupations in electronic shopping and mail-order houses.
Click here to see these data in table format.
From December 2003 to December 2008, employment decreased 7 percent at department stores, while it increased 19 percent and 9 percent in other general merchandise stores and electronic shopping and mail-order houses, respectively. The shifting habits of shoppers toward these two industries, which include such stores as warehouse clubs and online shopping outlets, may have implications for the types of jobs available in the retail trade sector. The recent recession has amplified the employment shift away from department stores and toward other general merchandise stores. Between December 2003 and December 2007, employment decreased an average of 0.2 percent annually in department stores and increased an average of 3 percent annually in other general merchandise stores. From December 2007 to December 2008, this shift became more pronounced, with employment decreasing 6 percent in department stores and increasing 4 percent in other general merchandise stores.
This highlight compares occupational employment and wages in three large groups of retail employers. In particular, two groups of retailers—department stores and other general merchandise stores—have similar occupational makeups, while the third—electronic shopping and mail-order houses—has a distinct occupational composition. In addition, wages for many individual occupations varied across these industries.
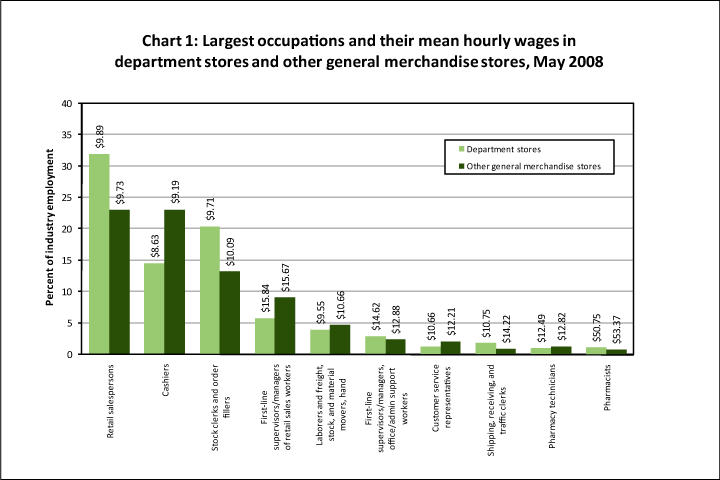
Chart 1 shows the largest occupations in department stores and other general merchandise stores as of May 2008, along with their mean hourly wages. Employment totaled nearly 1.6 million in department stores and approximately 1.5 million in other general merchandise stores. Most of the largest occupations in each industry were similar, with the same 6 occupations making up over 75 percent of employment in both industries. While two sales occupations combined (retail salespersons and cashiers) made up 46 percent of employment in each industry, department stores had more retail salespersons and fewer cashiers. Differences in the employment composition were found in stock clerks and order fillers, which accounted for 20 percent of employment in department stores and 13 percent in other general merchandise stores, and in first-line supervisors/managers of retail sales workers, which accounted for 6 percent and 9 percent of employment in the industries, respectively.
Click here to see these data in table format.
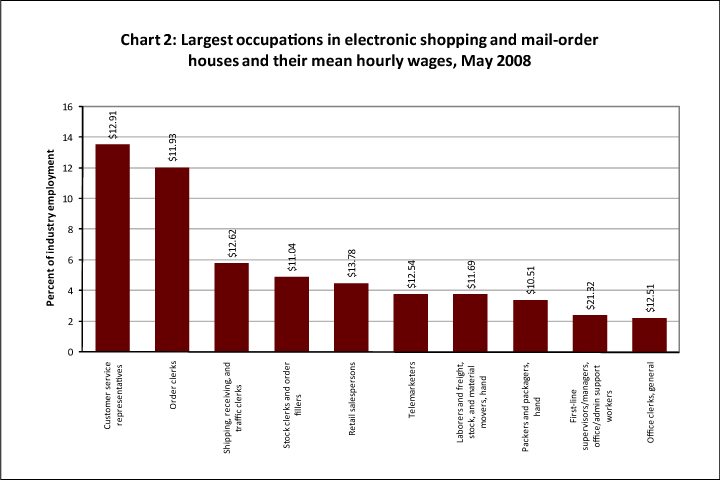
While traditional brick-and-mortar retailers had more homogeneous staffing patterns, the largest occupations in electronic shopping and mail-order houses differed markedly, as evident in chart 2. Compared to department stores and other general merchandise stores, employment in electronic shopping and mail-order houses was much smaller overall and showed more occupational variation. Total May 2008 employment in these nonstore retailers was slightly more than 257,000, less than 2 percent of employment in the entire retail trade sector. Furthermore, mean hourly wages for the largest occupations tended to be higher than wages in other retail industries.
Electronic shopping and mail-order houses also showed greater dispersion in their largest occupations: while the two largest occupations in department stores and other general merchandise stores accounted for almost half of their respective industry employment, the two largest occupations (customer service representatives and order clerks) in electronic shopping and mail-order houses accounted for roughly one-quarter. Among the ten occupations shown, the three smallest (hand packers and packagers, first-line supervisors/managers of office and administrative support workers, and general office clerks) made up 8 percent of industry employment. Still, six office and administrative support occupations made up nearly 41 percent of total industry employment.
Click here to see these data in table format.
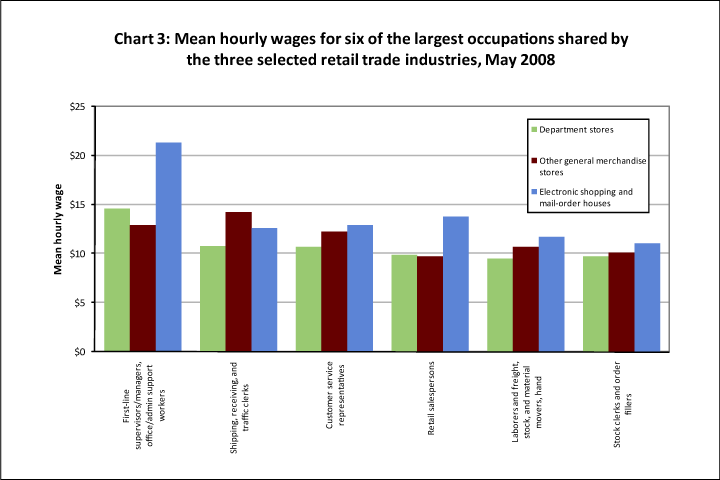
Chart 3 shows how wages compared for six of the largest occupations in the three selected retail trade industries. Generally, electronic shopping and mail-order houses had higher average wages than the two traditional retail industries, in part because they paid higher wages for the same occupations, and in part because their employment was concentrated in higher-paying occupations. Conversely, wages for department stores and other general merchandise stores were more similar, although department stores usually had the lowest wages of all three industries.
Among the traditional retailers, mean hourly wages varied slightly across the two industries. Department stores had lower wages in 7 of the 10 largest occupations, with a more pronounced difference in wages among the smaller occupations. Wages for retail salespersons and cashiers, for example, were just 16 cents higher (2 percent) and 56 cents lower (6 percent) in department stores, respectively. Likewise, the mean hourly wage for laborers and freight, stock, and material movers, hand ($10.66) was only 12 percent higher in other general merchandise stores than in department stores ($9.55). In contrast, shipping, receiving, and traffic clerks, a relatively small occupation, earned 32 percent more on average ($14.22) in other general merchandise stores than they did in department stores ($10.75). The mean hourly wage for all occupations was $11.57 in other general merchandise stores and $11.34 in department stores.
For the most part, electronic shopping and mail-order houses had the highest wages among the largest occupations shared by all three industries. For instance, retail salespersons earned an average of $13.78 per hour in this industry, approximately 39 percent and 42 percent more than their average wages in department stores and other general merchandise stores, respectively. Similarly, with a mean hourly wage of $21.32, first-line supervisors/managers of office and administrative support workers earned 46 percent more on average than they did in department stores ($14.62) and 66 percent more than in other general merchandise stores ($12.88). In addition, occupations with above average wages, such as graphic designers and computer specialists, were more highly concentrated in this industry than in other retailers. In total, the mean hourly wage for all occupations in electronic shopping and mail-order houses ($18.43) was almost 60 percent higher than that in department stores ($11.34) and other general merchandise stores ($11.57).
Data on changes in industry employment over time are from the Quarterly Census of Employment and Wages. Occupational employment and wage estimates for over 450 industry classifications at the national level, including the retail trade industries discussed in this highlight, can be found on the OES industry data page. Complete OES data are available from the OES home page. This highlight was prepared by Joseph W. Kane; for more information, please contact the OES program.
Last modified: December 17, 2009