An official website of the United States government
An official website of the United States government
The .gov means it's official.
Federal government websites often end in .gov or .mil. Before sharing sensitive information,
make sure you're on a federal government site.
The site is secure.
The
https:// ensures that you are connecting to the official website and that any
information you provide is encrypted and transmitted securely.
24-634-PHI
Friday, March 29, 2024
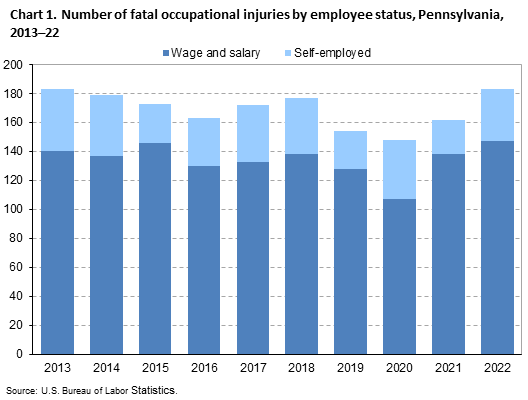
Fatal work injuries totaled 183 in 2022 for Pennsylvania, the U.S. Bureau of Labor Statistics reported today. Regional Commissioner Alexandra Hall Bovee noted that the number of work-related fatalities in Pennsylvania was up from 162 the previous year. (See chart 1.) Fatal occupational injuries in the state have ranged from a high of 354 in 1994 to a low of 148 in 2020. Nationwide, a total of 5,486 fatal work injuries were recorded in 2022, a 5.7-percent increase from 5,190 in 2021, according to the results from the Census of Fatal Occupational Injuries (CFOI).
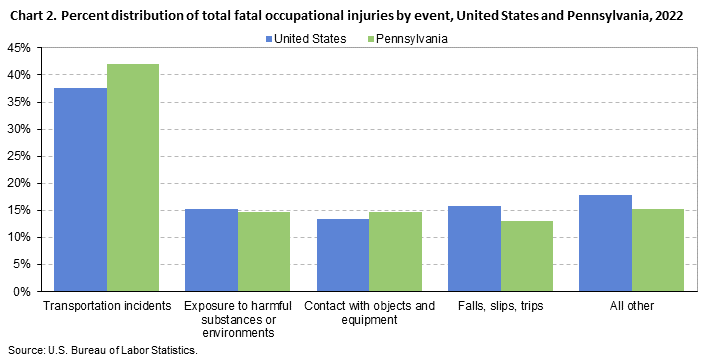
Fatal event or exposureIn Pennsylvania, transportation incidents resulted in 77 fatal work injuries and accounted for 42 percent of all fatal workplace injuries in the state. (See chart 2 and table 1.) Worker deaths from transportation incidents were up from 59 over the year.
The second-most common fatal events were exposure to harmful substances or environments and contact with objects and equipment, each accounting for 27 fatalities. Worker fatalities due to exposure to harmful substances or environments were up from 24 over the year, while work-related deaths from contact with objects or equipment were down from 29 the previous year. Falls, slips, or trips was the third-most frequent fatal work event with 24 fatalities, down from 30 in the prior year. Violence and other injuries by persons or animals resulted in 22 workplace fatalities.
Nationally, transportation incidents was the most frequent fatal event in 2022, accounting for 38 percent of fatal work injuries. Falls, slips, and trips was the second-most common fatal event (16 percent), followed by violence and other injuries by persons or animals along with exposure to harmful substances or environments (15 percent each).
IndustryThe private transportation and warehousing industry sector had the highest number of fatalities in Pennsylvania with 54, up from 34 in the previous year. (See table 2.) Transportation incidents resulted in 40 of the 54 fatalities in the industry. The general freight trucking, long-distance industry group accounted for 30 of the 54 fatal workplace injuries in the transportation and warehousing industry.
The private construction industry sector had 28 fatal workplace injuries, down from 29 in the previous year. The specialty trade contractors subsector accounted for 21, or 75 percent, of the fatal injuries in this industry.
OccupationThe transportation and material moving occupational group had the highest number of fatal workplace injuries with 72. (See table 3.) Drivers/sales workers and truck drivers accounted for 56 of the 72 fatalities among transportation and material moving workers. The construction and extraction occupational group had the second-highest number of fatal workplace injuries with 28. Construction trades workers suffered 21 of the work-related deaths within the construction and extraction group.
Additional highlights:Background of the program. The Census of Fatal Occupational Injuries (CFOI), part of the Bureau of Labor Statistics (BLS) Occupational Safety and Health Statistics (OSHS) program, is a count of all fatalities resulting from workplace injuries occurring in the U.S. during the calendar year. The CFOI uses a variety of state, federal, and independent data sources to identify, verify, and describe fatal work injuries. This ensures counts are as complete and accurate as possible. For the 2022 national data, over 27,200 unique source documents were reviewed as part of the data collection process. For technical information and definitions for the CFOI, see the BLS Handbook of Methods and the CFOI definitions.
Federal/State agency coverage. The CFOI includes data for all fatal work injuries, some of which may be outside the scope of other agencies or regulatory coverage. Comparisons between CFOI counts and those released by other agencies should account for the different coverage requirements and definitions used by each agency. For more information on the scope of CFOI, see Scope of the Census of Fatal Occupational Injuries and Census of Fatal Occupational Injuries: Concepts.
Latency Cases. Latent fatal occupational injury cases occur when the date of injury differs from the date of death. In some cases, the death occurs in a different year than the occupational injury and are known as cross-year latent cases. In 2022, there were 186 cases nationally where this occurred, and 157 of these latent cases occurred more than 30 days prior to the start of 2022. For more information on latent cases, see Understanding latency in fatal occupational injuries.
Coronavirus (COVID-19) Pandemic and the Census of Fatal Occupational Injuries. CFOI reports fatal workplace injuries only. These may include fatal workplace injuries complicated by an illness such as COVID-19. Fatal workplace illnesses not precipitated by an injury are not in scope for CFOI. CFOI does not report any illness related information, including COVID-19. Additional information is available on the Effects of COVID-19 Pandemic on Workplace Injuries and Illnesses, Compensation, Occupational Requirements, and Work Stoppages Statistics.
Acknowledgments. BLS thanks the Pennsylvania Department of Health for their efforts in collecting accurate, comprehensive, and useful data on fatal work injuries. BLS also appreciates the efforts of all federal, state, local, and private sector entities that provided source documents used to identify fatal work injuries. Among these agencies are the Occupational Safety and Health Administration; the National Transportation Safety Board; the U.S. Coast Guard; the Mine Safety and Health Administration; the Office of Workers’ Compensation Programs (Federal Employees' Compensation and Longshore and Harbor Workers' Compensation divisions); the Federal Railroad Administration; the National Highway Traffic Safety Administration; state vital statistics registrars, coroners, and medical examiners; state departments of health, labor, and industrial relations and workers' compensation agencies; state and local police departments; and state farm bureaus.
Information in this release will be made available to individuals with sensory impairments upon request. Voice phone: (202) 691-5200; Telecommunications Relay Service: 7-1-1.
| Event or exposure (1) | 2021 | 2022 | |
|---|---|---|---|
| Number | Number | Percent | |
|
Total |
162 | 183 | 100 |
|
Violence and other injuries by persons or animals |
-- | 22 | 12 |
|
Transportation incidents |
59 | 77 | 42 |
|
Roadway incidents involving motorized land vehicle |
36 | 56 | 31 |
|
Roadway collision with other vehicle |
18 | 29 | 16 |
|
Roadway collision--moving in same direction |
5 | 9 | 5 |
|
Roadway collision--moving in opposite directions, oncoming |
5 | 4 | 2 |
|
Roadway collision--moving perpendicularly |
-- | 5 | 3 |
|
Roadway collision--moving and standing vehicle in roadway |
5 | 9 | 5 |
|
Roadway collision--moving and standing vehicle on side of roadway |
2 | 2 | 1 |
|
Roadway collision with object other than vehicle |
14 | 22 | 12 |
|
Vehicle struck object or animal in roadway |
-- | 2 | 1 |
|
Vehicle struck object or animal on side of roadway |
-- | 19 | 10 |
|
Vehicle struck by falling or flying object--roadway |
-- | 1 | 1 |
|
Roadway noncollision incident |
4 | 5 | 3 |
|
Jack-knifed or overturned, roadway |
4 | 3 | 2 |
|
Ran off roadway |
-- | 1 | 1 |
|
Fall or jump from vehicle in normal operation, roadway |
-- | 1 | 1 |
|
Nonroadway incident involving motorized land vehicles |
10 | 10 | 5 |
|
Nonroadway collision with other vehicle |
-- | 3 | 2 |
|
Moving in opposite directions, oncoming, nonroadway |
-- | 1 | 1 |
|
Collision between a moving and standing vehicle, nonroadway |
-- | 1 | 1 |
|
Nonroadway collision with object other than vehicle |
-- | 3 | 2 |
|
Nonroadway noncollision incident |
-- | 4 | 2 |
|
Fires and explosions |
-- | -- | -- |
|
Falls, slips, trips |
30 | 24 | 13 |
|
Falls on same level |
-- | 5 | 3 |
|
Falls to lower level |
25 | 18 | 10 |
|
Other fall to lower level |
17 | 14 | 8 |
|
Other fall to lower level 26 to 30 feet |
-- | 4 | 2 |
|
Other fall to lower level more than 30 feet |
5 | 3 | 2 |
|
Fall or jump curtailed by personal fall arrest system |
-- | 1 | 1 |
|
Exposure to harmful substances or environments |
24 | 27 | 15 |
|
Exposure to electricity |
-- | 1 | 1 |
|
Direct exposure to electricity |
-- | 1 | 1 |
|
Direct exposure to electricity, greater than 220 volts |
-- | 1 | 1 |
|
Exposure to other harmful substances |
19 | 24 | 13 |
|
Exposure to oxygen deficiency, n.e.c. |
-- | 2 | 1 |
|
Drowning, submersion, n.e.c. |
-- | 1 | 1 |
|
Depletion of oxygen |
-- | 1 | 1 |
|
Contact with objects and equipment |
29 | 27 | 15 |
|
Struck by object or equipment |
23 | 19 | 10 |
|
Struck by powered vehicle--nontransport |
8 | 7 | 4 |
|
Struck or run over by rolling powered vehicle |
6 | 5 | 3 |
|
Struck by rolling object or equipment--other than powered vehicle |
-- | 1 | 1 |
|
Struck by object or equipment rolling freely |
-- | 1 | 1 |
|
Struck by falling object or equipment--other than powered vehicle |
12 | 8 | 4 |
|
Struck by object falling from vehicle or machinery--other than vehicle part |
4 | 3 | 2 |
|
Caught in or compressed by equipment or objects |
-- | 3 | 2 |
|
Caught in running equipment or machinery |
-- | 3 | 2 |
|
Caught in running equipment or machinery during regular operation |
-- | 3 | 2 |
|
Struck, caught, or crushed in collapsing structure, equipment, or material |
-- | 4 | 2 |
|
Overexertion and bodily reaction |
-- | -- | -- |
|
Footnotes: |
|||
|
NOTE: Data for all years are revised and final. Totals for major categories may include subcategories not shown separately. Dashes indicate no data reported or data that do not meet publication criteria. N.e.c. means "not elsewhere classified." CFOI fatal injury counts exclude illness-related deaths unless precipitated by an injury event. |
|||
| Industry (1) | 2021 | 2022 | |
|---|---|---|---|
| Number | Number | Percent | |
|
Total |
162 | 183 | 100 |
|
Private Industry (2) |
155 | 169 | 92 |
|
Goods producing |
-- | -- | -- |
|
Natural resources and mining |
15 | 16 | 9 |
|
Agriculture, forestry, fishing and hunting |
11 | 13 | 7 |
|
Crop production |
4 | 4 | 2 |
|
Oilseed and grain farming |
4 | 3 | 2 |
|
Corn farming |
4 | 3 | 2 |
|
Animal production and aquaculture |
4 | 9 | 5 |
|
Cattle ranching and farming |
3 | 9 | 5 |
|
Dairy cattle and milk production |
3 | 8 | 4 |
|
Mining, quarrying, and oil and gas extraction (3) |
4 | 3 | 2 |
|
Mining--except oil and gas |
-- | 3 | 2 |
|
Construction |
29 | 28 | 15 |
|
Construction |
29 | 28 | 15 |
|
Construction of buildings |
7 | 6 | 3 |
|
Heavy and civil engineering construction |
4 | 1 | 1 |
|
Highway, street, and bridge construction |
1 | 1 | 1 |
|
Highway, street, and bridge construction |
1 | 1 | 1 |
|
Specialty trade contractors |
18 | 21 | 11 |
|
Foundation, structure, and building exterior contractors |
10 | 11 | 6 |
|
Roofing contractors |
5 | 7 | 4 |
|
Residential roofing contractors |
-- | 1 | 1 |
|
Other specialty trade contractors |
-- | 5 | 3 |
|
Manufacturing |
24 | 10 | 5 |
|
Manufacturing |
24 | 10 | 5 |
|
Food manufacturing |
4 | 2 | 1 |
|
Fabricated metal product manufacturing |
-- | 4 | 2 |
|
Architectural and structural metals manufacturing |
-- | 1 | 1 |
|
Plate work and fabricated structural product manufacturing |
-- | 1 | 1 |
|
Fabricated structural metal manufacturing |
-- | 1 | 1 |
|
Service providing (4) |
-- | -- | -- |
|
Trade, transportation, and utilities |
43 | -- | -- |
|
Wholesale trade |
1 | 4 | 2 |
|
Merchant wholesalers, durable goods |
-- | 4 | 2 |
|
Retail trade |
7 | 7 | 4 |
|
Transportation and warehousing |
34 | 54 | 30 |
|
Truck transportation |
23 | 41 | 22 |
|
General freight trucking |
20 | 34 | 19 |
|
General freight trucking, local |
6 | 4 | 2 |
|
General freight trucking, long-distance |
14 | 30 | 16 |
|
General freight trucking, long-distance, truckload |
7 | 28 | 15 |
|
Specialized freight trucking |
3 | 7 | 4 |
|
Specialized freight (except used goods) trucking, local |
3 | 5 | 3 |
|
Transit and ground passenger transportation |
3 | 4 | 2 |
|
Warehousing and storage |
3 | 4 | 2 |
|
Warehousing and storage |
3 | 4 | 2 |
|
General warehousing and storage |
3 | 4 | 2 |
|
Information |
-- | 3 | 2 |
|
Information |
-- | 3 | 2 |
|
Publishing industries--except internet |
-- | 2 | 1 |
|
Telecommunications |
-- | 1 | 1 |
|
Wired and wireless telecommunication carriers |
-- | 1 | 1 |
|
Wired and wireless telecommunication carriers |
-- | 1 | 1 |
|
Wireless telecommunications carriers--except satellite |
-- | 1 | 1 |
|
Financial activities |
3 | 1 | 1 |
|
Real estate and rental and leasing |
3 | 1 | 1 |
|
Real estate |
-- | 1 | 1 |
|
Lessors of real estate |
-- | 1 | 1 |
|
Lessors of nonresidential buildings--except miniwarehouses |
-- | 1 | 1 |
|
Professional and business services |
25 | 20 | 11 |
|
Professional, scientific, and technical services |
6 | 1 | 1 |
|
Professional, scientific, and technical services |
6 | 1 | 1 |
|
Architectural, engineering, and related services |
3 | 1 | 1 |
|
Landscape architectural services |
-- | 1 | 1 |
|
Administrative and support and waste management and remediation services |
19 | 19 | 10 |
|
Administrative and support services |
14 | 13 | 7 |
|
Services to buildings and dwellings |
-- | 9 | 5 |
|
Landscaping services |
-- | 9 | 5 |
|
Waste management and remediation services |
5 | 6 | 3 |
|
Educational and health services |
4 | 10 | 5 |
|
Educational services |
-- | 3 | 2 |
|
Educational services |
-- | 3 | 2 |
|
Technical and trade schools |
-- | 1 | 1 |
|
Technical and trade schools |
-- | 1 | 1 |
|
Health care and social assistance |
4 | 7 | 4 |
|
Hospitals |
-- | 1 | 1 |
|
General medical and surgical hospitals |
-- | 1 | 1 |
|
General medical and surgical hospitals |
-- | 1 | 1 |
|
Nursing and residential care facilities |
-- | 3 | 2 |
|
Continuing care retirement communities and assisted living facilities for the elderly |
-- | 3 | 2 |
|
Continuing care retirement communities and assisted living facilities for the elderly |
-- | 3 | 2 |
|
Assisted living facilities for the elderly |
-- | 3 | 2 |
|
Leisure and hospitality |
8 | -- | -- |
|
Accommodation and food services |
5 | 5 | 3 |
|
Other services, except public administration |
4 | 8 | 4 |
|
Other services, except public administration |
4 | 8 | 4 |
|
Repair and maintenance |
-- | 5 | 3 |
|
Automotive repair and maintenance |
-- | 4 | 2 |
|
Commercial and industrial machinery and equipment (except automotive and electronic) repair and maintenance |
-- | 1 | 1 |
|
Commercial and industrial machinery and equipment (except automotive and electronic) repair and maintenance |
-- | 1 | 1 |
|
Personal and laundry services |
-- | 3 | 2 |
|
Government (5) |
7 | -- | -- |
|
Federal government |
3 | 1 | 1 |
|
Local government |
-- | 10 | 5 |
|
Footnotes: |
|||
|
NOTE: Data for all years are revised and final. Totals for major categories may include subcategories not shown separately. Dashes indicate no data reported or data that do not meet publication criteria. N.e.c. means "not elsewhere classified." CFOI fatal injury counts exclude illness-related deaths unless precipitated by an injury event. |
|||
| Occupation (1) | 2021 | 2022 | |
|---|---|---|---|
| Number | Number | Percent | |
|
Total |
162 | 183 | 100 |
|
Management occupations |
3 | 12 | 7 |
|
Operations specialties managers |
-- | 2 | 1 |
|
Other management occupations |
3 | 10 | 5 |
|
Farmers, ranchers, and other agricultural managers |
-- | 6 | 3 |
|
Farmers, ranchers, and other agricultural managers |
-- | 6 | 3 |
|
Construction managers |
-- | 1 | 1 |
|
Construction managers |
-- | 1 | 1 |
|
Food service managers |
-- | 1 | 1 |
|
Food service managers |
-- | 1 | 1 |
|
Business and financial operations occupations |
-- | 1 | 1 |
|
Business operations specialists |
-- | 1 | 1 |
|
Computer and mathematical occupations |
-- | -- | -- |
|
Architecture and engineering occupations |
-- | -- | -- |
|
Life, physical, and social science occupations |
1 | -- | -- |
|
Community and social service occupations |
-- | -- | -- |
|
Legal occupations |
-- | -- | -- |
|
Educational instruction and library occupations |
-- | -- | -- |
|
Postsecondary teachers |
-- | 1 | 1 |
|
Miscellaneous postsecondary teachers |
-- | 1 | 1 |
|
Career/technical education teachers, postsecondary |
-- | 1 | 1 |
|
Arts, design, entertainment, sports, and media occupations |
-- | -- | -- |
|
Healthcare practitioners and technical occupations |
-- | 4 | 2 |
|
Health technologists and technicians |
-- | 4 | 2 |
|
Healthcare support occupations |
-- | 3 | 2 |
|
Nursing, psychiatric, and home health aides |
-- | 3 | 2 |
|
Home health and personal care aides; and nursing assistants, orderlies, and psychiatric aides |
-- | 3 | 2 |
|
Home health and personal care aides |
-- | 3 | 2 |
|
Protective service occupations |
-- | 12 | 7 |
|
Other protective service workers |
1 | 4 | 2 |
|
Food preparation and serving related occupations |
-- | 3 | 2 |
|
Cooks and food preparation workers |
-- | 1 | 1 |
|
Cooks |
-- | 1 | 1 |
|
Cooks, fast food |
-- | 1 | 1 |
|
Food and beverage serving workers |
-- | 1 | 1 |
|
Fast food and counter workers |
-- | 1 | 1 |
|
Fast food and counter workers |
-- | 1 | 1 |
|
Building and grounds cleaning and maintenance occupations |
14 | 11 | 6 |
|
Supervisors of building and grounds cleaning and maintenance workers |
-- | 3 | 2 |
|
First-line supervisors of building and grounds cleaning and maintenance workers |
-- | 3 | 2 |
|
First-line supervisors of landscaping, lawn service, and groundskeeping workers |
-- | 3 | 2 |
|
Grounds maintenance workers |
9 | 8 | 4 |
|
Grounds maintenance workers |
9 | 8 | 4 |
|
Personal care and service occupations |
1 | 1 | 1 |
|
Entertainment attendants and related workers |
-- | 1 | 1 |
|
Miscellaneous entertainment attendants and related workers |
-- | 1 | 1 |
|
Amusement and recreation attendants |
-- | 1 | 1 |
|
Sales and related occupations |
7 | 4 | 2 |
|
Office and administrative support occupations |
8 | 3 | 2 |
|
Material recording, scheduling, dispatching, and distributing workers |
-- | 1 | 1 |
|
Couriers and messengers |
-- | 1 | 1 |
|
Couriers and messengers |
-- | 1 | 1 |
|
Farming, fishing, and forestry occupations |
8 | 6 | 3 |
|
Agricultural workers |
5 | 6 | 3 |
|
Miscellaneous agricultural workers |
5 | 6 | 3 |
|
Construction and extraction occupations |
36 | 28 | 15 |
|
Supervisors of construction and extraction workers |
4 | 5 | 3 |
|
First-line supervisors of construction trades and extraction workers |
4 | 5 | 3 |
|
First-line supervisors of construction trades and extraction workers |
4 | 5 | 3 |
|
Construction trades workers |
28 | 21 | 11 |
|
Construction laborers |
11 | 13 | 7 |
|
Construction laborers |
11 | 13 | 7 |
|
Roofers |
6 | 3 | 2 |
|
Roofers |
6 | 3 | 2 |
|
Structural iron and steel workers |
-- | 1 | 1 |
|
Structural iron and steel workers |
-- | 1 | 1 |
|
Other construction and related workers |
-- | 1 | 1 |
|
Construction and building inspectors |
-- | 1 | 1 |
|
Construction and building inspectors |
-- | 1 | 1 |
|
Extraction workers |
-- | 1 | 1 |
|
Underground mining machine operators |
-- | 1 | 1 |
|
Installation, maintenance, and repair occupations |
11 | 10 | 5 |
|
Vehicle and mobile equipment mechanics, installers, and repairers |
-- | 4 | 2 |
|
Other installation, maintenance, and repair occupations |
-- | 6 | 3 |
|
Line installers and repairers |
-- | 1 | 1 |
|
Telecommunications line installers and repairers |
-- | 1 | 1 |
|
Production occupations |
8 | 7 | 4 |
|
Metal workers and plastic workers |
4 | 3 | 2 |
|
Woodworkers |
-- | 1 | 1 |
|
Woodworking machine setters, operators, and tenders |
-- | 1 | 1 |
|
Sawing machine setters, operators, and tenders, wood |
-- | 1 | 1 |
|
Other production occupations |
4 | 3 | 2 |
|
Transportation and material moving occupations |
51 | 72 | 39 |
|
Motor vehicle operators |
37 | 60 | 33 |
|
Driver/sales workers and truck drivers |
33 | 56 | 31 |
|
Driver/sales workers |
-- | 5 | 3 |
|
Heavy and tractor-trailer truck drivers |
31 | 47 | 26 |
|
Light truck drivers |
-- | 4 | 2 |
|
Passenger vehicle drivers |
-- | 4 | 2 |
|
Material moving workers |
12 | 12 | 7 |
|
Industrial truck and tractor operators |
-- | 3 | 2 |
|
Industrial truck and tractor operators |
-- | 3 | 2 |
|
Laborers and material movers |
7 | 5 | 3 |
|
Laborers and freight, stock, and material movers, hand |
-- | 3 | 2 |
|
Footnotes: |
|||
|
NOTE: Data for all years are revised and final. Totals for major categories may include subcategories not shown separately. Dashes indicate no data reported or data that do not meet publication criteria. N.e.c. means "not elsewhere classified." CFOI fatal injury counts exclude illness-related deaths unless precipitated by an injury event. |
|||
| Worker characteristics | 2021 | 2022 | |
|---|---|---|---|
| Number | Number | Percent | |
|
Total |
162 | 183 | 100 |
|
Employee status |
|||
|
Wage and salary workers (1) |
138 | 147 | 80 |
|
Self-employed (2) |
24 | 36 | 20 |
|
Gender |
|||
|
Men |
152 | 165 | 90 |
|
Women |
10 | 18 | 10 |
|
Age (3) |
|||
|
Under 16 years |
-- | 1 | 1 |
|
16 to 17 years |
-- | 3 | 2 |
|
18 to 19 years |
-- | 4 | 2 |
|
20 to 24 years |
-- | 10 | 5 |
|
25 to 34 years |
35 | 31 | 17 |
|
35 to 44 years |
31 | 25 | 14 |
|
45 to 54 years |
35 | 34 | 19 |
|
55 to 64 years |
32 | 47 | 26 |
|
65 years and over |
23 | 28 | 15 |
|
Race or ethnic origin (4) |
|||
|
White, non-Hispanic |
116 | 127 | 69 |
|
Black or African-American, non-Hispanic |
18 | 27 | 15 |
|
Hispanic or Latino |
21 | 16 | 9 |
|
Asian, non-Hispanic |
3 | 10 | 5 |
|
Footnotes: |
|||
|
NOTE: Data for all years are revised and final. Totals for major categories may include subcategories not shown separately. Dashes indicate no data reported or data that do not meet publication criteria. N.e.c. means "not elsewhere classified." CFOI fatal injury counts exclude illness-related deaths unless precipitated by an injury event. |
|||
Last Modified Date: Friday, March 29, 2024