An official website of the United States government
An official website of the United States government
The .gov means it's official.
Federal government websites often end in .gov or .mil. Before sharing sensitive information,
make sure you're on a federal government site.
The site is secure.
The
https:// ensures that you are connecting to the official website and that any
information you provide is encrypted and transmitted securely.
24-153-CHI
Wednesday, February 07, 2024
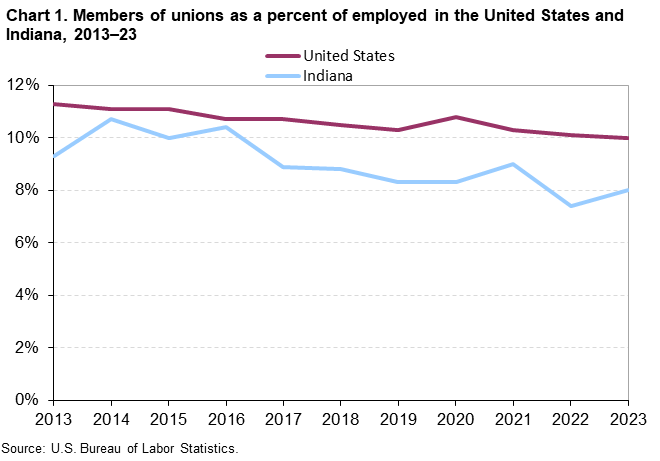
In 2023, union members accounted for 8.0 percent of wage and salary workers in Indiana, compared with 7.4 percent in 2022, the U.S. Bureau of Labor Statistics reported today. Regional Commissioner Jason Palmer noted that the union membership rate for the state was at its peak in 1989, when it averaged 21.0 percent, and at its low point in 2022. (See chart 1 and table A.) Nationwide, union members accounted for 10.0 percent of employed wage and salary workers in 2023. The rate was little changed from the previous year. Union membership rates in Indiana have been at or below the U.S. average since 2003 (comparable state data became available in 1989).
Indiana had 245,000 union members in 2023. In addition to these members, another 33,000 wage and salary workers in Indiana were represented by a union on their main job or covered by an employee association or contract while not union members themselves.
| Year | Total employed | Members of unions (1) | Represented by unions (2) | ||
|---|---|---|---|---|---|
| Total | Percent of employed | Total | Percent of employed | ||
2013 | 2,682 | 249 | 9.3 | 275 | 10.3 |
2014 | 2,802 | 299 | 10.7 | 335 | 12.0 |
2015 | 2,828 | 283 | 10.0 | 319 | 11.3 |
2016 | 2,927 | 304 | 10.4 | 335 | 11.4 |
2017 | 2,987 | 266 | 8.9 | 289 | 9.7 |
2018 | 3,049 | 269 | 8.8 | 283 | 9.3 |
2019 | 3,007 | 249 | 8.3 | 296 | 9.8 |
2020 | 2,838 | 235 | 8.3 | 270 | 9.5 |
2021 | 2,844 | 256 | 9.0 | 290 | 10.2 |
2022 | 3,023 | 223 | 7.4 | 260 | 8.6 |
2023 | 3,054 | 245 | 8.0 | 278 | 9.1 |
Footnotes: | |||||
Note: Data refer to the sole or principal job of full- and part-time wage and salary workers. All self-employed workers are excluded, both those with incorporated businesses as well as those with unincorporated businesses. Updated population controls are introduced annually with the release of January data. | |||||
Nationwide, 14.4 million wage and salary workers were union members in 2023 and 1.8 million wage and salary workers were not affiliated with a union but had jobs covered by a union contract. The number of wage and salary workers belonging to unions (14.4 million) showed little movement from 2022.
In 2023, 31 states and the District of Columbia had union membership rates below the U.S. average (10.0 percent), while 19 states had rates above it. (See table 1.) Eleven states had union membership rates below 5.0 percent in 2023. South Carolina had the lowest rate (2.3 percent). The next lowest rates were in North Carolina (2.7 percent) and South Dakota (3.6 percent). Two states had union membership rates over 20.0 percent in 2023: Hawaii (24.1 percent) and New York (20.6 percent). (See map 1.)
The estimates in this release are obtained from the Current Population Survey (CPS), which provides basic information on the labor force, employment, and unemployment. The survey is conducted monthly for the Bureau of Labor Statistics by the U.S. Census Bureau from a scientifically selected national sample of about 60,000 eligible households. The union membership data are tabulated from one-quarter of the CPS monthly sample and are limited to wage and salary workers. All self-employed workers are excluded.
This release preserves the long-time practice of highlighting the state union membership rates and levels regardless of their statistical significance. More information is available in the Union Members Technical Note.
Information in this release will be made available to individuals with sensory impairments upon request. Voice phone: 202-691-5200; Telecommunications Relay Service: 7-1-1.
| State | 2022 | 2023 | ||||||||
|---|---|---|---|---|---|---|---|---|---|---|
| Total employed | Members of unions(1) | Represented by unions(2) | Total employed | Members of unions(1) | Represented by unions(2) | |||||
| Total | Percent of employed | Total | Percent of employed | Total | Percent of employed | Total | Percent of employed | |||
Alabama | 2,066 | 149 | 7.2 | 173 | 8.4 | 2,088 | 156 | 7.5 | 180 | 8.6 |
Alaska | 298 | 48 | 16.0 | 52 | 17.3 | 307 | 45 | 14.8 | 47 | 15.2 |
Arizona | 3,061 | 169 | 5.5 | 189 | 6.2 | 3,164 | 133 | 4.2 | 152 | 4.8 |
Arkansas | 1,204 | 59 | 4.9 | 68 | 5.7 | 1,217 | 62 | 5.1 | 71 | 5.8 |
California | 16,240 | 2,617 | 16.1 | 2,856 | 17.6 | 16,349 | 2,514 | 15.4 | 2,769 | 16.9 |
Colorado | 2,672 | 178 | 6.7 | 201 | 7.5 | 2,730 | 189 | 6.9 | 235 | 8.6 |
Connecticut | 1,658 | 236 | 14.2 | 256 | 15.4 | 1,610 | 255 | 15.9 | 272 | 16.9 |
Delaware | 442 | 38 | 8.5 | 42 | 9.4 | 436 | 38 | 8.8 | 44 | 10.1 |
District of Columbia | 331 | 30 | 9.1 | 34 | 10.4 | 347 | 32 | 9.1 | 36 | 10.4 |
Florida | 9,100 | 414 | 4.5 | 511 | 5.6 | 9,453 | 442 | 4.7 | 578 | 6.1 |
Georgia | 4,521 | 200 | 4.4 | 244 | 5.4 | 4,626 | 211 | 4.6 | 250 | 5.4 |
Hawaii | 572 | 125 | 21.9 | 134 | 23.4 | 573 | 138 | 24.1 | 147 | 25.6 |
Idaho | 825 | 39 | 4.7 | 49 | 5.9 | 810 | 37 | 4.5 | 44 | 5.5 |
Illinois | 5,611 | 735 | 13.1 | 789 | 14.1 | 5,537 | 708 | 12.8 | 755 | 13.6 |
Indiana | 3,023 | 223 | 7.4 | 260 | 8.6 | 3,054 | 245 | 8.0 | 278 | 9.1 |
Iowa | 1,506 | 105 | 7.0 | 132 | 8.7 | 1,490 | 107 | 7.2 | 131 | 8.8 |
Kansas | 1,318 | 129 | 9.8 | 160 | 12.1 | 1,360 | 120 | 8.9 | 144 | 10.6 |
Kentucky | 1,791 | 141 | 7.9 | 185 | 10.3 | 1,719 | 152 | 8.8 | 194 | 11.3 |
Louisiana | 1,801 | 76 | 4.2 | 94 | 5.2 | 1,765 | 76 | 4.3 | 91 | 5.2 |
Maine | 527 | 48 | 9.2 | 61 | 11.5 | 566 | 52 | 9.2 | 61 | 10.8 |
Maryland | 2,816 | 327 | 11.6 | 372 | 13.2 | 2,822 | 302 | 10.7 | 362 | 12.8 |
Massachusetts | 3,241 | 413 | 12.7 | 447 | 13.8 | 3,267 | 412 | 12.6 | 443 | 13.6 |
Michigan | 4,212 | 589 | 14.0 | 644 | 15.3 | 4,409 | 564 | 12.8 | 623 | 14.1 |
Minnesota | 2,697 | 382 | 14.2 | 411 | 15.2 | 2,673 | 356 | 13.3 | 378 | 14.1 |
Mississippi | 1,102 | 62 | 5.6 | 79 | 7.2 | 1,081 | 75 | 7.0 | 106 | 9.8 |
Missouri | 2,681 | 257 | 9.6 | 284 | 10.6 | 2,734 | 255 | 9.3 | 286 | 10.4 |
Montana | 466 | 52 | 11.2 | 57 | 12.3 | 470 | 56 | 11.8 | 61 | 13.0 |
Nebraska | 923 | 60 | 6.5 | 74 | 8.1 | 940 | 68 | 7.3 | 88 | 9.4 |
Nevada | 1,287 | 146 | 11.3 | 164 | 12.8 | 1,382 | 171 | 12.4 | 201 | 14.5 |
New Hampshire | 687 | 70 | 10.1 | 77 | 11.2 | 668 | 62 | 9.3 | 73 | 10.9 |
New Jersey | 4,161 | 619 | 14.9 | 666 | 16.0 | 4,211 | 679 | 16.1 | 729 | 17.3 |
New Mexico | 806 | 71 | 8.8 | 86 | 10.6 | 805 | 60 | 7.5 | 73 | 9.1 |
New York | 8,124 | 1,679 | 20.7 | 1,795 | 22.1 | 8,300 | 1,711 | 20.6 | 1,787 | 21.5 |
North Carolina | 4,409 | 125 | 2.8 | 173 | 3.9 | 4,623 | 125 | 2.7 | 152 | 3.3 |
North Dakota | 365 | 23 | 6.4 | 28 | 7.6 | 359 | 22 | 6.2 | 27 | 7.5 |
Ohio | 4,989 | 641 | 12.8 | 699 | 14.0 | 5,108 | 641 | 12.5 | 691 | 13.5 |
Oklahoma | 1,587 | 88 | 5.5 | 113 | 7.1 | 1,705 | 115 | 6.8 | 132 | 7.7 |
Oregon | 1,810 | 281 | 15.5 | 305 | 16.9 | 1,808 | 255 | 14.1 | 270 | 15.0 |
Pennsylvania | 5,628 | 715 | 12.7 | 767 | 13.6 | 5,786 | 749 | 12.9 | 822 | 14.2 |
Rhode Island | 505 | 81 | 16.1 | 89 | 17.7 | 507 | 62 | 12.3 | 67 | 13.2 |
South Carolina | 2,050 | 35 | 1.7 | 40 | 2.0 | 2,130 | 49 | 2.3 | 63 | 3.0 |
South Dakota | 412 | 13 | 3.1 | 17 | 4.2 | 425 | 15 | 3.6 | 18 | 4.2 |
Tennessee | 2,931 | 163 | 5.5 | 184 | 6.3 | 2,981 | 178 | 6.0 | 205 | 6.9 |
Texas | 12,496 | 518 | 4.1 | 643 | 5.1 | 13,019 | 586 | 4.5 | 701 | 5.4 |
Utah | 1,540 | 60 | 3.9 | 133 | 8.7 | 1,584 | 65 | 4.1 | 134 | 8.4 |
Vermont | 284 | 34 | 12.1 | 38 | 13.4 | 301 | 43 | 14.3 | 46 | 15.4 |
Virginia | 3,906 | 146 | 3.7 | 175 | 4.5 | 4,042 | 176 | 4.3 | 226 | 5.6 |
Washington | 3,413 | 615 | 18.0 | 653 | 19.1 | 3,491 | 576 | 16.5 | 632 | 18.1 |
West Virginia | 689 | 64 | 9.2 | 69 | 10.0 | 691 | 60 | 8.7 | 70 | 10.1 |
Wisconsin | 2,648 | 187 | 7.1 | 212 | 8.0 | 2,761 | 205 | 7.4 | 232 | 8.4 |
Wyoming | 243 | 14 | 5.6 | 18 | 7.3 | 256 | 14 | 5.6 | 17 | 6.6 |
Footnotes | ||||||||||
Note: Data refer to the sole or principal job of full- and part-time wage and salary workers. All self-employed workers are excluded, both those with incorporated businesses as well as those with unincorporated businesses. Updated population controls are introduced annually with the release of January data. | ||||||||||
Last Modified Date: Wednesday, February 07, 2024