An official website of the United States government
An official website of the United States government
The .gov means it's official.
Federal government websites often end in .gov or .mil. Before sharing sensitive information,
make sure you're on a federal government site.
The site is secure.
The
https:// ensures that you are connecting to the official website and that any
information you provide is encrypted and transmitted securely.
24-82-CHI
Wednesday, February 28, 2024
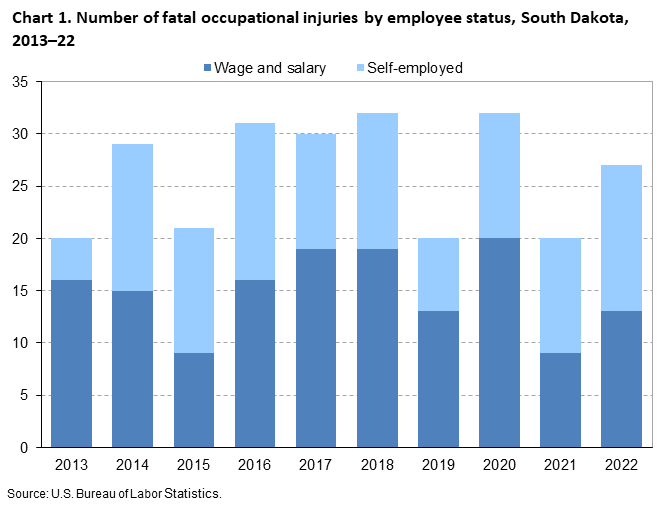
Fatal work injuries totaled 27 in 2022 for South Dakota, the U.S. Bureau of Labor Statistics reported today. Regional Commissioner Jason Palmer noted that the number of work-related fatalities in South Dakota was up from the previous year. (See chart 1.) Fatal occupational injuries in the state have ranged from a high of 46 in 1999 to a low of 20 in 2013, 2019, and 2021. Nationwide, a total of 5,486 fatal work injuries were recorded in 2022, a 5.7-percent increase from 5,190 in 2021, according to the results from the Census of Fatal Occupational Injuries (CFOI).
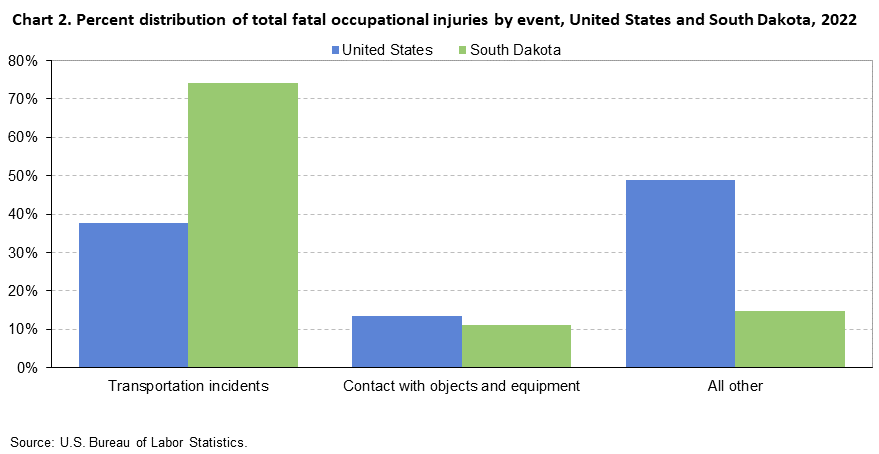
In South Dakota, transportation incidents resulted in 20 fatal work injuries, accounting for 74 percent of all fatal workplace injuries in the state. (See chart 2 and table 1.) Worker deaths from transportation incidents were up from 9 over the year.
Nationally, transportation incidents were the most frequent fatal event in 2022, accounting for 38 percent of fatal work injuries. Falls, slips, and trips was the second-most common fatal event (16 percent), followed by both violence and other injuries by persons or animals and exposure to harmful substances or environments (15 percent each).
The private agriculture, forestry, fishing, and hunting industry sector had the highest number of fatalities in South Dakota with nine, up from eight in the previous year. (See table 2.) Transportation incidents resulted in 6 of the 9 fatalities in the industry. The oilseed and grain farming industry group accounted for 56 percent of the fatal workplace injuries in the agriculture, forestry, fishing, and hunting industry.
The private construction and manufacturing industry sectors each had five fatal workplace injuries. The private wholesale trade industry sector had three fatal workplace injuries. Transportation incidents accounted for all three of the fatal injuries in the wholesale trade industry.
OccupationThe management and the transportation and material moving occupational groups each had the highest number of fatal workplace injuries with six. (See table 3.) Farmers, ranchers, and other agricultural workers accounted for all six of the fatal injuries among management workers. The construction and extraction occupational group had the second-highest number of fatal workplace injuries with five.
Additional highlightsMen accounted for 89 percent of the work-related fatalities in South Dakota, compared to the 92-percent national share. (See table 4.) Transportation incidents made up 71 percent of the fatalities for men in South Dakota.
White non-Hispanics accounted for 85 percent of those who died from a workplace injury. Nationwide, this group accounted for 58 percent of work-related deaths.
Workers 55 years and older accounted for 41 percent of the state’s work-related fatalities in 2022, compared to 35 percent of on-the-job fatalities nationally.
Of the 27 fatal work injuries in South Dakota, 48 percent worked for wages and salaries; the remainder were self-employed. The most frequent fatal event for both wage and salary workers and self-employed workers was transportation incidents.
Background of the program. The Census of Fatal Occupational Injuries (CFOI), part of the Bureau of Labor Statistics (BLS) Occupational Safety and Health Statistics (OSHS) program, is a count of all fatalities resulting from workplace injuries occurring in the U.S. during the calendar year. The CFOI uses a variety of state, federal, and independent data sources to identify, verify, and describe fatal work injuries. This ensures counts are as complete and accurate as possible. For the 2022 national data, over 27,200 unique source documents were reviewed as part of the data collection process. For technical information and definitions for the CFOI, see the BLS Handbook of Methods and the CFOI definitions.
Federal/State agency coverage. The CFOI includes data for all fatal work injuries, some of which may be outside the scope of other agencies or regulatory coverage. Comparisons between CFOI counts and those released by other agencies should account for the different coverage requirements and definitions used by each agency. For more information on the scope of CFOI, see Scope of the Census of Fatal Occupational Injuries and Census of Fatal Occupational Injuries: Concepts.
Latency Cases. Latent fatal occupational injury cases occur when the date of injury differs from the date of death. In some cases, the death occurs in a different year than the occupational injury and are known as cross-year latent cases. In 2022, there were 186 cases nationally where this occurred, and 157 of these latent cases occurred more than 30 days prior to the start of 2022. For more information on latent cases, see Understanding latency in fatal occupational injuries.
Coronavirus (COVID-19) Pandemic and the Census of Fatal Occupational Injuries. CFOI reports fatal workplace injuries only. These may include fatal workplace injuries complicated by an illness such as COVID-19. Fatal workplace illnesses not precipitated by an injury are not in scope for CFOI. CFOI does not report any illness related information, including COVID-19. Additional information is available on the Effects of COVID-19 Pandemic on Workplace Injuries and Illnesses, Compensation, Occupational Requirements, and Work Stoppages Statistics.
Acknowledgments. BLS appreciates the efforts of all federal, state, local, and private sector entities that provided source documents used to identify fatal work injuries. Among these agencies are the Occupational Safety and Health Administration; the National Transportation Safety Board; the U.S. Coast Guard; the Mine Safety and Health Administration; the Office of Workers’ Compensation Programs (Federal Employees' Compensation and Longshore and Harbor Workers' Compensation divisions); the Federal Railroad Administration; the National Highway Traffic Safety Administration; state vital statistics registrars, coroners, and medical examiners; state departments of health, labor, and industrial relations and workers' compensation agencies; state and local police departments; and state farm bureaus.
Information in this release will be made available to individuals with sensory impairments upon request. Voice phone: (202) 691-5200; Telecommunications Relay Service: 7-1-1.
| Event or exposure (1) | 2021 | 2022 | |
|---|---|---|---|
| Number | Number | Percent | |
|
Total |
20 | 27 | 100 |
|
Violence and other injuries by persons or animals |
-- | -- | -- |
|
Transportation incidents |
9 | 20 | 74 |
|
Aircraft incidents |
-- | 1 | 4 |
|
Other in-flight crash |
-- | 1 | 4 |
|
Other in-flight crash into structure, object, or ground |
-- | 1 | 4 |
|
Animal and other non-motorized vehicle transportation incidents |
-- | 1 | 4 |
|
Pedal cycle incident |
-- | 1 | 4 |
|
Roadway incidents involving motorized land vehicle |
6 | 15 | 56 |
|
Roadway collision with other vehicle |
3 | 10 | 37 |
|
Roadway collision--moving in same direction |
-- | 1 | 4 |
|
Roadway collision--moving in opposite directions, oncoming |
-- | 6 | 22 |
|
Fires and explosions |
-- | -- | -- |
|
Falls, slips, trips |
5 | -- | -- |
|
Exposure to harmful substances or environments |
-- | -- | -- |
|
Contact with objects and equipment |
-- | 3 | 11 |
|
Struck, caught, or crushed in collapsing structure, equipment, or material |
-- | 1 | 4 |
|
Engulfment in other collapsing material |
-- | 1 | 4 |
|
Overexertion and bodily reaction |
-- | -- | -- |
|
Footnotes: |
|||
|
NOTE: Data for all years are revised and final. Totals for major categories may include subcategories not shown separately. Dashes indicate no data reported or data that do not meet publication criteria. N.e.c. means "not elsewhere classified." CFOI fatal injury counts exclude illness-related deaths unless precipitated by an injury event. |
|||
| Industry (1) | 2021 | 2022 | |
|---|---|---|---|
| Number | Number | Percent | |
|
Total |
20 | 27 | 100 |
|
Private Industry (2) |
19 | 27 | 100 |
|
Goods producing |
-- | -- | -- |
|
Natural resources and mining |
8 | 9 | 33 |
|
Agriculture, forestry, fishing and hunting |
8 | 9 | 33 |
|
Crop production |
5 | 5 | 19 |
|
Oilseed and grain farming |
5 | 5 | 19 |
|
Animal production and aquaculture |
-- | 4 | 15 |
|
Cattle ranching and farming |
-- | 3 | 11 |
|
Hog and pig farming |
-- | 1 | 4 |
|
Hog and pig farming |
-- | 1 | 4 |
|
Construction |
3 | 5 | 19 |
|
Construction |
3 | 5 | 19 |
|
Construction of buildings |
-- | 2 | 7 |
|
Residential building construction |
-- | 1 | 4 |
|
Residential building construction |
-- | 1 | 4 |
|
New single-family housing construction--except for-sale builders |
-- | 1 | 4 |
|
Nonresidential building construction |
-- | 1 | 4 |
|
Commercial and institutional building construction |
-- | 1 | 4 |
|
Manufacturing |
-- | 5 | 19 |
|
Manufacturing |
-- | 5 | 19 |
|
Nonmetallic mineral product manufacturing |
-- | 1 | 4 |
|
Cement and concrete product manufacturing |
-- | 1 | 4 |
|
Ready-mix concrete manufacturing |
-- | 1 | 4 |
|
Fabricated metal product manufacturing |
-- | 1 | 4 |
|
Architectural and structural metals manufacturing |
-- | 1 | 4 |
|
Plate work and fabricated structural product manufacturing |
-- | 1 | 4 |
|
Fabricated structural metal manufacturing |
-- | 1 | 4 |
|
Transportation equipment manufacturing |
-- | 1 | 4 |
|
Aerospace product and parts manufacturing |
-- | 1 | 4 |
|
Aerospace product and parts manufacturing |
-- | 1 | 4 |
|
Aircraft engine and engine parts manufacturing |
-- | 1 | 4 |
|
Service providing (3) |
-- | -- | -- |
|
Trade, transportation, and utilities |
-- | -- | -- |
|
Wholesale trade |
-- | 3 | 11 |
|
Information |
-- | -- | -- |
|
Financial activities |
-- | -- | -- |
|
Professional and business services |
1 | -- | -- |
|
Educational and health services |
-- | 1 | 4 |
|
Health care and social assistance |
-- | 1 | 4 |
|
Ambulatory health care services |
-- | 1 | 4 |
|
Home health care services |
-- | 1 | 4 |
|
Home health care services |
-- | 1 | 4 |
|
Leisure and hospitality |
1 | 1 | 4 |
|
Arts, entertainment, and recreation |
-- | 1 | 4 |
|
Performing arts, spectator sports, and related industries |
-- | 1 | 4 |
|
Spectator sports |
-- | 1 | 4 |
|
Spectator sports |
-- | 1 | 4 |
|
Other services, except public administration |
-- | -- | -- |
|
Public administration |
-- | -- | -- |
|
Government (4) |
-- | -- | -- |
|
Federal government |
-- | -- | -- |
|
State government |
-- | -- | -- |
|
Local government |
-- | -- | -- |
|
Footnotes: |
|||
|
NOTE: Data for all years are revised and final. Totals for major categories may include subcategories not shown separately. Dashes indicate no data reported or data that do not meet publication criteria. N.e.c. means "not elsewhere classified." CFOI fatal injury counts exclude illness-related deaths unless precipitated by an injury event. |
|||
| Occupation (1) | 2021 | 2022 | |
|---|---|---|---|
| Number | Number | Percent | |
|
Total |
20 | 27 | 100 |
|
Management occupations |
8 | 6 | 22 |
|
Other management occupations |
8 | 6 | 22 |
|
Farmers, ranchers, and other agricultural managers |
7 | 6 | 22 |
|
Farmers, ranchers, and other agricultural managers |
7 | 6 | 22 |
|
Business and financial operations occupations |
-- | -- | -- |
|
Computer and mathematical occupations |
-- | -- | -- |
|
Architecture and engineering occupations |
-- | -- | -- |
|
Life, physical, and social science occupations |
-- | -- | -- |
|
Community and social service occupations |
-- | -- | -- |
|
Legal occupations |
-- | -- | -- |
|
Educational instruction and library occupations |
-- | -- | -- |
|
Arts, design, entertainment, sports, and media occupations |
-- | 1 | 4 |
|
Entertainers and performers, sports and related workers |
-- | 1 | 4 |
|
Athletes, coaches, umpires, and related workers |
-- | 1 | 4 |
|
Athletes and sports competitors |
-- | 1 | 4 |
|
Healthcare practitioners and technical occupations |
-- | -- | -- |
|
Healthcare support occupations |
-- | 1 | 4 |
|
Nursing, psychiatric, and home health aides |
-- | 1 | 4 |
|
Home health and personal care aides; and nursing assistants, orderlies, and psychiatric aides |
-- | 1 | 4 |
|
Home health and personal care aides |
-- | 1 | 4 |
|
Home health aides |
-- | 1 | 4 |
|
Protective service occupations |
-- | -- | -- |
|
Food preparation and serving related occupations |
-- | -- | -- |
|
Building and grounds cleaning and maintenance occupations |
-- | -- | -- |
|
Personal care and service occupations |
-- | -- | -- |
|
Sales and related occupations |
-- | -- | -- |
|
Office and administrative support occupations |
-- | -- | -- |
|
Farming, fishing, and forestry occupations |
1 | 3 | 11 |
|
Agricultural workers |
1 | 3 | 11 |
|
Miscellaneous agricultural workers |
1 | 3 | 11 |
|
Farmworkers, farm, ranch, and aquacultural animals |
-- | 3 | 11 |
|
Construction and extraction occupations |
-- | 5 | 19 |
|
Installation, maintenance, and repair occupations |
-- | -- | -- |
|
Production occupations |
-- | -- | -- |
|
Transportation and material moving occupations |
6 | 6 | 22 |
|
Footnotes: |
|||
|
NOTE: Data for all years are revised and final. Totals for major categories may include subcategories not shown separately. Dashes indicate no data reported or data that do not meet publication criteria. N.e.c. means "not elsewhere classified." CFOI fatal injury counts exclude illness-related deaths unless precipitated by an injury event. |
|||
| Worker characteristics | 2021 | 2022 | |
|---|---|---|---|
| Number | Number | Percent | |
|
Total |
20 | 27 | 100 |
|
Employee status |
|||
|
Wage and salary workers (1) |
9 | 13 | 48 |
|
Self-employed (2) |
11 | 14 | 52 |
|
Gender |
|||
|
Men |
17 | 24 | 89 |
|
Women |
3 | 3 | 11 |
|
Age (3) |
|||
|
18 to 19 years |
-- | 1 | 4 |
|
25 to 34 years |
-- | 6 | 22 |
|
35 to 44 years |
-- | 3 | 11 |
|
45 to 54 years |
4 | 5 | 19 |
|
55 to 64 years |
5 | 4 | 15 |
|
65 years and over |
6 | 7 | 26 |
|
Race or ethnic origin (4) |
|||
|
White, non-Hispanic |
20 | 23 | 85 |
|
Black or African-American, non-Hispanic |
-- | -- | -- |
|
Hispanic or Latino |
-- | -- | -- |
|
Asian, non-Hispanic |
-- | -- | -- |
|
Native Hawaiian or Pacific Islander, non-Hispanic |
-- | -- | -- |
|
Footnotes: |
|||
|
NOTE: Data for all years are revised and final. Totals for major categories may include subcategories not shown separately. Dashes indicate no data reported or data that do not meet publication criteria. N.e.c. means "not elsewhere classified." CFOI fatal injury counts exclude illness-related deaths unless precipitated by an injury event. |
|||
Last Modified Date: Wednesday, February 28, 2024