
An official website of the United States government
An official website of the United States government
The .gov means it's official.
Federal government websites often end in .gov or .mil. Before sharing sensitive information,
make sure you're on a federal government site.
The site is secure.
The
https:// ensures that you are connecting to the official website and that any
information you provide is encrypted and transmitted securely.
The Current Employment Statistics (CES) program produces detailed industry estimates of nonfarm employment, hours, and earnings of workers on payrolls. CES National Estimates produces data for the nation, and CES State and Metro Area produces estimates for all 50 States, the District of Columbia, Puerto Rico, the Virgin Islands, and about 450 metropolitan areas and divisions.
Each month, CES surveys approximately 119,000 businesses and government agencies, representing approximately 629,000 individual worksites.
- 1-month
- 3-month
- 6-month
- 12-month
Employment change by industry with confidence intervals, March 2024, seasonally adjusted, in thousands
Industry
1-month net change
1-month 90-percent confidence interval
3-month net change
3-month 90-percent confidence interval
6-month net change
6-month 90-percent confidence interval
12-month net change
12-month 90-percent confidence interval
Total nonfarm
303
134.4
829
205.6
1,466
276.2
2,927
374.1
Total private
232
124.3
635
191.2
1,099
251.5
2,263
341.0
Goods-producing
42
41.8
89
63.8
148
85.4
304
121.9
Service providing
261
125.3
740
195.7
1,318
260.9
2,623
350.7
Mining and logging
3
5.3
2
11.9
0
19.3
10
26.2
Construction
39
26.9
91
44.2
146
58.8
270
80.7
Manufacturing
0
28.2
-4
42.1
2
59.1
24
87.3
Wholesale trade
8.5
18.2
-1.1
29.0
25.1
38.5
62.2
48.3
Retail trade
17.6
24.4
57.2
35.9
47.9
60.9
80.3
80.7
Transportation and warehousing
1.2
20.6
19.9
31.7
-17.4
49.1
-31.4
67.5
Utilities
-0.4
2.7
4.2
5.9
9.7
8.8
16.4
14.6
Information
0
19.4
5
39.8
9
54.3
-37
75.6
Financial activities
3
19.4
-7
31.5
3
46.5
76
62.3
Professional and business services
7
56.5
72
87.4
90
114.7
157
146.8
Private education and health services
88
49.6
270
71.1
541
101.1
1,071
133.8
Leisure and hospitality
49
61.3
89
89.9
197
122.2
458
173.0
Other services
16
22.5
37
32.1
46
48.1
106
57.3
Government
71
51.1
194
75.7
367
114.1
664
154.0
Note: Significant changes are calculated at a 90-percent confidence level. The variance for total nonfarm is an approximation because government and rail transportation are not based on a probability sample
04/05/2024
Total nonfarm payroll employment rose by 303,000 in March, and the unemployment rate changed
little at 3.8 percent. Job gains occurred in health care, government, and construction.
HTML
|
PDF
|
RSS
|
Charts
04/10/2024
Real average hourly earnings for all employees were unchanged in March, seasonally adjusted. Average hourly earnings increased 0.3 percent, and CPI-U increased 0.4 percent. Real average weekly earnings increased 0.3 percent.
HTML
|
PDF
|
RSS
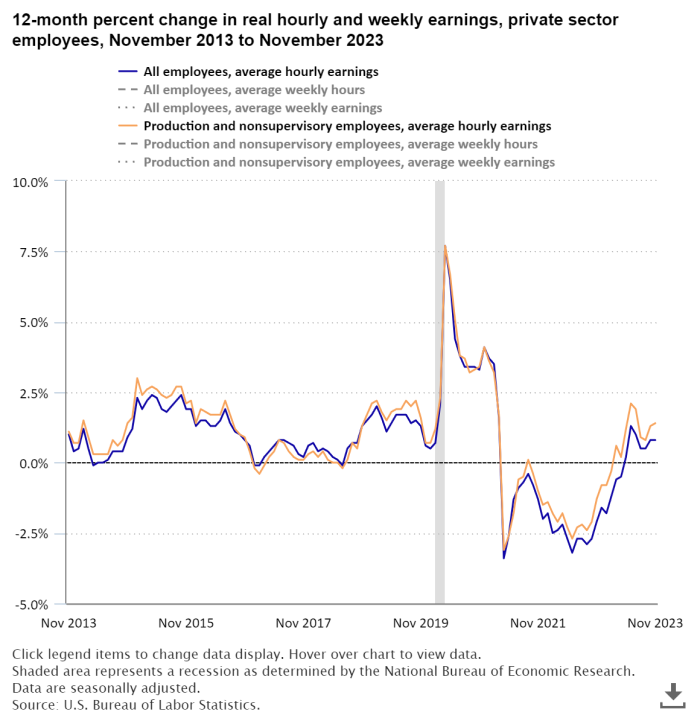
Real average hourly earnings increased 0.8 percent from November 2022 to November 2023. Real earnings are earnings that have been adjusted for changes in consumer prices. The change in real average hourly earnings combined with a decrease of 0.3 percent in the average workweek resulted in a 0.5-percent increase in real average weekly earnings. read more »

This article examines the effects of the NAICS 2022 update on CES national employment estimates in the retail trade sector and its component industries. read more »
Change in Total Nonfarm Payroll Employment:
+303,000(p) in Mar 2024
![]()
Change in Total Private Average Hourly Earnings for All Employees:
+$0.12(p) in Mar 2024
![]()
Change in Total Private Average Weekly Hours for All Employees:
+0.1(p) in Mar 2024
![]()
Percent change in Total Private Aggregate Weekly Hours for All Employees:
+0.5%(p) in Mar 2024
![]()
Change in Manufacturing Average Weekly Hours for All Employees:
unchanged in Mar 2024
![]()
Change in Manufacturing Average Weekly Overtime for All Employees:
-0.1(p) in Mar 2024
![]()
Change in Total Private Real Average Hourly Earnings for All Employees:
unchanged in Mar 2024
![]()