An official website of the United States government
An official website of the United States government
The .gov means it's official.
Federal government websites often end in .gov or .mil. Before sharing sensitive information,
make sure you're on a federal government site.
The site is secure.
The
https:// ensures that you are connecting to the official website and that any
information you provide is encrypted and transmitted securely.

| December 2016
Which jobs are hot usually depends on where you live. Opportunities in Longview, Washington, may differ from those in Longview, Texas, for example.
A good way to find hot jobs by location is to look at data from the U.S. Bureau of Labor Statistics (BLS) and state labor market information offices. For purposes of this article, “hot jobs” are those in occupations that have strong projected growth and high wages and are in strong demand.
Keep reading to learn where to find these data—and how data can help to identify which jobs are hot in your area.
BLS and state labor market information offices produce many types of data. These data provide important details about the job market at the national, state, and local levels.

BLS has a variety of data relevant to career planning. For example, the Occupational Employment Statistics survey has employment and wage data for more than 800 occupations. The surveys of businesses are typically collected by the states and BLS regional offices.
Another set of BLS data helpful for career planning is projections of occupational and industry employment, the labor force and population, and the economy. BLS economists prepare national projections every 2 years, analyzing broad trends and examining hundreds of occupations and industries. States develop their own state-level projections using input from these BLS national projections.
BLS has many other types of labor force data—and states use these data in different ways. For example, the BLS Current Employment Statistics survey publishes data on employment, earnings, and more. States may use these data to create a number of analyses of labor market conditions, such as for industry employment in a particular metropolitan statistical area.
All states have labor market information offices, although they may have different names and provide different kinds of information. A list of these offices is available on the BLS website.
The U.S. Department of Labor Employment and Training Administration mandates that states publish both long-term and short-term projections. Although the periods differ by state, long-term projections usually cover 10 years and short-term projections are for 2 years. The state-level data are available online at Projections Central.
In addition to statewide projections, state labor market data might include local projections, job postings, and other analyses.
Some states, such as Indiana, rank hot jobs by analyzing a number of factors about the labor market. But even if your state doesn’t produce a hot-jobs list, projections and other data can help you identify them. When considered together, strong projected growth, high wages, and strong current demand for an occupation may indicate a hot job.

Which occupations are projected to gain jobs? Which are expected to grow quickly? How many job openings can I expect? Projections data help to answer these questions.
Projected job growth is shown both as a number of new jobs and as a rate of growth for an occupation. For the nation as a whole, the occupation of personal care aides is projected to gain the most jobs (more than 450,000) between 2014 and 2024; employment of wind turbine service technicians is projected to grow the fastest (at a rate of 108 percent over the decade). Hover over the map to see the occupations that each state and the District of Columbia project to have the most new jobs and to grow the fastest.
Another way to answer questions about opportunities in an occupation is by looking at the number of expected job openings. Projected job openings include both new jobs and those that arise from the need to replace current workers who are leaving the occupation.
New jobs. Numeric change indicates how many jobs an occupation is projected to gain or lose over the projections period. Occupations expected to gain the most jobs are often those that already have large numbers of workers.

For example, applications software developers in Washington—one of the largest occupations in the state—topped the list in the number of new jobs projected. In Nebraska, the occupation of heavy and tractor-trailer truck drivers is projected to add the most jobs; it’s also the second largest in the state.
Rate of growth. This rate shows, in percentage terms, how fast the number of jobs in an occupation is projected to change. Fast growth, however, does not always mean many new jobs.
For example, South Carolina projects employment of commercial divers to grow by about 43 percent from 2014 to 2024, the fastest of any occupation in that state. But because the occupation has small employment, that growth yields about 30 new jobs over the projections decade.
Job openings. How much or how fast an occupation is projected to grow may not be as important to you as the number of job openings expected in it. As mentioned previously, projected job openings arise not just from growth but also from the need to replace workers who leave an occupation permanently for some reason, such as to retire.
For example, Massachusetts data show that on Cape Cod and the Islands, more than 200 job openings are projected per year from 2014 to 2024 for retail salespersons—the most for any occupation there. Those openings are expected to come primarily from the need to replace workers, rather than from growth.

Which are the highest paying occupations in my state? What about in my area? Should I expect to make more or less than other workers? Occupational wage data can help answer these questions.
You can tell if an occupation has a relatively high wage by comparing it with the wage for all occupations. Mean wages are useful when looking at occupations with very high wages. A median wage is more helpful for showing what is typical, because it is less likely to be influenced by either very high or very low wages within the occupation. Nationally, the mean annual wage for all occupations was $48,320 in 2015, according to BLS; the median annual wage was $36,200.
Mean wages. A mean is an average. Mean wages are calculated by adding the wages of all the workers in a given occupation and then dividing the total wages by the number of workers in the occupation.
For example, in the New Haven, Connecticut, metropolitan statistical area, high school teachers had a mean annual wage of $76,280. By comparison, all workers in that area had a mean wage of $53,680.

Median wages. The median wage is the point at which half the workers in a given occupation earned more than the median, and half earned less.
For example, in the St. Louis metropolitan area, personal financial advisors had a median annual wage of $90,420. That compares with a median wage of $36,530 for all workers in that area.
Table 1 shows selected occupations with relatively high annual wages, including the national median and ranges by state. Cost of living and other factors may make wage comparisons difficult between one state and another. For example, the table shows that nuclear power reactor operators in New York make almost $25,000 more than their counterparts in Mississippi. But the median annual wage for all workers in New York ($41,600) is higher than that for all workers in Mississippi ($29,000).
| Occupation | U.S. median annual wage | State and D.C. median wages range from… | to… |
|---|---|---|---|
|
Chief executives |
$175,110 | $186,370 in District of Columbia | $96,680 in Mississippi |
|
Architectural and engineering managers |
$132,800 | $155,650 in California | $106,310 in Kentucky |
|
Computer and information systems managers |
$131,600 | $153,810 in California | $79,920 in Mississippi |
|
Air traffic controllers |
$122,950 | $145,970 in New Hampshire | $71,550 in Montana |
|
Pharmacists |
$121,500 | $141,390 in Alaska | $109,550 in Nebraska |
|
Nurse practitioners |
$98,190 | $118,000 in California | $87,900 in Oklahoma |
|
Nuclear power reactor operators |
$88,560 | $103,470 in New York | $78,690 in Mississippi |
|
Transportation, storage, and distribution managers |
$86,600 | $130,320 in Delaware | $61,280 in Idaho |
|
First-line supervisors of police and detectives |
$82,090 | $132,010 in California | $49,180 in Mississippi |
|
Radiation therapists |
$80,220 | $108,720 in California | $61,640 in Nevada |
|
Source: U.S. Bureau of Labor Statistics, Occupational Employment Statistics survey. |
|||

What is the job market like right now? Are employers hiring? Which occupations have the most openings per jobseeker? Data analyses of labor market activity can help to answer these questions.
Occupations that are currently in high demand may vary by state. Information that highlights opportunities where you want to work is helpful if you’re looking for a job now or in the near future.
Job postings. Some states publish data on the number of job postings to show occupations for which employers are seeking to hire. For example, applications software developers, marketing managers, and web developers had the most online job postings in the San Francisco, California, area in October 2016.
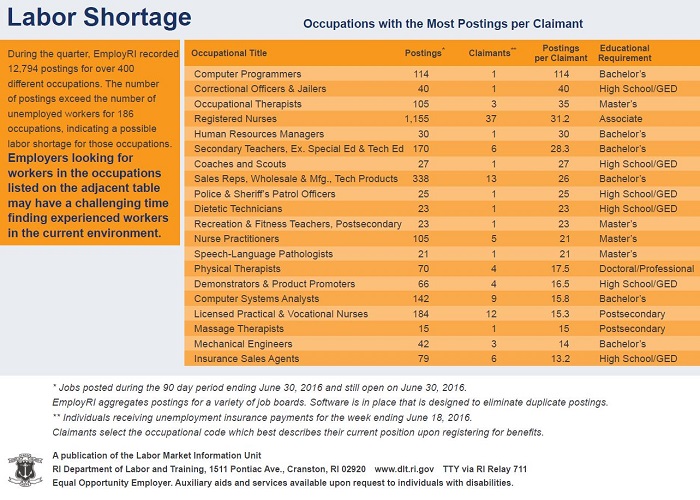
Other analyses. Supply-and-demand studies are another way that some states present information about the current labor market. For example, you may be able to assess how many job openings exist for each jobseeker by comparing the potential supply of labor (such as by looking at unemployment claimants or recent graduate data) with the demand for labor (such as with job postings).
The illustration shows a Rhode Island assessment of job postings and unemployment insurance claimants. The data indicate that computer programmers, correctional officers and jailers, and occupational therapists were among the occupations for which there were more job postings than unemployment insurance claimants during the second quarter of 2016.
State labor market information offices have lots of data in addition to the types described in the article. Examples include state and local unemployment and labor force participation rates. Some of the data may be available for industries as well as for occupations.
If you’re still curious about career options, the Occupational Outlook Handbook (OOH) describes hundreds of occupations. You can find out about typical duties, work environment, and wages and outlook at the national level, with links to state and area data.
Charting the projections articles in Career Outlook give a broad overview of expected growth for the nation as a whole over the 2014–24 decade.
Career Outlook articles related to state and local data include
If you’re looking for a job or exploring careers, you might want to read
Elka Torpey, "Finding hot jobs: Using data to locate career opportunities ," Career Outlook, U.S. Bureau of Labor Statistics, December 2016.