
An official website of the United States government
An official website of the United States government
The .gov means it's official.
Federal government websites often end in .gov or .mil. Before sharing sensitive information,
make sure you're on a federal government site.
The site is secure.
The
https:// ensures that you are connecting to the official website and that any
information you provide is encrypted and transmitted securely.
The Occupational Employment and Wage Statistics (OEWS) program produces employment and wage estimates annually for approximately 830 occupations. These estimates are available for the nation as a whole, for individual states, and for metropolitan and nonmetropolitan areas; national occupational estimates for specific industries are also available.
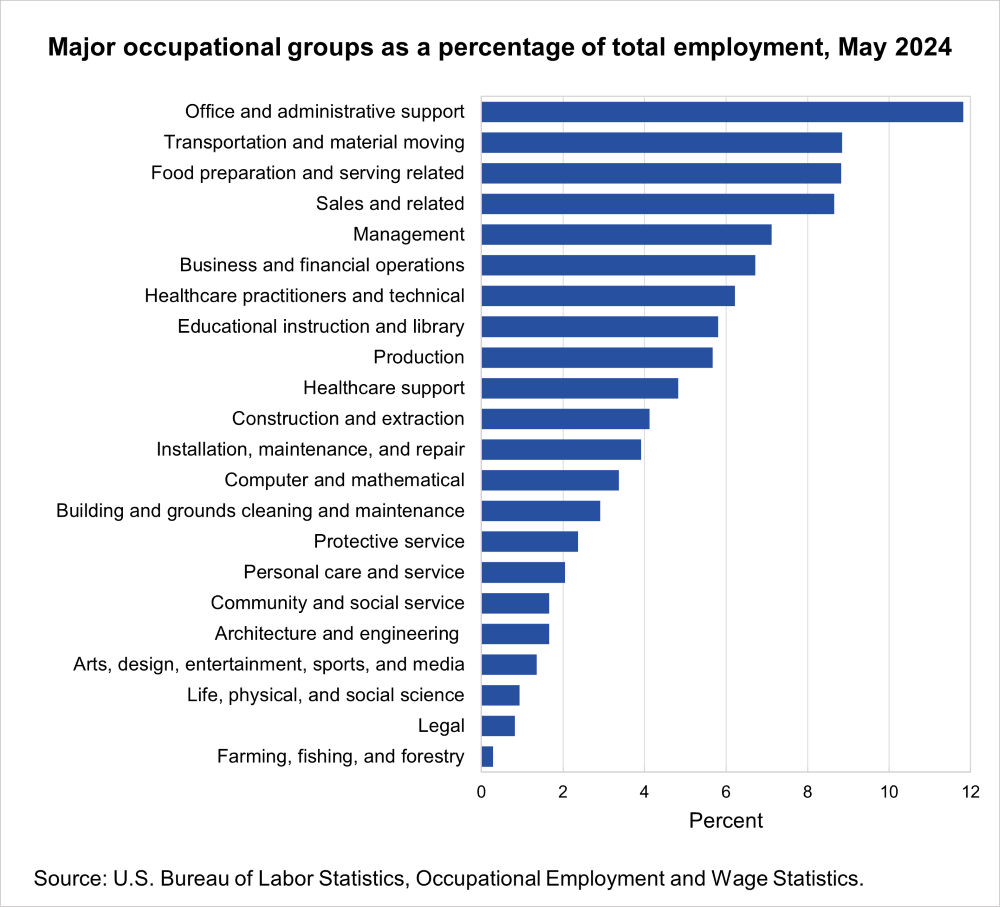
Click the graphic to enlarge chart: Major occupational groups as a percentage of total employment, May 2025.
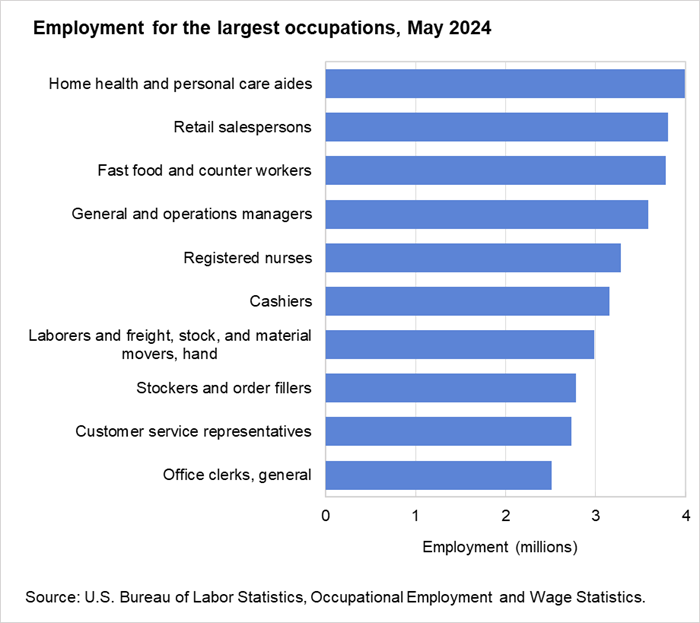
Click the graphic to enlarge chart: Employment for the largest occupations, May 2025.
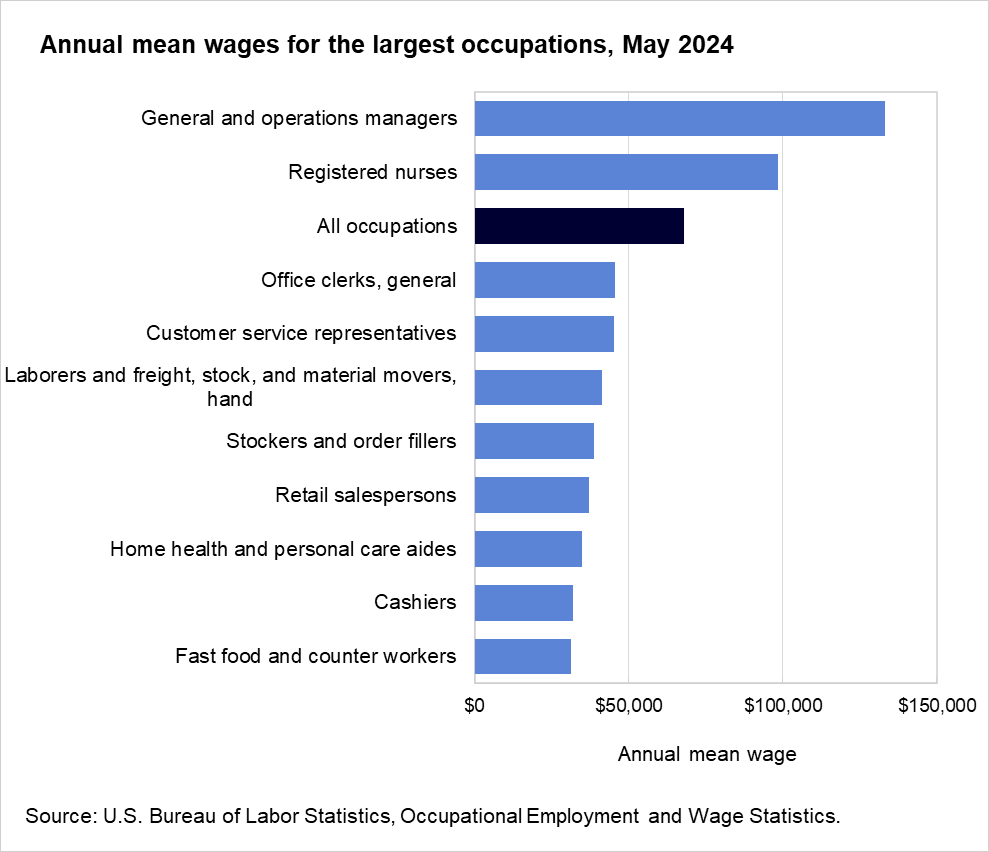
Click the graphic to enlarge chart: Annual mean wages for the largest occupations, May 2025.
Click the graphic to enlarge chart: Highest and lowest paying construction and extraction occupations, May 2025.
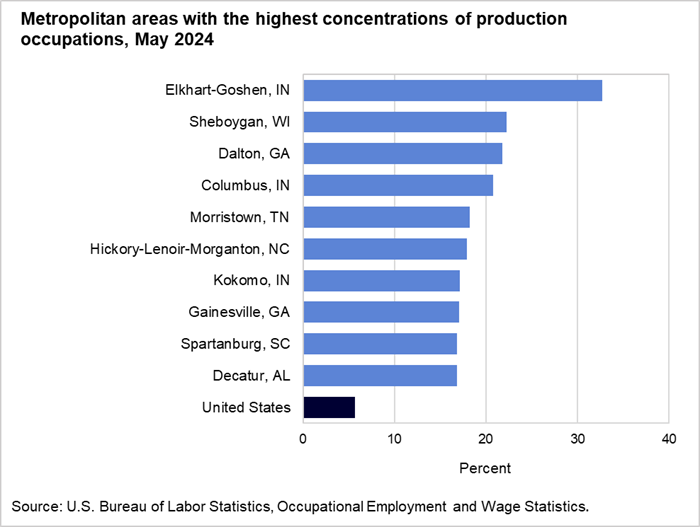
Click the graphic to enlarge chart: Metropolitan areas with the highest concentrations of construction and extraction occupations, May 2025.
05/15/2026
Construction and extraction occupations had employment of 6.4 million and an annual mean wage
of $65,360 in May 2025. Construction laborers (1.1 million) was the largest construction and
extraction occupation.
HTML
|
PDF
|
RSS
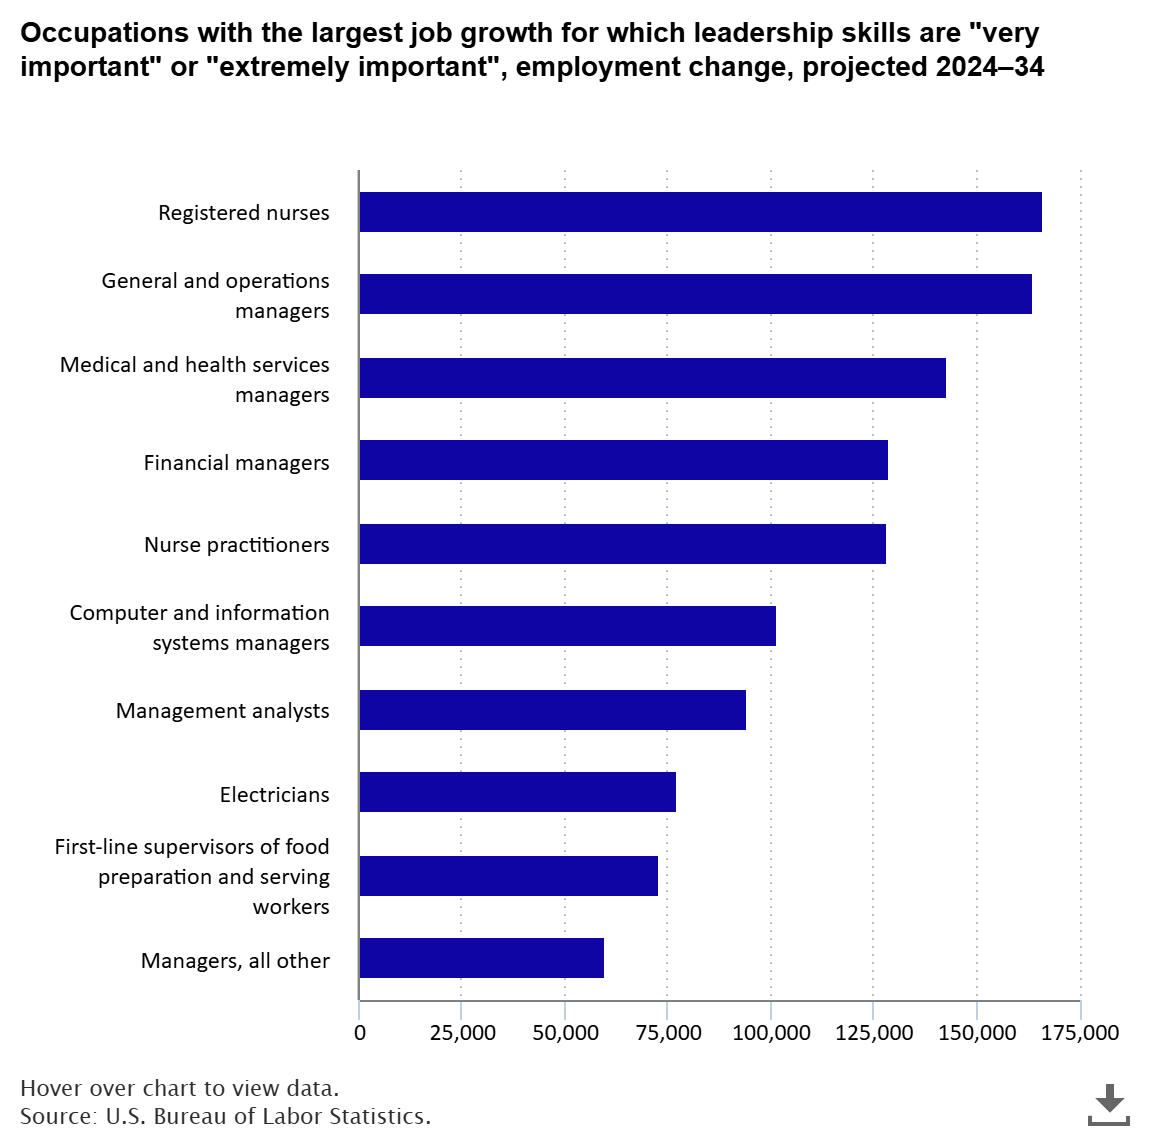
Do you like to lead? Are you good at helping others achieve goals by mentoring them, offering direction, building teams, and taking charge? In recognition of Leadership Day, February 20, let’s look at some occupations with large projected job growth for which leadership skills are especially important. read more »

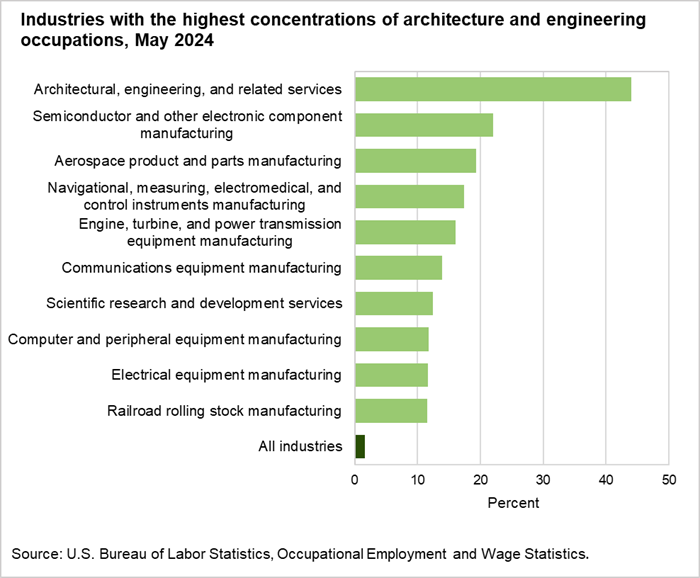
Analyzing data for STEM occupations can be challenging because many definitions of STEM exist. This Beyond the Numbers (BTN) article provides research and analysis of STEM occupations by presenting employment and wage data for different definitions of STEM, based on options for defining STEM developed by the interagency SOCPC. This article uses a special tabulation of May 2023 OEWS data to look at national STEM employment and wages for alternate SOCPC definitions. read more »

In response to the Great Depression, the Fair Labor Standards Act of 1938 instituted numerous labor law reforms. These reforms included establishing a federal minimum wage of $0.25 per hour ($5.49 per hour in today’s dollars). The minimum wage was later increased, and its scope extended to cover more workers. The most recent update, bringing the federal minimum wage up to its current value of $7.25 per hour, became effective 15 years ago in 2009. read more »
 Respondents homepage.