An official website of the United States government
An official website of the United States government
The .gov means it's official.
Federal government websites often end in .gov or .mil. Before sharing sensitive information,
make sure you're on a federal government site.
The site is secure.
The
https:// ensures that you are connecting to the official website and that any
information you provide is encrypted and transmitted securely.
The Current Population Survey (CPS) has been conducted for more than three-quarters of a century.1 From the outset, the main purpose of the survey has been to gather information on the employment status of the U.S. population, with an emphasis on the measurement of unemployment. CPS data have been used by policymakers and others to gauge both the degree of labor market weakness during recessions and the strength of the job market in economic expansions. More than 900 monthly reports on national employment and unemployment have been issued since the survey began in March 1940.
The survey also has been used to provide a wealth of information on a wide range of other subjects—some related to the labor market and some unrelated—through supplemental questions to the basic survey instrument. Over the years, supplements to the CPS have been used to collect data on topics ranging from income and worker displacement to tobacco use and participation in the arts.
The main objective of the CPS, however, has always been to measure unemployment and other aspects of labor market performance. This article summarizes some of the major developments in achieving this goal over the past three-quarters of a century.
Mass unemployment became a major problem in the United States during the Great Depression, yet there was remarkably little statistical information on the extent or nature of joblessness across the nation. Efforts to measure unemployment were stymied both by disagreement over how to define the problem—that is, what it meant to be “unemployed”—and by the lack of a tool that could gather reliable data on a recurring basis. It was not until the end of the 1930s that a monthly household survey yielding timely and reliable information on unemployment was put in place. The survey, called the Monthly Report of Unemployment (now called the CPS), embodied two significant breakthroughs that made measuring unemployment on an ongoing basis possible: the activity concept and probability sampling.2
Many early surveys relied on a person’s stated interest in work to determine whether or not that person was unemployed. These surveys often started by identifying the number of “gainful workers”—people who had a usual occupation.3 The surveys then proceeded to sort the subset of individuals in this group who were not currently working into the unemployed category on the basis of whether a person said they were “able” and “willing” to work. But many researchers questioned the meaningfulness of these criteria.
Asking people without work if they were able and/or wanted to work was fraught with value judgments, as the questions were largely hypothetical. They failed to stipulate a range of factors people would consider before deciding whether to enter the job market, like the nature of the job, hours, location, and pay, among others. Also, whether a person not currently working wanted or was able to take a job—even if liberally interpreted as indicative of current labor market attachment—arguably could vacillate from day to day with changing perceptions about the state of the job market or changes in one’s current living situation. There was also concern about how cultural norms and current economic conditions might bias answers to such questions toward socially acceptable responses, especially during a period of widespread unemployment. In the end, measuring unemployment by inquiring about ability and/or wanting/willingness to work was deemed much too subjective.
Instead, researchers settled on a more objective way to ascertain one’s employment status—by simply finding out what job-market-related activities people were doing during a prescribed period. Under this activity concept, a person who was not working but was actively seeking a job would be classified as unemployed. Classification based on activity is inherently more objective because actions are overt and demonstrable, rather than merely indicating that one wants a job.4
A more widely accepted measurement of unemployment required not only a more objective concept, but also more timely and accurate data. During the 1930s, statisticians were experimenting with probability sampling, using sample surveys that could accurately reflect population totals. Not only were the surveys representative of the population, but the data could be gathered and made available relatively quickly, unlike a complete tally such as a census.5
Toward the end of the decade, the Work Projects Administration (WPA) tested a monthly probability-based sample survey to produce national estimates of unemployment using the activity concept. Although there was skepticism that a small sample survey could produce reliable estimates representative of the entire population, advances in sample design and the use of trained interviewers to collect data helped ensure the sample-survey approach would work. The first operational survey, which collected data for March 1940, was intended to coincide with the 1940 Census, which contained similar labor-related questions.6 When the data from the two surveys were compared, it was determined that the sample survey produced more accurate statistics on unemployment, in part because survey interviewers were trained specifically on labor force concepts.7
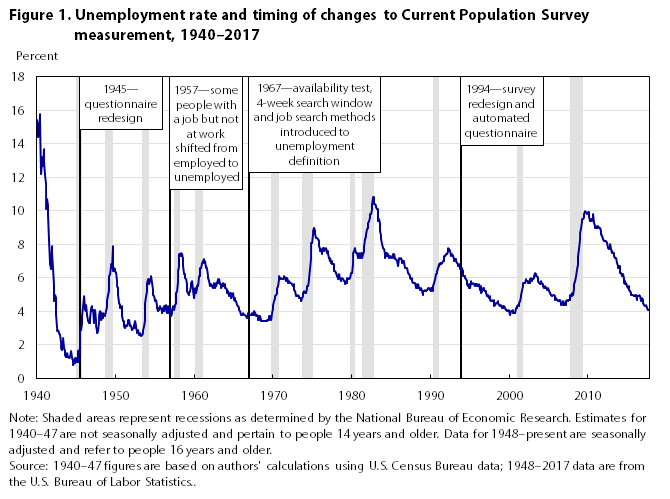
The first unemployment figures were released in an internal memorandum, just a few weeks after data collection.8 (See figure 1 for the full history of CPS-based unemployment rates.) At this point, to be classified as unemployed, a person had to be without work and seeking a job. Also included among the unemployed in the earliest years of the survey were people who were enrolled in work relief programs. The unemployment rate—the number of unemployed people divided by the number of people in the labor force (the sum of employed and unemployed people)—was still high at about 15 percent in March 1940. This was well below the peak reached during the Great Depression, later estimated to have been around 25 percent.9 At the time the first unemployment figures were released, widespread unemployment was still a concern. However, war in Europe had broken out, and the formal entry of the United States into World War II was less than 2 years away. Ironically, the survey that had initially been built to measure unemployment would quickly be pressed into service to help manage the opposite problem for which it was designed—labor scarcity.
By 1942, with U.S. wartime mobilization well underway, the Monthly Report of Unemployment documented various industrial production issues associated with the war effort. These included economic dislocations, as people, mostly men, left the labor force to report for military service. As the production of war-related materiel surged and the need for depression-era work relief programs quickly faded, the WPA disbanded, and the Census Bureau took charge of the household survey in August 1942. The name of the survey was then changed to Monthly Report on the Labor Force, a title that more broadly reflected the evolving data needs of policymakers.10
To underscore new wartime concerns about labor scarcity, special questions were added to the CPS about the “potential labor supply,” later referred to as the “labor reserve.” As the jobless rate fell to around 1 percent, concerns shifted away from high unemployment to discussion about how unemployment could not get below some “irreducible minimum.” At this time, the household survey data revealed the growing participation of women and youth in the labor force as a critical part of industrial production. Indeed, the majority of the labor reserve was made up of women, mostly “housewives.” With the end of the war, however, large-scale cutbacks in the production of war-related supplies, plus the return of soldiers to civilian life, raised concerns about the reemergence of the problem that had given root to the survey—mass unemployment—which never materialized.11
Apart from revamping the questionnaire in 1945 to better capture marginal or secondary employment activities, the Census Bureau made no major changes to the survey in its early years, and the unemployment definition remained the same.12 However, in 1947–48, the name of the survey was changed to the Current Population Survey (its current name), a title that better reflected the expanding role of the survey in collecting more than just labor force data.13 The survey’s first major interagency review, conducted in 1948 by the Bureau of the Budget’s Interagency Committee on Labor Supply, Employment, and Unemployment Statistics, made no major recommendations for change.14
It is worth noting that the seeds of the first regular CPS supplement were sown in 1948. Two questions were added in April of that year to gather information on the earnings and income received in calendar year 1947. The income-related questions expanded dramatically in scope and detail over the years, and this yearly supplement would eventually become known as the Annual Social and Economic Supplement (ASEC).15 It could be argued that the success and popularity of these two (and other early) supplemental questions helped pave the way for future supplements on a much wider array of topics.16
With the Great Depression and World War II over, the U.S. economy entered a period of long-term economic growth, and the unemployment rate hovered around 4 percent during the early 1950s. This long-term trend, however, was interrupted by several business-cycle contractions, resulting in a demand for more and higher quality data on the job market. All of this kept the household survey concepts and methods, as well as other economic indicators, under review by interagency committees. This oversight, in turn, contributed to some minor definitional changes during the decade.
The most important changes stemming from these reviews were made in January 1957, following the recommendations from an interagency subcommittee that had met in 1954–55.17 The subcommittee recommended that two small groups of people—specifically, those “with a job but not at work” due to a temporary layoff for less than 30 days and those waiting to begin a new job within 30 days—be shifted from the employed to the unemployed classification. This change was made because their attachment to an employer was too tenuous to warrant inclusion among those who had a job. Additionally, for those on temporary layoff, the subcommittee suggested that classifying them among the unemployed would improve the macroeconomic sensitivity of the unemployment measure. The committee also believed that these new definitions were more consistent with estimates from the unemployment insurance (UI) system. (The differences in the number of employed and unemployed due to these definitional shifts were not large enough to constitute a break in series.)18
One conceptual issue that surfaced in discussions of unemployment during the 1940s and 1950s was the classification of people who were not looking for work because of the “belief that no work was available in their line of work or community.” Technically, these people did not meet the activity test for unemployment. Although the survey questionnaire typically did not ask people why they did not look for work, interviewers were instructed to classify individuals who volunteered this information as unemployed. This subjectivity would later be debated in comprehensive reviews of labor statistics in the early 1960s and the late 1970s.19
In terms of understanding the data collected from the CPS, one facet of time-series data on the labor force and its components that challenged early analysts was the underlying seasonality in the measures. Large fluctuations in employment and unemployment levels during the course of the year made it difficult to detect underlying economic movements in the data. (Employment in agriculture at the time was a much larger share of overall employment than it is today: about 1 in 5 workers in the early 1940s compared with fewer than 1 in 50 workers now.) The large seasonal swings in survey data led analysts at the WPA to abandon the calculation of the unemployment rate and replace it with a ratio of unemployment to the population. The goal was to produce a more stable metric for monthly comparisons.20 What was really needed, however, was seasonally adjusted data on unemployment (which first became available in the mid-1950s). The purpose of seasonal adjustment was to remove regular seasonal variations in the data so that underlying changes in data trends, especially month-to-month comparisons, could be observed. At first, computations needed to “smooth” the data were done by hand, and this limited the number of series that could be adjusted for seasonal patterns. With the advent of computers, however, the volume of seasonally adjusted data from the survey expanded greatly.21
Another issue that persisted through the period had to do with which agency should be in charge of the survey. Although the Census Bureau had taken over the household survey in 1942, not everyone had been satisfied with that decision. A number of agencies, including the Bureau of Labor Statistics (BLS), were considered as a new home. After much debate, an agreement was reached to better coordinate both the release and analysis of data on the labor market. In 1959, the analysis and dissemination of household survey data was transferred to BLS—the CPS was, after all, a survey of labor—but the Census Bureau retained responsibility for collecting the data.22
In terms of actual measures of labor market performance, the CPS estimates indicated some troubling signs in the late 1950s. Data showed that the unemployment rate was still above 5 percent at the end of 1959, nearly 2 years after the end of the last recession. Moreover, it had not returned to levels observed in previous recoveries. This relatively high unemployment rate was viewed by some against the backdrop of continued automation in the workplace. With the introduction of mainframe computers, innovation again fueled fears that manual jobs would be lost to machines. These concerns were sufficient for congressional hearings to be held on the subject in both 1955 and 1960.23
By the end of the 1950s, CPS concepts and methods had been thoroughly reviewed and were considered capable of capturing data essential for evaluating the state of the job market and, by extension, the overall economy. To be sure, there was still some dissent on definitional issues regarding the measurement of unemployment. But there was nothing that amounted to a wholesale indictment of survey concepts or the integrity of the economists and statisticians who analyzed and published the data. As the decade came to a close, that was about to change.
Unemployment began to grow again after the onset of a recession in April 1960. The rising unemployment rate again piqued public interest in its measurement. In particular, the September 1961 issue of Reader’s Digest featured an article that claimed definitions and methods had been modified to “magnify the unemployment problem,” thus justifying the need for more government spending and regulation. The author, James Daniel, alleged that BLS deliberately manipulated the data—a claim that garnered a great deal of attention. This increased attention led to a third major review of the sources of labor market data.24
In November 1961, the President’s Committee to Appraise Employment and Unemployment Statistics, chaired by Robert A. Gordon, was charged with evaluating the collection and tabulation of the full range of labor market data being gathered at the time, including the labor force concepts and published analyses of CPS data. After nearly a year of deliberation, the Gordon Committee issued a 412-page report that concluded that the system of reporting the official employment and unemployment data was in fact objective, scientifically reliable, and free from deliberate manipulation. The Committee also supported and reaffirmed the activity-based concept used to measure unemployment. However, it did suggest several noteworthy changes to the CPS questionnaire.25
With respect to the measurement of unemployment, one problem the Committee found was the potential for interviewers to include among the unemployed those who volunteered (mentioned in passing) that they were not looking for work because they believed there were no jobs available for them (although there was little information on the extent to which this happened). More specifically, the Committee determined that “reliance on subjective attitudes and volunteered information should be minimized.”26
The Committee also recommended other refinements to the CPS concept of unemployment—such as an explicit timeframe to define current job-search activity and an emphasis on the specific steps taken to find work. It also advocated collecting additional information on people not in the labor force. Following these recommendations, BLS and the Census Bureau developed questions to measure the new criteria and designed a research sample, called the Monthly Labor Survey (MLS), to test these questions. The MLS was administered beginning in April 1964. After more than 2 years of testing, many Gordon Committee recommendations were implemented in January 1967.27
Notably, the unemployment concept, which had generally included people who had no job but were seeking work, was tightened by incorporating two new criteria: an availability test and an explicit 4-week job-search period. The availability test required a person actually be available for work at the time of the survey to be counted as unemployed. The 4-week job-search window introduced a defined period during which job search must have occurred. The latter criterion was introduced to ensure consistency across all respondents—previously, the job-search window was not specified in the questionnaire.28
The Gordon Committee wanted the unemployed to have tested the job market in a reasonably recent period, but they did not feel strongly about what that period should be. Addressing this recommendation, BLS settled on a period longer than 1 week because job search could include periods of inactivity and waiting. The 4-week period was chosen because it indicated a recent search that lined up rather well with the CPS measurement of employment (which classified as employed anyone who worked at least 1 hour for pay or profit in the previous week) and also allowed for the ebb and flow of job search.29
At the Committee’s recommendation, a question was also added about job-search methods: “What has…been doing in the last 4 weeks to find work?” The purpose of the question was to ensure that those included among the unemployed were people making specific efforts to find work.30
In addition, new interviewer instructions excluded from the unemployed those who volunteered that they were not looking for work because they were discouraged—whittling away at some of the remaining subjectivity that existed in the measurement of unemployment. New questions were also introduced at the Committee’s recommendation to capture data on the labor force attachment of people who were neither working nor looking for work. These questions included asking whether these individuals wanted to work now and the reason they were not currently looking for work.31
With the implementation of the Gordon Committee’s recommendations in 1967, the unemployed now included those who had no job during the survey reference week, but who had actively looked for work in the 4 weeks prior to the survey and were available to take a job if one were offered (people on temporary layoff continued to be classified as unemployed whether or not they were looking for work). People who wanted a job but did not look for work because they thought no work was available for them would no longer be included among the unemployed, but instead were counted among those not in the labor force, as “discouraged workers.”
Early on in the history of the survey, some saw the unemployment rate as an indicator of economic hardship.32 Some critics thought the official estimate of unemployment did not adequately measure hardship. They argued that the estimate was too high and that not all who wanted or looked for work were truly experiencing hardship. It was claimed that many unemployed people, such as housewives, students, or recent high school graduates, were not “in need” of a job. After weighing this consideration, the Gordon Committee concluded that unemployment could be only an indirect measure of hardship, because although work is related to personal income, hardship is more directly associated with family income. The Committee determined that the CPS provides a wealth of related statistics that reveal the relationship between joblessness and hardship, including estimates of family income from the CPS March supplement (now known as the ASEC). The Committee stressed that no one number can capture the intricacies of economic hardship encompassed in labor market difficulties.33
The income data collected in the ASEC became even more important beginning in 1965, when Mollie Orshansky at the Social Security Administration developed the first official poverty line, the level of income below which a person is considered poor.34 Coupled with this threshold, CPS ASEC data were used to publish a key metric of economic hardship—the poverty rate.35
Beginning in the 1970s, CPS data were used to achieve another goal established by the Gordon Committee—estimating comparable unemployment figures for subnational areas. While state and local estimates of unemployment were already being published, these estimates were not produced by BLS. Further, they were based mostly on administrative data from the UI system, and they did not correspond to the unemployment concept used in the CPS.
The Committee was critical of the validity of these estimates, and independent studies confirmed biases and inaccuracies in estimation procedures. In 1972, the Office of Management and Budget (OMB) transferred the responsibility for subnational unemployment estimates to BLS. In November 1973, BLS began using CPS data, with other inputs, to produce the state and local area unemployment estimates. The objective of this innovation was twofold: (1) to introduce more conformity between the national CPS estimates and the subnational estimates and (2) to achieve more consistency in procedures among the states.36
Before the 1970s, conventional economic theory suggested that the unemployment rate and inflation had an inverse relationship. During the 1970s, this relationship appeared to “break.” After increasing gradually through the 1950s and 1960s, inflation increased rapidly in the early 1970s—driven in part by the October 1973 oil crisis—while the unemployment rate rose markedly. The unemployment rate reached 9.0 percent in May 1975, when inflation hovered around 10 percent, contradicting the economic theory of the day.37 This economic puzzle gave birth to a new concept—stagflation—a phenomenon where inflation and unemployment rise in tandem. Stagflation, in turn, drove the economist Arthur Okun to invent the “discomfort factor,” later called the “misery index”—the sum of the unemployment rate and the annual inflation rate.38
With inflation and unemployment both running high in the 1970s, economic indicators were receiving more attention from both the public and President Nixon’s administration. In February 1971, tensions surfaced between the administration and BLS. At issue was a discrepancy between the way BLS characterized a 0.2-percentage-point decline in the unemployment rate—as “marginally significant” during a press briefing—and the Secretary of Labor’s characterization that it was “of great significance.” A similar disagreement followed the next month when the Secretary called a similar decline in the unemployment rate “heartening,” but BLS described it as “sort of mixed” in light of other labor market indicators. Consequently, the administration terminated BLS press briefings, prompting allegations of politicization, congressional hearings and reports, and investigations by statistical associations and the Industrial Relations Research Association. Following these frictions, in July 1971, a third incident stirred tensions between the administration and BLS: a technical error in seasonal adjustment of the June data led to a relatively large correction, reducing the originally published decline in the unemployment rate by half.39
This friction between the administration and BLS culminated in an OMB directive for a reorganization of federal statistical agencies, which led to further accusations of politicization. To maintain the statistical system’s credibility, OMB issued a series of directives during the 1970s and early 1980s to combat the potential for politicization.40 By 1985, several guidelines regarding Principle Federal Economic Indicators, including the unemployment rate, had been codified in OMB Statistical Policy Directive 3. This directive established new procedures for announcing news-release schedules in advance, restricting prerelease access to data, prohibiting related policy commentary until 1 hour after the statistical release, and announcing changes in data collection, analysis, or estimation methods in advance.41
For much of the survey’s history, some have suggested a need for a range of alternative indicators of unemployment and labor underutilization that would paint a more complete picture of joblessness and labor-market-related hardship.42 In 1976, BLS addressed this concern. Commissioner Julius Shiskin introduced seven alternative measures—U-1 through U-7—because “no single way of measuring unemployment can satisfy all analytical or ideological interests.”43 While public debate about labor force concepts and definitions stirred, these new alternatives packaged CPS data in different ways to meet varying viewpoints about what should and should not be included in the definition of unemployment. Measures U-1 through U-4 were introduced to assuage those still convinced that the Reader’s Digest article from 1961 was correct in that unemployment was defined too broadly. For their part, measures U-6 and U-7 were introduced to satisfy those who believed the official definition of unemployment (identified at the time as U-5) overlooked people who had stopped looking for work and those who were “partially unemployed.”44 In the end, regardless of how narrowly or broadly one defined unemployment, none of these alternatives had (or has) an advantage in terms of cyclical analysis. This remains true even after the 1994 CPS redesign introduced a new range of alternative indicators. The new measures, U-1 through U-6, all exhibit very similar trends during both recessions and recoveries.45
In addition to fueling tension between the administration and BLS, the high unemployment rates during the recessions of the early 1970s once again revived doubts about the relevancy and objectivity of the unemployment rate.46 Despite previous reviews, a fourth major review of labor market statistics from various surveys was organized in 1976 as the National Commission on Employment and Unemployment Statistics, chaired by Sar A. Levitan. Changing economic trends, such as women’s increasing participation in the labor force and new social policy initiatives, helped stir this new debate over the adequacy of labor force concepts and methods. Again, the main debate regarding CPS data centered on how broadly unemployment should be defined and whether it should be a measure of economic hardship.47
After 2 years of deliberation, the Levitan Commission found the main labor force definitions were sound and praised the general integrity and objectivity of BLS. While making only minor recommendations about the concepts of employment and unemployment, the Levitan Commission did recommend more substantive changes to the measurement of labor market discouragement. The Commission also recommended that the scope of the survey be expanded beyond the civilian population, to include the Armed Forces. The argument was that the Armed Forces should be represented in labor force statistics because, after the draft was eliminated in 1973, workers could choose between military and civilian employment. Further, the Commission found a need for even more demographic detail on people who faced challenging labor market conditions.48
Overall, the Commission found no major problems with the definition of unemployment as it stood, but recommended changes at the margins to further tighten the measure. At the time of the review, interviewers were instructed to count as unemployed people who volunteered they were participating in a paid work experience program or were enrolled in a job training program but were not seeking work. (While there were no estimates of the number of program participants who were classified as unemployed, evidence at the time suggested that few program participants volunteered this information.) As with previous reviews, the Commission reverted to the activity test and recommended that people in work experience programs who were receiving a form of pay be counted among the employed. Additionally, the Commission recommended that people in job training programs be treated as were other students—that is, classified as not in the labor force if they were not actively seeking work. To adhere more strictly to the activity concept, these changes again modified interviewer instructions, but they did not alter the definition of unemployment. The unemployed were still people without jobs who were actively seeking a job and were available to begin work.49
During this review, the issue of how to classify discouraged workers arose again. Like the Gordon Committee, the Levitan Commission decided it was appropriate to exclude these people from the count of the unemployed. After analyzing trends in labor market movements under changing economic conditions, the Commission concluded that the measure was not as strong an indicator of potential labor supply as some had previously argued it was. Further, the measure of discouraged workers was not considered to be as objective as the measure of unemployment.50
After confirming that the discouraged should not be counted among the unemployed, the Commission zeroed in on the reliability of the discouraged-worker measure. It pointed out that the current construct did not test an individual’s availability for, or their willingness to, work. As a result, the Commission recommended the concept of discouraged workers be refined to include only those who had demonstrated some attachment to the labor market, as evidenced by a job search in the recent past.51
Like the Gordon Committee, the Levitan Commission debated the idea of unemployment as a measure of hardship. In their deliberations, they recognized a complex relationship between labor force status and economic hardship. They pointed out that, since the Gordon Committee last weighed the issue in the early 1960s, income-support programs had further weakened the relationship between unemployment and economic hardship. Additionally, they considered that employment did not necessarily guarantee that a family could live above the poverty threshold. Because of this complex relationship, the Commission agreed that the unemployment rate’s greatest value was as a cyclical indicator, but that accompanying data could be used to measure hardship. In this regard, they recommended an annual report linking labor market status to poverty with the use of ASEC income data and the poverty threshold.52 BLS subsequently issued the Linking Employment Problems to Economic Status report that linked earnings and income data for 1979 to three specific labor market experiences that could cause people to experience economic hardship: employment with low wages, unemployment, and low labor force participation. This report was later replaced by A Profile of the Working Poor.53
In the early 1980s, there were back-to-back recessions associated with especially large job losses in manufacturing. The unemployment rate reached a high of 10.8 percent in November 1982. The double-dip recession, along with structural factors such as automation and import competition, disproportionately affected manufacturing industries (most notoriously steel mills). This fueled a fear that workers with long tenures and relatively high pay would lose their jobs and be unable to find similar work.
This concern triggered interest in data on workers who were displaced from their jobs, prompting the collection of such data in a biennial supplement to the CPS. This supplement tallied workers who lost or left jobs because their plant or company closed or moved, because there was insufficient work for them to do, or because their position or shift was abolished. A key metric calculated from these data was the reemployment rate, or the percentage of workers who were displaced but were working again at the time of the survey. Reemployment rates from the first survey conducted in 1984 underscored the upheaval that was taking place in manufacturing. While 60.1 percent of all displaced workers who lost or left their jobs since January 1979 had been reemployed in January 1984, that number was considerably lower for those in primary metal manufacturing (the aforementioned steel mills), at 45.7 percent. (It should be noted that displaced workers who were reemployed may not have found work in the same industry.)54
Also in the 1980s, several of the Levitan Commission’s recommendations were implemented. Beginning in 1983, selected labor force statistics included the resident Armed Forces (although they were subsequently removed in the mid-1990s because of data-quality concerns).55 Since the Armed Forces are by definition employed, the unemployment rate including the resident Armed Forces was usually about 0.1 percentage point lower than the civilian rate.56 In 1984, the CPS began classifying unpaid job training participants who were not actively searching for work as not in the labor force and paid job training participants as employed. (See earlier discussion of Commission recommendations.) However, this information was volunteered by so few respondents that there was no measurable effect on labor force estimates.57
Over time, technological advancements continued to change the way people work, as well as the way labor market data were collected and analyzed. Just as computers became more prevalent in all facets of industry in the 1980s, more widespread use of personal computers changed how statistical surveys could be administered and the amount of data that could be collected. As a result, in the late 1980s, computer-assisted telephone interviewing from centralized telephone centers was introduced. Soon thereafter, BLS and the Census Bureau began to develop a fully automated computerized CPS questionnaire that would make its debut in 1994.58
The U.S. economy contracted again in the early 1990s, as business and consumer confidence suffered several setbacks.59 While the increase in the unemployment rate was not as pronounced as in the downturns of the mid-1970s or early 1980s, the unemployment rate continued to climb for 15 months following the official end of the recession, reaching a high of 7.8 percent in June 1992. This was an atypical pattern, as historically the unemployment rate’s peak tended to coincide more closely with the end of the recession.60 Moreover, this recession was characterized by a shift toward “permanent” and more widespread job losses, with white-collar jobs hit hard—particularly in finance, insurance, and real estate industries—areas relatively unaffected in previous recessions.61
Meanwhile, the CPS was on track to undergo a survey redesign in 1994. One goal of the redesign was to enhance the quality of the data by implementing fully automated computer-assisted interviewing. In line with this goal, the CPS became the first monthly federal government survey with fully automated data collection.62 Another focus of the redesign was to revise the questionnaire to obtain more precise and consistent estimates of the labor force. Cognitive research and testing were used extensively to determine question wording and sequence in the new survey instrument. In addition, the CPS redesign implemented many of the remaining recommendations of the Levitan Commission, including modifications to the discouraged-worker measure, which had been deemed too subjective. Finally, an auxiliary, but still important, reason for the redesign was to collect more information about the U.S. population of working age.63
The same technological advancements that made computer-assisted interviewing possible in the redesign also fueled a growing demand for more data. With computer use on the rise, and the expansion of the Internet, researchers were now equipped with the technologies necessary to conduct their own data analyses, and their demand for survey microdata (individual data records) grew. Public-use microdata files had been available since the late 1960s on magnetic tapes, but in the 1990s microdata became available online.64 For the first time, people interested in conducting their own analyses could access CPS microdata through the Internet.
In a search for more objectivity and precision, the measurement of labor force concepts was further sharpened as part of the redesign effort. One such concept was that of discouraged workers, or people outside the labor force who wanted a job but had not looked for work in the past 4 weeks because they believed no jobs were available for them. Until the redesign, individuals were not required to have looked for work at any time in order to be counted among the discouraged. Individuals also were not asked if they were available to work. In line with the Levitan Commission’s recommendation for a more concrete, objective definition of discouraged workers, the availability test was made more explicit by asking whether an individual was free to begin work in the prior week. Moreover, individuals would have to have looked for work in the past year as a way of demonstrating some attachment to the job market. (See earlier discussion of Commission recommendations.)
In addition to tightening the definition of discouraged workers, the redesign introduced a broader group of people who were not in the labor force but were attached to the job market. This group—which came to be known as people marginally attached to the labor force—included not only discouraged workers, but also people who cited nonlabor-market-related reasons for not currently looking for work (such as the need for childcare or school attendance).
Other changes introduced with the 1994 redesign included shifting a small group of people waiting for a job to begin—those who did not look for work in the 4 weeks preceding the survey—from unemployed to “not in the labor force.” This change was made to conform more strictly to an activity-based measure. Refinements were also made to the measurement of several other labor force concepts, including hours of work, people on temporary layoff, reasons for working part time, and earnings.65 In addition, some of the alternative measures of labor underutilization were redefined to take advantage of new information collected in the redesigned survey.
For much of the 1990s, there was relatively little debate about the accuracy and relevance of the unemployment measure used in the CPS. Perhaps this should not be surprising, since unemployment was not as high for most of this period as it had been in earlier years of the survey. During the record-long expansion of the 1990s, the unemployment rate fell to around 4 percent, a level not seen since the late 1960s. While the economy contracted again in early 2001, the downturn was shallow by historical standards, with the unemployment rate climbing to 6.3 percent in June 2003. Yet, as in the early 1990s, the job market was slow to recover, again with a “jobless recovery” and a lagged peak in the unemployment rate.66
In 2005, the CPS was used to quickly obtain information on the labor market in the aftermath of Hurricane Katrina, one of the deadliest and most calamitous hurricanes to hit the United States. The storm severely affected the Gulf Coast region, leaving many homeless and without work. Katrina separated thousands of workers from their livelihoods, and the effects rippled across the nation as evacuees from the storm relocated throughout the country. From October 2005 to October 2006, the CPS included questions to identify evacuees and to capture the impact of their diaspora on the labor market. The addition of these questions marked the first time the CPS was modified specifically to gather data on the labor market impact of a natural disaster.67 The questions helped show how many evacuees returned to the area after Katrina, how many were displaced for long periods, and how many were still relocated to new areas. These new data also provided insights into the unemployment picture among those affected by the storm. For example, jobless rates were much lower for evacuees who returned to their homes than for those who relocated.68
In December 2007, the U.S. economy was affected by another crisis: the long-running housing bubble had burst, leading to the onset of what would become the most severe recession in the United States since the Great Depression.69 The CPS provided a wide array of information on the deteriorating labor market conditions during the Great Recession. During this downturn, both the unemployment rate and the number of unemployed rose to levels not seen since the deep downturn of the early 1980s; the unemployment rate peaked at 10.0 percent in October 2009. The median duration of unemployment rose to 25.2 weeks in June 2010, and the number of people unemployed for 6 months or longer (27 weeks or more) reached unprecedented levels—almost half of the unemployed were jobless for 6 months or longer. Further, the proportion of employed people who worked part time for economic reasons, often referred to as involuntary part-time workers, had also reached a record level at 6.7 percent in March 2010.70 The labor force participation rate, already trending down since 2000, began a sharp decline during the contraction. This led critics again to question whether the unemployment rate is an accurate reflection of the employment situation, especially in an economy with dwindling labor force participation.71 There also arose a renewed interest in alternative measures of labor underutilization.
Following the end of the Great Recession,72 the jobless rate trended down from late 2009 through the end of 2017. At the time this article was written, however, several labor market indicators still had not returned to their prerecession levels. Although the number of people unemployed and the unemployment rate had dropped below levels experienced before the recession, the problem of long-term unemployment persisted, and involuntary part-time work remained somewhat elevated. More than 8 years after the end of the recession, about one-quarter of the unemployed were looking for work for 6 months or longer, still high by historical standards, and about 5 million people who wanted full-time work had to settle for part-time work. This, coupled with a prolonged period of low labor force participation rates,73 resulted in continued interest in alternative measures of labor underutilization, since the broader measures were associated with larger groups of people experiencing labor market difficulties.74 The question of how broadly unemployment ought to be defined also reentered the public discourse, as some observers once again challenged the relevance of the official unemployment rate.75
For more than three-quarters of a century, the CPS has been a vital tool for providing information on the state of the job market. While initially designed to obtain data on the employment status of individuals (such as whether or not individuals were employed or unemployed), survey questions have been expanded over the years to capture additional labor market data. Because the CPS is a survey of the population, its data can be cross-classified by a full range of demographic characteristics—including age, gender, race, and educational attainment, to name a few—allowing researchers and policymakers to examine and track the labor market experiences across specific population groups. And it was recognized early on that supplemental questions could be added to the survey on a wide range of topics, some unrelated to the job market.
Despite the vast amount of labor market data the CPS captures, people continue to focus mostly on the unemployment rate. Some critics have revived the argument that the unemployment rate is flawed because it is not an all-encompassing measure of labor market conditions and hardship, although it was never intended to be so. Some call for a broader definition of unemployment. In fact, it has been suggested that the job-search requirement for unemployment is far too stringent—ironically, circling the discussion back to the measurement issues that resulted in the survey in the first place.
These arguments about the relevance and reliability of labor force concepts are not new or even particular to the current economic climate. During the survey’s history, such questions led to several wholesale reviews of CPS concepts. In fact, the definition of unemployment has been tightened at the margins after each review. However, these reviews also concluded that, fundamentally, the measure was objective and reliable. Hence, the basic concept has remained largely intact—the unemployed are people who are not working, but are currently looking for work and are available to take a job—and the historical comparability of the unemployment rate has been preserved. In the end, it is only by studying the full range of information collected on the job market—not just from the CPS, but also from various other data sources—that one can accurately assess the health of the labor market and the overall state of the U.S. economy.
Megan Dunn, Steven E. Haugen, and Janie-Lynn Kang, "The Current Population Survey—tracking unemployment in the United States for over 75 years," Monthly Labor Review, U.S. Bureau of Labor Statistics, January 2018, https://doi.org/10.21916/mlr.2018.4
1 The CPS is a sample survey of about 60,000 eligible households (in 2017) scientifically selected to reflect the entire U.S. civilian noninstitutional population. On the basis of responses to a series of questions on work and job search activities, each person 16 years and over in a sample household is classified as employed, unemployed, or not in the labor force.
2 One of the biggest and most persistent misconceptions about the official U.S. unemployment rate has been that it is based on the number of people who receive unemployment insurance benefits. Although the United States has a federal–state unemployment insurance system that provides data on the number of people applying for and receiving unemployment insurance benefits, this system was still being developed during the 1930s. Even with the comprehensive program in place today, these administrative data cannot be used to estimate total unemployment, in part because not all unemployed people are eligible for benefits and not all who are eligible apply for benefits. The activity concept used in the CPS enables a broader measure of unemployment.
3 Many early surveys administered questions on unemployment to people who had been identified as “gainful workers,” that is, those who had some paid work experience in a particular occupation. There were a number of limitations associated with the gainful-worker measure, not the least of which was that it did not account for recent entrants into the job market who had not yet become established in any particular field. Plus, if no time period was specified in the survey, it often was not clear if the person was currently a gainful worker. See Douglas Greenwald, ed., “Employment and unemployment,” The McGraw-Hill encyclopedia of economics (New York: McGraw-Hill, 1994); and Philip M. Hauser, “The labor force and gainful workers—concept, measurement, and comparability,” American Journal of Sociology, vol. 54, no. 4, January 1949, pp. 338–355.
4 See John N. Webb, “Concepts used in unemployment surveys,” Journal of the American Statistical Association, vol. 34, no. 205, March 1939, pp. 49–59; Louis J. Ducoff and Margaret J. Hagood, “Labor force definition and measurement,” Bulletin 56 (Social Science Research Council, 1947); Gertrude Bancroft, “History and development of the labor force concepts,” Technical Paper 4, TA-OEEC-105 (U.S. Department of Commerce, Bureau of the Census, 1952); “Concepts and methods used in the current labor force statistics prepared by the Bureau of the Census,” Current Population Reports, Series P-23, No. 2 (U.S. Department of Commerce, Bureau of the Census, 1954); and Seymour L. Wolfbein, Employment and unemployment in the United States: a study of the American labor force (Chicago, IL: Science Research Associates, 1964).
It should be noted that not everyone was enamored with the activity test for quantifying the number of unemployed. See, for example, Clarence D. Long, “The Concept of Unemployment,” The Quarterly Journal of Economics, vol. 57, no. 1, November 1942, pp. 1–30. Some years later, Russ Nixon took issue with the exclusion (at that time) of people on temporary layoff and others from the official unemployment count. See Russ Nixon, “Correction of Census Bureau estimates of unemployment,” The Review of Economics and Statistics, vol. 32, no. 1, February 1950, pp.
For a more recent discussion of the evolution of U.S. unemployment statistics in the context of economic theory, see David Card, “Origins of the unemployment rate: the lasting legacy of measurement without theory,” The American Economic Review, vol. 101, no. 3, May 2011, pp. 552–557, https://www.aeaweb.org/articles?id=10.1257/aer.101.3.552.
Also note that today’s cognitive researchers have something to say about the quest for objectivity in surveys: objective measures are well defined and can be observed; subjective measures, on the other hand, are broader and have at least some implicit components that are unobservable and are therefore more susceptible to cognitive bias. See Salar Jahedi and Fabio Mendez, “On the advantages and disadvantages of subjective measures,” Journal of Economic Behavior and Organization, vol. 98, 2014, pp. 97–114.
5 See Sampling procedures and method of operation of the WPA Monthly Report of Unemployment (Work Projects Administration, Division of Research, Labor Market Research Section, October 1941); Joseph W. Duncan and William C. Shelton, “U.S. government contributions to probability sampling and statistical analysis,” Statistical Science, vol. 7, no. 3, August 1992, pp. 320–338; and Morris H. Hansen, “Some history and reminiscences on survey sampling,” Statistical Science, vol. 2, no. 2, May 1987, pp. 180–190.
6 Some sources cite April 1940, rather than March, as the start date of the survey. The reference period for the first “production” survey was March 24–30, so the first estimates were typically assigned to March. In fact, no data were collected for April 1940; the next collection was for May. The Census Bureau later developed figures for April by interpolating between March and May 1940. See The Labor Force Bulletin, LFB 5 (U.S. Department of Commerce, Bureau of the Census, November 1944), p. 8.
7 See “Employment and labor conditions: WPA unemployment estimates,” Monthly Labor Review, vol. 53, no. 4, October 1941, pp. 893–902; Gertrude Bancroft, “Current Unemployment Statistics of the Census Bureau and some alternatives,” The Measurement and Behavior of Unemployment (National Bureau of Economic Research, 1957), pp. 63–122; Raymond T. Bowman and Margaret E. Martin, “Special report on unemployment statistics: meaning and measurement,” The American Statistician, vol. 16, no. 4, October 1962, pp. 14–22. Early comparisons of the two data sources can be found in “Changes in employment, unemployment, and the labor force between June and July 1941,” Monthly Report of Unemployment, internal memorandum (Work Projects Administration, August 1941). See also John E. Bregger, “The Current Population Survey: a historical perspective and BLS’ role,” Monthly Labor Review, June 1984, pp. 8–9, https://www.bls.gov/opub/mlr/1984/06/art2full.pdf.
8 After a few months of testing, the results of the first “production” survey were issued by the WPA in an internal “confidential memorandum” dated April 26, 1940, which referenced work-related activity for the week of March
9 For discussion of annual unemployment estimates for the 1930s (prior to the inception of the monthly sample survey), see Stanley Lebergott, “Labor force, employment, and unemployment, 1929–39: estimating methods,” Monthly Labor Review, July 1948, pp. 51–53. Some researchers later took issue with Lebergott’s methods; see, for example, Michael R. Darby, “Three-and-a-half million U.S. employees have been mislaid: or, an explanation of unemployment, 1934–41,”Journal of Political Economy, vol. 84, no. 1, February 1976, pp. 1–16.
10 Monthly Report on the Labor Force, No. 1 (U.S. Department of Commerce, Bureau of the Census, September 6, 1942).
11 See “The nation’s available labor reserve,” Monthly Report on the Labor Force, No. 7 (U.S. Department of Commerce, Bureau of the Census, November 1942); Monthly Report on the Labor Force, No. 10 (U.S. Department of Commerce, Bureau of the Census, April 4, 1943); and “Employment status of the civilian noninstitutional population, 1941 to date” (U.S. Bureau of Labor Statistics), https://www.bls.gov/cps/aa2011/cpsaat01.pdf.
12 The original survey undercounted “marginal” or “secondary” employment activity, especially among women and youth. Before the introduction of the revised survey in July 1945, the number of employed was estimated on the basis of one question regarding whether respondents were at work on a private or government job. With the introduction of the revised questionnaire, people were first asked about their main activity during the survey week. Respondents who reported something other than work were then asked if they had done any work for pay or profit during the reference week. The use of these two questions resulted in more reported employment activity, consistent with the results of the April 1945 pretest. See Gertrude Bancroft and Emmett H. Welch, “Recent experience with problems of labor force measurement,” Journal of the American Statistical Association, vol. 41, no. 235, September 1946, pp. 303–212; and “Labor force, employment, and unemployment in the United States,
13 The survey questionnaire first used the name Current Population Survey (CPS) in 1947; the published news releases first made reference to the CPS in 1948. A. J. Jaffe notes that the name Current Population Survey was adopted because, over time, it eventually became “in effect a monthly sample census.” See A. J. Jaffe, “One consumer’s view of the Current Population Survey,” The American Statistician, vol. 8, no. 1, February 1954, pp.
14 See Employment and unemployment statistics, hearings before the Subcommittee on Economic Statistics of the Joint Committee on the Economic Report, 84th Congress, 1st session, November 7 and 8, 1955, Committee Print 69272 (U.S. Government Printing Office, 1955), p. 8.
15 See “Measuring 50 years of economic change using the March Current Population Survey,” Current Population Reports, Series P-60, No. 203 (U.S. Department of Commerce, Bureau of the Census, 1998), appendix B.
16 Given that the CPS was a timely survey of the population at large, CPS supplements became quite popular over time. Several supplements were introduced that covered topics that had little to do with the job market. Examples include regular supplements on tobacco use, participation in the arts, and fertility.
17 These recommendations came from the Review of Concepts Subcommittee of the Bureau of the Budget’s Interagency Committee on Labor Supply, Employment, and Unemployment Statistics. See Employment and unemployment statistics, p. 11.
18 See “The Monthly Report on the Labor Force: February 1957,” Current Population Reports, Series P-57, No. 176 (U.S. Department of Commerce, Bureau of the Census, March 1957), pp. 5–6.
19See Measuring employment and unemployment (President’s Committee to Appraise Employment and Unemployment Statistics, 1962), pp. 50–53. Later on, the Levitan Commission would revisit this debate. See Robert L. Stein, “National Commission recommends changes in labor force statistics,” Monthly Labor Review, vol. 103, no. 4, April 1980, pp. 11, 18. Although these two independent reviews arrived at the same conclusion regarding discouraged workers, some disagreement over how to classify these individuals remains to this day.
20 See “Changes in employment, unemployment, and the labor force between May and June 1941, with estimates for the week June 8–14, 1941,” Monthly Report of Unemployment, Confidential Memorandum A2880 (Work Projects Administration, July 10, 1941), p. 3.
21 See “Seasonal variations in the labor force, employment, and unemployment,” Current Population Reports, Series P-50, No. 82 (U.S. Department of Commerce, Bureau of the Census, April 1958).
22 See 1989 interviews with Seymour Wolfbein and Margaret Martin in the documentary video CPS at 50 (U.S. Bureau of Labor Statistics, 1995), https://www.youtube.com/watch?v=xm-YguK6Mys; and “Margaret Martin: a leader in the Federal Statistical System,” Amstat News, September 1, 2011, http://magazine.amstat.org/blog/2011/09/01/margaretmartin/. See also Joseph P. Goldberg and William T. Moye, The first hundred years of the Bureau of Labor Statistics, Bulletin 2235 (U.S. Bureau of Labor Statistics, September 1985), pp. 187–188, https://www.bls.gov/opub/mlr/1985/07/art1full.pdf; “Construction and labor force statistics,” memorandum for Secretary Strauss and Secretary Mitchell, signed by Mitchell and Strauss on November 18, 1958; and James P. Mitchell, “Operations of the Monthly Report on the Labor Force,” General Order 99 (U.S. Department of Labor, May 18, 1959).
23 See Gladys Roth Kremen, “MDTA: the origins of the Manpower Development and Training Act of 1962” (U.S. Department of Labor, 1974), https://www.dol.gov/general/aboutdol/history/mono-mdtatext; New views on automation, papers submitted to the Subcommittee on Automation and Energy Resources of the Joint Economic Committee, 86th Congress, 2d session, Committee Print 58913 (U.S. Government Printing Office, 1960), https://www.jec.senate.gov/reports/86th%20Congress/Reports%20and%20Other/New%20Views%20on%20Automation%20(168).pdf; and Implications of automation and other technological developments: a selected annotated bibliography, Bulletin 1319 (U.S. Bureau of Labor Statistics, February 1962), https://fraser.stlouisfed.org/files/docs/publications/bls/bls_1319_1962.pdf.
24 See James Daniel, “Let’s look at those ‘alarming’ unemployment figures,” Reader’s Digest, September 1961; and Measuring employment and unemployment, hearings before the Subcommittee on Economic Statistics of the Joint Economic Committee,88th Congress, 1st session, June 6 and 7, 1963, Committee Print 20-288 (U.S. Government Printing Office, 1963), p. 3, http://www.jec.senate.gov/reports/88th%20Congress/Measuring%20Employment%20and%20Unemployment%20(240).pdf.
25 See Measuring employment and unemployment (President’s Committee to Appraise Employment and Unemployment Statistics, 1962), p. 3.
26 See ibid., pp. 14–15.
27 See Robert L. Stein, “New definitions for employment and unemployment,” Employment and Earnings and Monthly Report on the Labor Force, vol. 13, no. 8 (U.S. Bureau of Labor Statistics, February 1967), p. 4.
28 See Measuring employment and unemployment (President’s Committee to Appraise Employment and Unemployment Statistics, 1962), pp. 50–53.
29 See Stein, “New definitions for employment and unemployment,” pp. 5–6.
30 See ibid.
31 See ibid., p. 6.
32 As discussed in Bancroft, “Current unemployment statistics of the Census Bureau and some alternatives,” pp. 64, 87.
33 See Measuring employment and unemployment (President’s Committee to Appraise Employment and Unemployment Statistics, 1962), pp. 33–37.
34 See Mollie Orshansky, “Counting the poor: another look at the poverty profile,” Social Security Bulletin (Social Security Administration, January 1965), pp. 5–10, https://www.ssa.gov/policy/docs/ssb/v28n1/v28n1p3.pdf.
35 See “Poverty” (U.S. Census Bureau), https://www.census.gov/topics/income-poverty/poverty.html.
36 See Local Area Unemployment Statistics program manual (U.S. Bureau of Labor Statistics, 2003), pp. 1-3 and 1-4, https://www.reginfo.gov/public/do/DownloadDocument?objectID=8480401.
37 After World War II, A.W. Phillips developed an oft-cited economic theory represented by the Phillips curve. The Phillips curve suggested there was a negative relationship between unemployment and price change—as unemployment increased, inflation decreased. By 1968, there were already alternative hypotheses (including one by Milton Friedman) about how expectations and time horizons affected the slope of the Phillips curve. In the 1970s, when inflation and unemployment both ran high, the underlying theory of the Phillips curve was challenged. Friedman asserted that stagflation occurred during a transitional period before the public and institutions had adapted to new monetary policy, and resulted from government intervention in price setting. See Milton Friedman, “Inflation and unemployment,” Journal of Political Economy, vol. 85, no. 3, June 1977, pp. 451–472, https://www.jstor.org/stable/pdf/1830192.pdf.
38 See Richard F. Janssen, “The outlook: appraisal of current trends in business and finance,” The Wall Street Journal, January 4, 1971, p. 1. During his presidential campaign in 1980, President Ronald Reagan renamed the index to the “economic misery index.” See Michael C. Lovell and Pao-Lin Tien, “Economic discomfort and consumer sentiment,” Eastern Economic Journal, vol. 26, no. 1, winter 2000, p. 2.
39 See Goldberg and Moye, The first hundred years of the Bureau of Labor Statistics, pp. 222–223.
40 A decade earlier, there was a short-lived concern about politicization when the unemployment rate was leaked to the Washington Post prior to the 1960 presidential election. This was significant at the time because the Secretary of Labor refused to alter the release schedule for October figures before the election. While there was no evidence the leak came from inside BLS, there was still a review of confidentiality procedures. After this review, BLS began to announce release dates for news releases a year in advance. For more information, see Goldberg and Moye, The first hundred years of the Bureau of Labor Statistics, pp. 188–189; and Bernard D. Nossiter, “Delayed report shows rise in unemployment,” The Washington Post, November 5, 1960, p. A1.
41 In the early 1970s, OMB issued a directive requiring written statistical releases and barring related policy statements until at least 1 hour after the release. Another directive restricted access to prerelease data to only the Chairman of the Council of Economic Advisors. OMB issued related statistical guidelines in the 1980s. In 1981, a directive specifically named the Secretary of Labor as an advisor who would not receive access to data until the press receives such access 30 minutes prior to release in a “lockup” facility (with no communication to the outside world). For more information about OMB policy directives and frictions between the White House and BLS, see Goldberg and Moye, The first hundred years of the Bureau of Labor Statistics, pp. 223–226. For information on comprehensive statistical policy guidelines that OMB put in place in 1985, see “Statistical policy directive on compilation, release, and evaluation of Principal Federal Economic Indicators,” Federal Register, vol. 50, no. 186, September 25, 1985, https://www.bea.gov/about/pdf/federalregister09251985.pdf.
42 See Bancroft, “Current unemployment statistics of the Census Bureau and some alternatives,” pp. 84–97; and Robert L. Stein, “Unemployment rates from the household survey—definitions, uses, and limitations,” Employment and Earnings (U.S. Bureau of Labor Statistics, February 1963), pp. iv–ix.
43 See Julius Shishkin, “Employment and unemployment: the doughnut or the hole?” Monthly Labor Review, February 1976, https://www.bls.gov/opub/mlr/1976/article/pdf/employment_and_unemployment_the_doughnut.pdf.
44 People who work part time for economic reasons have sometimes been referred to as “partially unemployed,” especially during the early years of the survey. Another topic of disagreement between economists during the history of the CPS has been whether to include this group of workers among the unemployed. This was debated during the 1954–55 review, by the Gordon Committee, and by the Levitan Commission. Each review affirmed the value of collecting data on people who were working part time for economic reasons (those who would prefer full-time work, but were working part time either because of business conditions or because they could not find full-time work). They also determined that including these people among the unemployed would “make estimates of employment meaningless” (as stated by the Gordon Committee) and that the estimates of this type of part-time employment were adequate both to convey labor market troubles and as a cyclical indicator. See Employment and unemployment statistics, pp. 162–166; Measuring employment and unemployment (President’s Committee to Appraise Employment and Unemployment Statistics, 1962), p. 56; and Counting the labor force (National Commission on Employment and Unemployment Statistics, 1979), pp. 51, 54–55, 102.
45 Changes to the CPS due to the 1994 redesign affected inputs to several of the U-1 through U-7 measures, resulting in the discontinuation of the original alternative measures with the publication of data for December 1993. In October 1995, BLS replaced the previous U-1 through U-7 range with alternative measures of labor underutilization, U-1 through U-6. See Steven Haugen, “Measures of labor underutilization from the Current Population Survey,” Working Paper 424 (U.S. Bureau of Labor Statistics, March 2009) pp. 10–11, https://www.bls.gov/osmr/research-papers/2009/pdf/ec090020.pdf.
46 See John E. Bregger, “Establishment of a new Employment Statistics Review Commission,” Monthly Labor Review, March 1977, p. 14.
47 See Counting the labor force, pp. 26–27.
48 See ibid., pp. 2–4, 7, 17.
49 See ibid., pp. 2–5.
50 See ibid., p. 3.
51 See ibid.
52 See ibid., pp. 57–63.
53 See Bruce W. Klein and Philip L. Rones, “A profile of the working poor,” Monthly Labor Review, October 1989, https://www.bls.gov/OPUB/MLR/1989/10/art1full.pdf.
54 Data on displaced workers have been collected through a special supplementary survey conducted every 2 years since 1984. Displaced workers are defined as people 20 years of age and older who had tenures of at least 3 years with an employer and lost or left jobs because their plant or company closed or moved, there was insufficient work for them to do, or their position or shift was abolished. For additional information on displaced workers, see https://www.bls.gov/cps/lfcharacteristics.htm.
55 Estimates of the resident Armed Forces came from administrative sources within the Department of Defense and were affected by lags in the availability of information, changes over time in administrative practices for the classification of military personnel as resident or nonresident, and variations in those practices among the branches of the services. The impact of these factors on the data was greatly exacerbated during the Persian Gulf deployments associated with Operation Desert Storm in the early 1990s, and publication of these estimates in the Employment Situation news release was discontinued after May 1991. See Gloria Peterson Green, “Revisions in the presentation of data in Employment and Earnings,” Employment and Earnings (U.S. Bureau of Labor Statistics, February 1994).
56 Including the Armed Forces in the unemployment rate would increase only the denominator—the labor force—resulting in a slightly lower unemployment rate.
57 See Harvey R. Hamel and John T. Tucker, “Implementing the Levitan Commission’s recommendations to improve labor data,” Monthly Labor Review, February 1985, p. 19, https://www.bls.gov/opub/mlr/1985/02/art2full.pdf.
58 See Cathryn Dippo, Anne Polivka, Kathleen Creighton, Donna Kostanich, and Jennifer Rothgeb, “Redesigning a questionnaire for computer-assisted data collection: the Current Population Survey experience” (U.S. Department of Labor and U.S. Census Bureau, 1994), pp. 4–5, https://www.bls.gov/osmr/research-papers/1994/pdf/cp940020.pdf; J. Bregger et al., “Report of the BLS–Census Bureau Questionnaire Design Task Force,” staff report (U.S. Bureau of Labor Statistics, November 1986); and Chester E. Bowie, Lawrence S. Cahoon, and Elizabeth A. Martin, “Overhauling the Current Population Survey: evaluating changes in the estimates,” Monthly Labor Review, September 1993, https://www.bls.gov/opub/mlr/1993/09/art3full.pdf.
59 For example, see Kenneth J. Robinson, “Savings and loan crisis: 1980–1989,” Federal Reserve History (Federal Reserve Bank of Dallas, 2013), https://www.federalreservehistory.org/essays/savings_and_loan_crisis; Donald Bernhardt and Marshall Eckblad, “Stock market crash of 1987,” Federal Reserve History (Federal Reserve Bank of Chicago, November 2013), https://www.federalreservehistory.org/essays/stock_market_crash_of_1987; Philip Verleger, Jr., “Understanding the 1990 Oil Crisis,” The Energy Journal, vol. 11, no. 4, 1990, pp. 15–33; and Carl E. Walsh, “What caused the 1990–1991 Recession?” Economic Review (Federal Reserve Bank of San Francisco, 1993), pp. 34–48, http://www.frbsf.org/economic-research/files/93-2_34-48.pdf.
60 The recession lasted from July 1990 to March 1991, according to the National Bureau of Economic Research, which determines the start and end dates of U.S. recessions on the basis of a range of economic indicators. For a summary of how the labor market fared during and after the 1990–91 recession, see Jennifer M. Gardner, “The 1990–91 recession: how bad was the labor market?” Monthly Labor Review, June 1994, https://www.bls.gov/opub/mlr/1994/06/art1full.pdf.
61 See Steven Haugen, “Recent job losers less likely to expect recall,” Issues in Labor Statistics, Summary 92-8 (U.S. Bureau of Labor Statistics, July 1992); and Christopher J. Singleton, “Industry employment and the 1990–91 recession,” Monthly Labor Review, July 1993, p. 18, https://www.bls.gov/opub/mlr/1993/07/art2full.pdf.
62 In 1987, data collected using computer-assisted telephone interviewing (CATI) were introduced into CPS estimates after about 2 years of testing at the CATI center in Maryland. In 1992, BLS and the Census Bureau began using overlapping CATI and computer-assisted personal interviewing (CAPI) experiments to test the automated versions of the revised questionnaire. For additional information, see Dippo et al., “Redesigning a questionnaire for computer-assisted data collection,” p. 5; and “Design and methodology: Current Population Survey,” Technical Paper 66 (U.S. Bureau of Labor Statistics and U.S. Census Bureau, October 2006), pp. 2–5, https://www.census.gov/prod/2006pubs/tp-66.pdf.
63 See Sharon R. Cohany, Anne E. Polivka, and Jennifer M. Rothgeb, “Revisions in the Current Population Survey effective January 1994,” Employment and Earnings (U.S. Bureau of Labor Statistics, February 1994), p. 14, https://www.bls.gov/cps/revisions1994.pdf.
64 CPS microdata first became available to the public in tape format in 1968. See “The Current Population Survey: design and methodology,” Technical Paper 40 (U.S. Bureau of the Census, 1978), p. 1. With the development of the Census Bureau’s DataFerrett tool in the mid-1990s, data users were able to access CPS microdata through the Internet.
65 For more information on changes to definitions introduced with the 1994 redesign, see Cohany, Polivka, and Rothgeb, “Revisions in the Current Population Survey effective January 1994.”
66 See Marc Labonte and Linda Levine, The “jobless recovery” from the 2001 recession: a comparison to earlier recoveries and possible explanations (Congressional Research Service, August 2004), https://hdl.handle.net/1813/77642.
67 See Lawrence S. Cahoon, Diane E. Herz, Richard C. Ning, Anne E. Polivka, Maria E. Reed, Edwin L. Robison, and Gregory D. Weyland, “The Current Population Survey response to Hurricane Katrina,” Monthly Labor Review, August 2006, https://www.bls.gov/opub/mlr/2006/08/art4full.pdf.
68 See Jeffrey A. Groen and Anne E. Polivka, “The effect of Hurricane Katrina on the labor market outcomes of evacuees,” American Economic Review, vol. 98, no. 2, May 2008, pp. 43–48; Jeffrey A. Groen and Anne E. Polivka, “Hurricane Katrina evacuees: who they are, where they are, and how they are faring,” Monthly Labor Review, March 2008, https://www.bls.gov/opub/mlr/2008/03/art3full.pdf; and Karen Kosanovich, “The labor market impact of Hurricane Katrina: an overview,” Monthly Labor Review, August 2006, https://www.bls.gov/opub/mlr/2006/08/art1full.pdf.
Similar questions were considered for later hurricanes and other natural disasters. However, BLS and the Census Bureau decided not to add questions on disaster-related evacuees from these events because the magnitude of long-term displacements did not appear to be as large as that for Hurricane Katrina.
69 Interest rates were very low during the early 2000s, and consumers were able to easily borrow large sums of money because of lax lending standards. Banks approved risky loans, subprime mortgages failed, and a financial crisis ensued. Banks sought bailouts, and the problem of unemployment began to grow again. For additional information, see John C. Williams, “The Federal Reserve and the economic recovery,” FRBSF Economic Letter (Federal Reserve Bank of San Francisco, January 2012), http://www.frbsf.org/economic-research/publications/economic-letter/2012/january/federal-reserve-economic-recovery/; and Robert Rich, “The Great Recession,” Federal Reserve History (Federal Reserve Bank of New York, November 2013), https://www.federalreservehistory.org/essays/great_recession_of_200709.
70 In 2007, before the recession, around 3 percent of workers were classified as part time for economic reasons, most of whom either had their hours cut back or could only find a part-time job.
71 See, for example, Daniel Indiviglio, “Chart of the day: is the real unemployment rate 12.5 percent?” The Atlantic, August 15, 2011, https://www.theatlantic.com/business/archive/2011/08/chart-of-the-day-is-the-real-unemployment-rate-125/243644/; and Jim Clifton, “The big lie: 5.6% unemployment,” Gallup News, February 3, 2015, http://www.gallup.com/opinion/chairman/181469/big-lie-unemployment.aspx?g_source=Real+unemployment+rate&g_medium=search&g_campaign=tiles.
72 According to the National Bureau of Economic Research, the downturn commonly referred to as the Great Recession officially began in December 2007 and ended in June 2009. See “U.S. business cycle expansions and contractions” (National Bureau of Economic Research), http://www.nber.org/cycles/cyclesmain.html.
73 See, for example, Stephanie Aaronson, Tomaz Cajner, Bruce Fallick, Felix Galbis-Reig, Christopher Smith, and William Wascher, “Labor force participation: recent developments and future prospects,” Brookings Papers on Economic Activity, fall 2014, https://www.brookings.edu/wp-content/uploads/2016/07/Fall2014BPEA_Aaronson_et_al.pdf; James Bullard, “The rise and fall of labor force participation in the United States,” Review (Federal Reserve Bank of St. Louis, first quarter 2014), pp. 1–12, https://files.stlouisfed.org/files/htdocs/publications/review/2014/q1/bullard.pdf; and Mitra Toossi, “Labor force projections to 2024: the labor force is growing, but slowly,” Monthly Labor Review, December 2015, https://www.bls.gov/opub/mlr/2015/article/labor-force-projections-to-2024.htm.
74 Most of the measures of labor underutilization (U-1 through U-6) had increased slightly before the onset of the Great Recession. All measures rose sharply during the recession (2007–09) and increased steadily until 2010, when they started to trend down.
75 See, for example, “H. R. 1876—Real Unemployment Calculation Act,” Congress.gov, April 2015, https://www.congress.gov/bill/114th-congress/house-bill/1876/text; Jon Sarlin, “What is the ‘real’ unemployment rate?” CNNMoney, June 2016, http://money.cnn.com/video/news/economy/2016/06/02/what-is-the-real-unemployment-rate.cnnmoney/; and Justin Fox, “What’s really wrong with the unemployment rate,” Bloomberg, August 10, 2016, https://www.bloomberg.com/view/articles/2016-08-10/what-s-really-wrong-with-the-unemployment-rate.