- Annual Data on Labor Productivity and Related Measures
- Analysis
- Inquiries and Feedback

An official website of the United States government
An official website of the United States government
The .gov means it's official.
Federal government websites often end in .gov or .mil. Before sharing sensitive information,
make sure you're on a federal government site.
The site is secure.
The
https:// ensures that you are connecting to the official website and that any
information you provide is encrypted and transmitted securely.
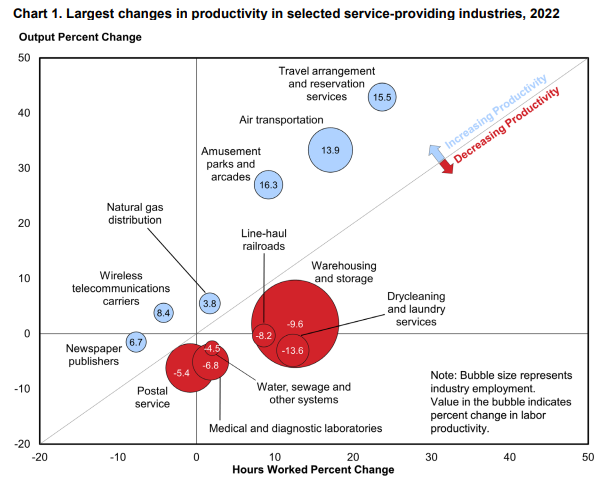
On June 29, 2023, the Bureau of Labor Statistics (BLS) updated measures for 30 detailed industries in Productivity and Costs by Industry: Selected Service-Providing Industries - 2022. Chart 1 from the news release illustrates the six industries with the greatest gains in labor productivity and the six industries with the greatest losses. Two of these industries are featured in the analysis below.
There was a common pattern among service industries during the pandemic. Most industries experienced a 2020 contraction at the height of the pandemic paired with a 2021-2022 recovery. However, this pattern wasn’t followed in all service industries. On this page, we study three service industries that experienced radically different pandemic periods and detail what made them different: radio and television broadcasting, travel arrangement and reservation services, and medical and diagnostic laboratories.
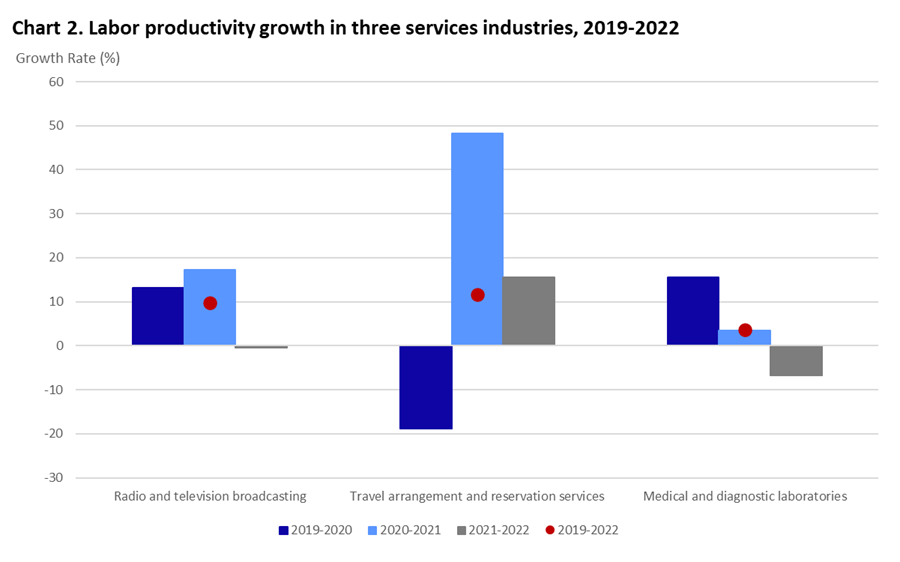
Radio and television broadcasting services had a large annual labor productivity growth of 9.8 percent during the pandemic, from 2019 to 2022. During this period, output increased 5.2 percent annually while hours worked declined 4.2 percent per year.[1] Compared to previous years, productivity grew substantially more in 2020 and 2021 in broadcasting services with output increasing and hours falling. All three measures were nearly stagnant in 2022.
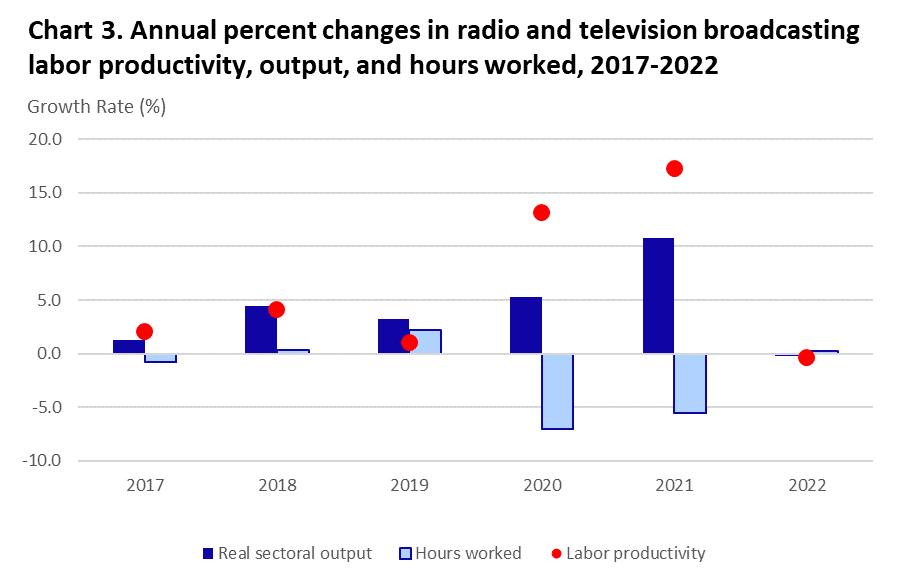
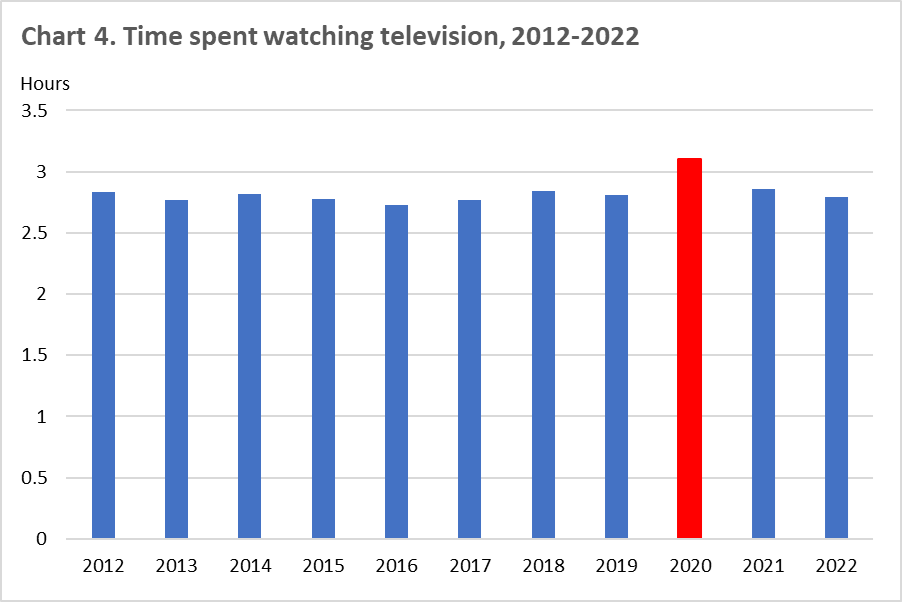
Radio and television broadcasting output grew at 5.3 percent in 2020, the third highest of the 30 selected service-providing industries. From 2012 and 2022, people in the U.S. spent between 2.73 and 2.86 hours per day watching television.[2] In 2020, however, the average daily time spent watching TV jumped to 3.10 hours. The need to social distance meant that watching television was one of the few services people could consume during lockdown.
Lockdowns in 2020 temporarily slowed television production leading to the decrease in hours worked as the number of overall scripted original series declined 7.3 percent to 493 shows in 2020.[3] This decline in series production was the first in more than a decade. Persistent COVID-19 protocols meant that fewer employees were on the set of each production.
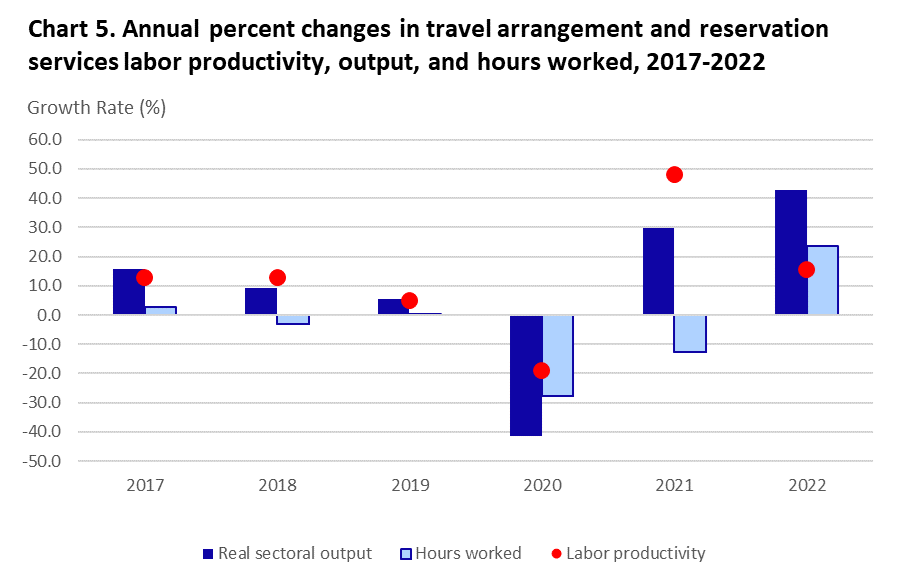
The travel arrangement and reservation services industry also saw large labor productivity growth of 11.6 percent annually during the 2019-2022 pandemic period. Output increased 2.8 percent per year while hours worked decreased annually at 7.9 percent. However, this industry had a much different pandemic period experience than television broadcasters.The travel arrangement and reservation services industry was negatively impacted by wide-spread shutdowns in 2020. Localities shut down lodging and tourist destinations, and consumers were hesitant to travel during a pandemic. Output fell 41.4 percent in 2020, the third largest decline among the 30 selected service-providing industries, outpacing a drop in hours.
Output rebounded 29.7 percent in 2021 as consumers began to return to travel. Hours worked continued to fall (-12.5 percent) as employers struggled to hire workers in a tight labor market. The rebound continued in 2022 as output grew 42.9 percent and returned to pre-pandemic levels.
Like many other service industries, travel arrangement companies reduced their staff at the beginning of the pandemic period. Employment fell 23.9 percent in 2020, the third largest decrease among service industries. Even as business began to pick up, employment still fell 13.1 percent in 2021.
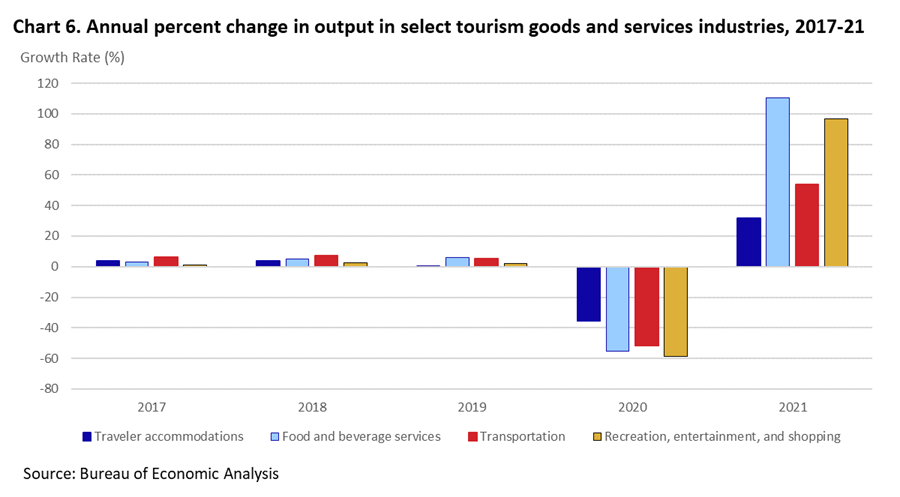
Information from the Bureau of Economic Analysis Travel and Tourism Satellite account shows that real output in traveler accommodations decreased 35.6 percent and transportation decreased 55.2 in 2020. These were the largest drops since the inception of the measures in 1998 and are consistent with BLS's measurement of travel arrangement industry output in 2020.
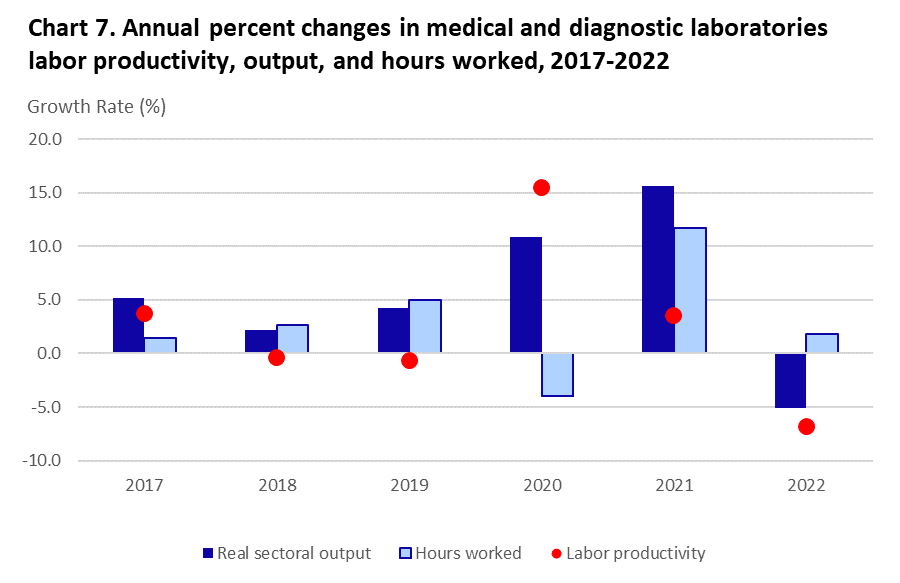
The pandemic caused a short-term increase in demand for medical and diagnostic lab services. Output grew 10.9 and 15.6 percent in 2020 and 2021, the largest industry output growth since 1998. In the decade preceding the pandemic, annual output growth had ranged between -0.2 percent and 5.2 percent.
During the 2019-2022 period, labor productivity grew at an annual rate of 3.7 percent. Output in the medical and diagnostic laboratories industry grew annually at 6.7 percent while hours worked grew 3.0 percent per year.
Starting in 2020, millions of people needed to be tested for COVID-19 regularly. Before vaccines became available, testing oneself before interacting with others was the official policy of organizations and the recommended medical course of action. The federal government passed funding for COVID-19 testing in the 2020 CARES Act so the cost of testing was minimal to customers. Diagnostic labs experienced a large increase in demand, and they responded by opening mobile or temporary labs throughout the US and hiring more lab technicians.
Labs also saw growth in other types of tests. The U.S. Department of Health and Human Services reported that Medicare Part B spending on lab tests increased in 2021 and was driven by higher volume of COVID-19, genetic, and chemistry tests.[4] They noted that spending on chemistry tests, the largest category of testing, increased 10.5 percent. Generic tests increased 56 percent.
Industries at a Glance: Service-Providing Industries
[1] The annual percent change is the compound annual growth rate in an index series over a period of more than one year. The change of an index series varies from year to year. However, the annual percent change is the constant rate that can be applied to each year in a period, from the start to the end, that would give the same total result. It is calculated as (Ending Value/Starting Value)^(1/Number of Years)-1.
[2] Source: Bureau of Labor Statistics, American Time Use Survey (ATUS). Extract the data directly from the BLS Data Retrieval Tool and enter TUU10101AA01014236 for the Series ID.
[3] Source: Hollywood Reporter, Peak TV Climbs Again in 2022, Nearly Reaches 600 Scripted Series
[4] Source: U.S. Department of Health and Human Services, Office of Inspector General, Medicare Part B Spending on Lab Tests Increased in 2021, Driven By Higher Volume of COVID-19 Tests, Genetic Tests, and Chemistry Tests
Last Modified Date: September 28, 2023