An official website of the United States government
An official website of the United States government
The .gov means it's official.
Federal government websites often end in .gov or .mil. Before sharing sensitive information,
make sure you're on a federal government site.
The site is secure.
The
https:// ensures that you are connecting to the official website and that any
information you provide is encrypted and transmitted securely.
21-201-CHI
Wednesday, March 17, 2021
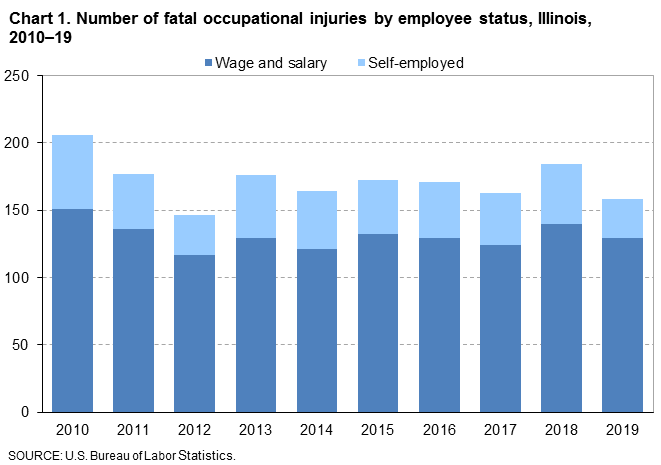
Fatal work injuries totaled 158 in 2019 for Illinois, the U.S. Bureau of Labor Statistics reported today. Regional Commissioner Jason Palmer noted that the number of work-related fatalities in Illinois was down from the previous year. (See chart 1.) Fatal occupational injuries in the state have ranged from a high of 262 in 1996 to a low of 146 in 2012.
Nationwide, a total of 5,333 fatal work injuries were recorded in 2019, a 2-percent increase from the 5,250 in 2018, according to the results from the Census of Fatal Occupational Injuries (CFOI) program. The 5,333 fatal occupational injuries in 2019 represents the largest annual number since 2007.
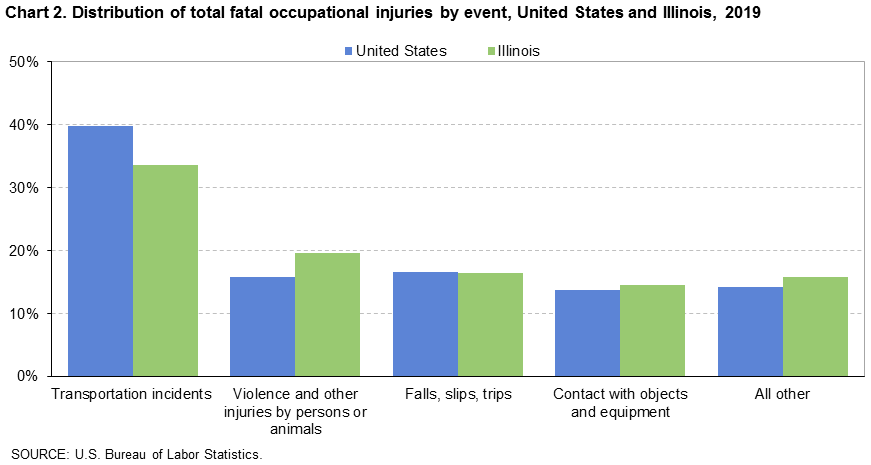
Fatal event or exposureIn Illinois, transportation incidents resulted in 53 fatal work injuries, and violence and other injuries by persons or animals accounted for 31 fatalities. These two major categories accounted for 53 percent of all workplace fatalities in the state. (See table 1.) Worker deaths from transportation incidents were down from 75 over the year, and worker fatalities due to violence or other injuries by persons or animals were up from 26.
Falls, slips, and trips was the third-most frequent fatal work event with 26 fatalities, compared to 25 in the prior year. Contact with objects or equipment resulted in 23 work-related deaths, down from 34 in 2018.
Nationally, transportation incidents were the most frequent fatal workplace event in 2019, accounting for 40 percent of fatal work injuries. (See chart 2.) Falls, slips, and trips was the second-most common fatal event (17 percent), followed by violence and other injuries by persons or animals (16 percent).
The private construction industry had the highest number of fatalities in Illinois with 30. (See table 2.) Transportation incidents resulted in 7 of the 30 fatalities in the industry. The private transportation and warehousing industry had 24 workplace fatalities. The general freight trucking sector accounted for 12, or 50 percent, of this industry's fatal injuries.
OccupationThe transportation and material moving occupational group had the highest number of workplace fatalities with 41. (See table 3.) Heavy and tractor-trailer truck drivers accounted for 22 of the 41 fatalities among transportation and material moving workers. The construction and extraction occupational group had the second-highest number of workplace fatalities with 30. Construction trade workers suffered 24 of the work-related deaths within the construction and extraction occupational group. The management occupational group had 20 workplace fatalities, of which 11 were farmers, ranchers, and other agricultural managers.
Additional highlightsMen accounted for 90 percent of the work-related fatalities in Illinois, compared to the national share of 92 percent. (See table 4.) Transportation incidents made up 32 percent of the fatalities for men in Illinois.
White non-Hispanics accounted for 73 percent of those who died from a workplace injury. Nationwide, this group accounted for 62 percent of work-related deaths.
Workers 25-54 years old accounted for 58 percent of the state’s work-related fatalities in 2019, compared to 55 percent of on-the-job fatalities nationally.
Of the 158 fatal work injuries in Illinois, 82 percent worked for wages and salaries; the remainder were self-employed. The most frequent fatal event for both wage and salary workers and self-employed workers was transportation incidents.
Information in this release incorporates revisions to both the North American Industry Classification System (NAICS) and the Standard Occupational Classification codes (SOC). Comparison of data for 2019 to prior years should be done with caution due to these changes, and thus analysis in this release is limited to 2019 for industries and occupations. More information on NAICS can be found at www.bls.gov/bls/naics.htm. More information on SOC can be found at www.bls.gov/soc/2018/home.htm.
Data in this news release are for reference year 2019. No changes in collection procedures or outputs were necessary due to COVID-19. Additional information is available at www.bls.gov/covid19/effects-of-covid-19-on-workplace-injuries-and-illnesses-compensation-and-occupational-requirements.htm.
Background of the program. The Census of Fatal Occupational Injuries (CFOI), part of the Bureau of Labor Statistics (BLS) Occupational Safety and Health Statistics (OSHS) program, is a count of all fatal work injuries occurring in the U.S. during the calendar year. The CFOI uses a variety of state, federal, and independent data sources to identify, verify, and describe fatal work injuries. This ensures counts are as complete and accurate as possible. For the 2019 national data, over 25,100 unique source documents were reviewed as part of the data collection process. For technical information and definitions for the CFOI, see the BLS Handbook of Methods on the BLS website at www.bls.gov/opub/hom/cfoi/home.htm and the CFOI definitions at www.bls.gov/iif/oshcfdef.htm.
Federal/State agency coverage. The CFOI includes data for all fatal work injuries, some of which may be outside the scope of other agencies or regulatory coverage. Comparisons between CFOI counts and those released by other agencies should account for the different coverage requirements and definitions used by each agency. For more information on the scope of CFOI, see www.bls.gov/iif/cfoiscope.htm and www.bls.gov/opub/hom/cfoi/concepts.htm.
Acknowledgments. BLS thanks the Illinois Department of Public Health for their efforts in collecting accurate, comprehensive, and useful data on fatal work injuries. BLS also appreciates the efforts of all federal, state, local, and private sector entities that provided source documents used to identify fatal work injuries. Among these agencies are the Occupational Safety and Health Administration; the National Transportation Safety Board; the U.S. Coast Guard; the Mine Safety and Health Administration; the Office of Workers’ Compensation Programs (Federal Employees' Compensation and Longshore and Harbor Workers' Compensation divisions); the Federal Railroad Administration; the National Highway Traffic Safety Administration; state vital statistics registrars, coroners, and medical examiners; state departments of health, labor, and industrial relations and workers' compensation agencies; state and local police departments; and state farm bureaus.
Information in this release will be made available to individuals with sensory impairments upon request. Voice phone: (202) 691-5200; Federal Relay Service: (800) 877-8339.
| Event or exposure (1) | 2018 | 2019 | |
|---|---|---|---|
| Number | Number | Percent | |
Total | 184 | 158 | 100 |
Violence and other injuries by persons or animals | 26 | 31 | 20 |
Intentional injury by person | 23 | 29 | 18 |
Intentional injury by other person | 14 | 21 | 13 |
Shooting by other person--intentional | 10 | 18 | 11 |
Stabbing, cutting, slashing, piercing | 1 | 1 | 1 |
Self-inflicted injury--intentional | 9 | 8 | 5 |
Shooting--intentional self-harm | 5 | 3 | 2 |
Transportation incidents | 75 | 53 | 34 |
Rail vehicle incidents | 4 | 5 | 3 |
Collision between rail vehicle and another vehicle | -- | 4 | 3 |
Pedestrian vehicular incident | 12 | 14 | 9 |
Pedestrian struck by vehicle in work zone | -- | 4 | 3 |
Pedestrian struck by vehicle on side of road | -- | 4 | 3 |
Pedestrian struck by vehicle in nonroadway area | 4 | 4 | 3 |
Pedestrian struck by vehicle backing up in nonroadway area | -- | 3 | 2 |
Roadway incidents involving motorized land vehicle | 47 | 29 | 18 |
Roadway collision with other vehicle | 26 | 20 | 13 |
Roadway collision--moving in same direction | 6 | 7 | 4 |
Roadway collision--moving in opposite directions, oncoming | 9 | 5 | 3 |
Roadway collision--moving perpendicularly | 6 | 3 | 2 |
Roadway collision--moving and standing vehicle on side of roadway | -- | 3 | 2 |
Roadway collision with object other than vehicle | 9 | 3 | 2 |
Vehicle struck object or animal on side of roadway | 9 | 3 | 2 |
Roadway noncollision incident | 12 | 6 | 4 |
Jack-knifed or overturned, roadway | 7 | 4 | 3 |
Nonroadway incident involving motorized land vehicles | 12 | 5 | 3 |
Fires and explosions | 3 | -- | -- |
Falls, slips, trips | 25 | 26 | 16 |
Falls to lower level | 17 | 18 | 11 |
Fall through surface or existing opening | -- | 3 | 2 |
Fall through surface or existing opening 26 to 30 feet | -- | 1 | 1 |
Other fall to lower level | 13 | 15 | 9 |
Other fall to lower level 6 to 10 feet | -- | 3 | 2 |
Other fall to lower level 11 to 15 feet | -- | 3 | 2 |
Other fall to lower level more than 30 feet | -- | 2 | 1 |
Exposure to harmful substances or environments | 20 | 17 | 11 |
Exposure to electricity | 7 | 8 | 5 |
Direct exposure to electricity | 3 | 3 | 2 |
Direct exposure to electricity, 220 volts or less | -- | 1 | 1 |
Indirect exposure to electricity | 3 | 5 | 3 |
Exposure to other harmful substances | 11 | 7 | 4 |
Contact with objects and equipment | 34 | 23 | 15 |
Struck by object or equipment | 30 | 16 | 10 |
Struck by falling object or equipment--other than powered vehicle | 10 | 8 | 5 |
Struck by object falling from vehicle or machinery--other than vehicle part | 3 | 3 | 2 |
Caught in or compressed by equipment or objects | -- | 4 | 3 |
Caught in running equipment or machinery | -- | 3 | 2 |
Overexertion and bodily reaction | -- | -- | -- |
Footnotes: | |||
NOTE: Data for all years are final. Totals for major categories may include subcategories not shown separately. For complete information on how the data are coded and presented see our definitions page at https://www.bls.gov/iif/oshcfdef.htm. Dashes indicate no data reported or data that do not meet publication criteria. CFOI fatal injury counts exclude illness-related deaths unless precipitated by an injury event. | |||
| Industry (1) | Number | Percent |
|---|---|---|
Total | 158 | 100 |
Private industry (2) | 139 | 88 |
Goods producing | -- | -- |
Natural resources and mining | -- | -- |
Agriculture, forestry, fishing and hunting | 15 | 9 |
Crop production | 12 | 8 |
Oilseed and grain farming | 10 | 6 |
Soybean farming | 1 | 1 |
Corn farming | 8 | 5 |
Other grain farming | 1 | 1 |
Support activities for agriculture and forestry | 1 | 1 |
Support activities for crop production | 1 | 1 |
Support activities for crop production | 1 | 1 |
Soil preparation, planting, and cultivating | 1 | 1 |
Construction | 30 | 19 |
Construction | 30 | 19 |
Heavy and civil engineering construction | 4 | 3 |
Service providing (3) | -- | -- |
Trade, transportation, and utilities | 36 | 23 |
Utilities | 1 | 1 |
Utilities | 1 | 1 |
Electric power generation, transmission and distribution | 1 | 1 |
Electric power transmission, control, and distribution | 1 | 1 |
Electric power distribution | 1 | 1 |
Wholesale trade | 6 | 4 |
Merchant wholesalers, durable goods | 3 | 2 |
Miscellaneous durable goods merchant wholesalers | 1 | 1 |
Recyclable material merchant wholesalers | 1 | 1 |
Merchant wholesalers, nondurable goods | 3 | 2 |
Farm product raw material merchant wholesalers | 1 | 1 |
Grain and field bean merchant wholesalers | 1 | 1 |
Retail trade | 5 | 3 |
Food and beverage stores | 1 | 1 |
Grocery stores | 1 | 1 |
Supermarkets and other grocery (except convenience) stores | 1 | 1 |
Gasoline stations | 1 | 1 |
Gasoline stations | 1 | 1 |
Gasoline stations with convenience stores | 1 | 1 |
Miscellaneous store retailers | 1 | 1 |
Used merchandise stores | 1 | 1 |
Used merchandise stores | 1 | 1 |
Transportation and warehousing | 24 | 15 |
Truck transportation | 17 | 11 |
General freight trucking | 12 | 8 |
General freight trucking, local | 6 | 4 |
General freight trucking, long-distance | 5 | 3 |
General freight trucking, long-distance, truckload | 3 | 2 |
Specialized freight trucking | 5 | 3 |
Specialized freight (except used goods) trucking, long-distance | 5 | 3 |
Transit and ground passenger transportation | 2 | 1 |
Taxi and limousine service | 2 | 1 |
Taxi service | 2 | 1 |
Couriers and messengers | 2 | 1 |
Couriers and express delivery services | 2 | 1 |
Couriers and express delivery services | 2 | 1 |
Financial activities | -- | -- |
Professional and business services | 9 | 6 |
Administrative and support and waste management and remediation services | 7 | 4 |
Administrative and support services | 7 | 4 |
Educational and health services | -- | -- |
Leisure and hospitality | 13 | 8 |
Arts, entertainment, and recreation | 2 | 1 |
Performing arts, spectator sports, and related industries | 1 | 1 |
Independent artists, writers, and performers | 1 | 1 |
Independent artists, writers, and performers | 1 | 1 |
Amusement, gambling, and recreation industries | 1 | 1 |
Other amusement and recreation industries | 1 | 1 |
Golf courses and country clubs | 1 | 1 |
Accommodation and food services | 11 | 7 |
Food services and drinking places | 11 | 7 |
Special food services | 1 | 1 |
Mobile food services | 1 | 1 |
Drinking places (alcoholic beverages) | 1 | 1 |
Drinking places (alcoholic beverages) | 1 | 1 |
Restaurants and other eating places | 9 | 6 |
Restaurants and other eating places | 9 | 6 |
Full-service restaurants | 4 | 3 |
Limited-service restaurants | 5 | 3 |
Other services, except public administration | 11 | 7 |
Other services, except public administration | 11 | 7 |
Repair and maintenance | 6 | 4 |
Automotive repair and maintenance | 6 | 4 |
Automotive mechanical and electrical repair and maintenance | 4 | 3 |
Automotive body, paint, interior, and glass repair | 1 | 1 |
Automotive body, paint, and interior repair and maintenance | 1 | 1 |
Other automotive repair and maintenance | 1 | 1 |
Car washes | 1 | 1 |
Government (4) | 19 | 12 |
Federal government | -- | -- |
State government | 5 | 3 |
Local government | 12 | 8 |
Footnotes: | ||
NOTE: Data for all years are final. Totals for major categories may include subcategories not shown separately. For complete information on how the data are coded and presented see our definitions page at https://www.bls.gov/iif/oshcfdef.htm. Dashes indicate no data reported or data that do not meet publication criteria. CFOI fatal injury counts exclude illness-related deaths unless precipitated by an injury event. | ||
| Occupation (1) | Number | Percent |
|---|---|---|
Total | 158 | 100 |
Management occupations | 20 | 13 |
Operations specialties managers | 2 | 1 |
Other management occupations | 16 | 10 |
Farmers, ranchers, and other agricultural managers | 11 | 7 |
Farmers, ranchers, and other agricultural managers | 11 | 7 |
Business and financial operations occupations | -- | -- |
Computer and mathematical occupations | -- | -- |
Architecture and engineering occupations | -- | -- |
Life, physical, and social science occupations | -- | -- |
Community and social service occupations | 1 | 1 |
Religious workers | 1 | 1 |
Clergy | 1 | 1 |
Clergy | 1 | 1 |
Legal occupations | -- | -- |
Educational instruction and library occupations | -- | -- |
Arts, design, entertainment, sports, and media occupations | 1 | 1 |
Healthcare practitioners and technical occupations | -- | -- |
Healthcare support occupations | -- | -- |
Protective service occupations | 17 | 11 |
Supervisors of protective service workers | 1 | 1 |
First-line supervisors of firefighting and prevention workers | 1 | 1 |
First-line supervisors of firefighting and prevention workers | 1 | 1 |
Firefighting and prevention workers | 2 | 1 |
Law enforcement workers | 8 | 5 |
Police officers | 8 | 5 |
Other protective service workers | 6 | 4 |
Security guards and gambling surveillance officers | 5 | 3 |
Security guards | 5 | 3 |
Food preparation and serving related occupations | 4 | 3 |
Building and grounds cleaning and maintenance occupations | 5 | 3 |
Grounds maintenance workers | 3 | 2 |
Grounds maintenance workers | 3 | 2 |
Personal care and service occupations | -- | -- |
Sales and related occupations | 7 | 4 |
Other sales and related workers | 1 | 1 |
Miscellaneous sales and related workers | 1 | 1 |
Office and administrative support occupations | 6 | 4 |
Material recording, scheduling, dispatching, and distributing workers | 3 | 2 |
Meter readers, utilities | 1 | 1 |
Meter readers, utilities | 1 | 1 |
Farming, fishing, and forestry occupations | 4 | 3 |
Agricultural workers | 3 | 2 |
Miscellaneous agricultural workers | 3 | 2 |
Agricultural equipment operators | 1 | 1 |
Construction and extraction occupations | 30 | 19 |
Supervisors of construction and extraction workers | 3 | 2 |
First-line supervisors of construction trades and extraction workers | 3 | 2 |
First-line supervisors of construction trades and extraction workers | 3 | 2 |
Construction trades workers | 24 | 15 |
Construction laborers | 10 | 6 |
Construction laborers | 10 | 6 |
Electricians | 3 | 2 |
Electricians | 3 | 2 |
Roofers | 4 | 3 |
Roofers | 4 | 3 |
Other construction and related workers | 3 | 2 |
Installation, maintenance, and repair occupations | 11 | 7 |
Supervisors of installation, maintenance, and repair workers | 1 | 1 |
First-line supervisors of mechanics, installers, and repairers | 1 | 1 |
First-line supervisors of mechanics, installers, and repairers | 1 | 1 |
Vehicle and mobile equipment mechanics, installers, and repairers | 5 | 3 |
Bus and truck mechanics and diesel engine specialists | 3 | 2 |
Bus and truck mechanics and diesel engine specialists | 3 | 2 |
Other installation, maintenance, and repair occupations | 5 | 3 |
Maintenance and repair workers, general | 3 | 2 |
Maintenance and repair workers, general | 3 | 2 |
Production occupations | 7 | 4 |
Other production occupations | 4 | 3 |
Miscellaneous production workers | 1 | 1 |
Transportation and material moving occupations | 41 | 26 |
Motor vehicle operators | 31 | 20 |
Driver/sales workers and truck drivers | 28 | 18 |
Driver/sales workers | 4 | 3 |
Heavy and tractor-trailer truck drivers | 22 | 14 |
Military specific occupations (2) | -- | -- |
Footnotes: | ||
NOTE: Data for all years are final. Totals for major categories may include subcategories not shown separately. For complete information on how the data are coded and presented see our definitions page at https://www.bls.gov/iif/oshcfdef.htm. Dashes indicate no data reported or data that do not meet publication criteria. CFOI fatal injury counts exclude illness-related deaths unless precipitated by an injury event. | ||
| Worker characteristics | 2018 | 2019 | |
|---|---|---|---|
| Number | Number | Percent | |
Total | 184 | 158 | 100 |
Employee status | |||
Wage and salary workers (1) | 140 | 129 | 82 |
Self-employed (2) | 44 | 29 | 18 |
Gender | |||
Men | 169 | 142 | 90 |
Women | 15 | 16 | 10 |
Age (3) | |||
18 to 19 years | 2 | 2 | 1 |
20 to 24 years | 6 | 8 | 5 |
25 to 34 years | 26 | 28 | 18 |
35 to 44 years | 30 | 32 | 20 |
45 to 54 years | 46 | 31 | 20 |
55 to 64 years | 46 | 34 | 22 |
65 years and over | 28 | 23 | 15 |
Race or ethnic origin (4) | |||
White, non-Hispanic | 126 | 116 | 73 |
Black or African-American, non-Hispanic | 28 | 18 | 11 |
Hispanic or Latino | 27 | 17 | 11 |
Footnotes: | |||
NOTE: Data for all years are final. Totals for major categories may include subcategories not shown separately. For complete information on how the data are coded and presented see our definitions page at https://www.bls.gov/iif/oshcfdef.htm. Dashes indicate no data reported or data that do not meet publication criteria. CFOI fatal injury counts exclude illness-related deaths unless precipitated by an injury event. | |||
Last Modified Date: Wednesday, March 17, 2021