An official website of the United States government
An official website of the United States government
The .gov means it's official.
Federal government websites often end in .gov or .mil. Before sharing sensitive information,
make sure you're on a federal government site.
The site is secure.
The
https:// ensures that you are connecting to the official website and that any
information you provide is encrypted and transmitted securely.
24-290-CHI
Friday, March 01, 2024
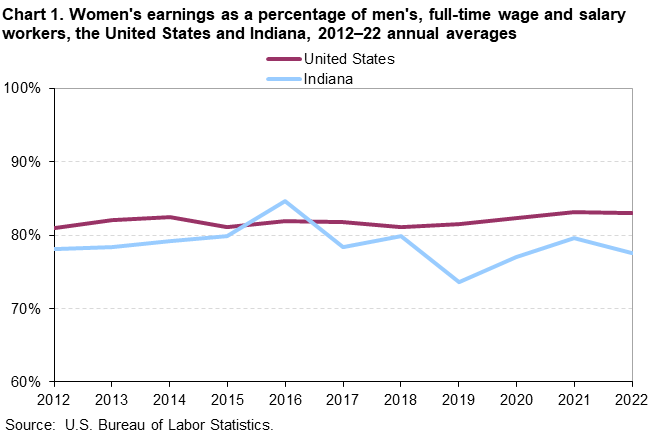
In 2022, Indiana women who were full-time wage and salary workers had median usual weekly earnings of $861, or 77.6 percent of the $1,109 median usual weekly earnings of their male counterparts, the U.S. Bureau of Labor Statistics reported today. Regional Commissioner Jason Palmer noted that the 2022 women’s-to-men’s earnings ratio of 77.6 percent compared to 79.6 percent in 2021. Nationwide, women earned $958 per week, or 83.0 percent of the $1,154 median for men. (See chart 1 and table 1.) The earnings comparisons in this release are on a broad level and do not control for many factors that can be important in explaining earnings differences, such as job skills and responsibilities, work experience, and specialization.
In Indiana, the women’s-to-men’s earnings ratio has ranged from a low of 65.9 percent in 1997 to a high of 84.7 percent in 2016. (Data for the states began in 1997.)
Among the 50 states and the District of Columbia, median weekly earnings of women in full-time wage and salary positions in 2022 ranged from $751 in Mississippi to $1,626 in the District of Columbia. Women’s earnings in 12 states and the District of Columbia exceeded $1,050 per week. (See map 1.)
Median weekly earnings for men were lowest in Mississippi at $906 and highest in the District of Columbia at $1,876. Thirty-nine states and the District of Columbia had weekly wages above $1,050 for full-time male workers.
Among the 50 states and the District of Columbia, Rhode Island had the highest women’s-to-men’s earnings ratio, 99.6 percent. Utah had the lowest earnings ratio, 73.1 percent. (See map 2.) The differences among the states reflect, in part, variation in the occupations and industries found in each state and differences in the demographic composition of each state’s labor force. In addition, sampling error for state estimates is considerably larger than it is for the national estimates. Consequently, earnings comparisons between states should be made with caution.
The estimates in this release were obtained from the Current Population Survey (CPS), which provides information on the labor force, employment, and unemployment. The survey is conducted monthly for the U.S. Bureau of Labor Statistics (BLS) by the U.S. Census Bureau using a scientifically selected national sample of about 60,000 eligible households representing all 50 states and the District of Columbia. The survey data on earnings are based on one-fourth of the CPS monthly sample and are limited to wage and salary workers. All self-employed workers, both incorporated and unincorporated, are excluded from the data presented in this release.
Readers should be aware that, because of sampling error, apparent differences between estimates for two or more groups or categories may not be statistically significant, and therefore not meaningfully different from one another. Standard errors are shown with many of the median earnings estimates in this report to help readers evaluate differences in earnings estimates.
For more information on the median weekly earnings of women and men, see Bureau of Labor Statistics Report 1108, Highlights of women’s earnings in 2022 and Technical Notes.
Information in this release will be made available to individuals with sensory impairments upon request. Voice phone: (202)-691-5200; Telecommunications Relay Service: 7-1-1.
| State | Total | Women | Men | Women’s earnings as a percentage of men’s | ||||||
|---|---|---|---|---|---|---|---|---|---|---|
| Number of workers (in thou- sands) | Median weekly earnings ($) | Standard error of median ($) | Number of workers (in thou- sands) | Median weekly earnings ($) | Standard error of median ($) | Number of workers (in thou- sands) | Median weekly earnings ($) | Standard error of median ($) | ||
United States | 118,869 | 1,059 | 3 | 53,315 | 958 | 3 | 65,554 | 1,154 | 3 | 83.0 |
Alabama | 1,808 | 935 | 16 | 808 | 837 | 20 | 1,000 | 1,049 | 32 | 79.8 |
Alaska | 251 | 1,131 | 20 | 106 | 1,007 | 32 | 145 | 1,217 | 23 | 82.7 |
Arizona | 2,582 | 1,071 | 18 | 1,113 | 938 | 24 | 1,470 | 1,173 | 23 | 80.0 |
Arkansas | 1,036 | 889 | 13 | 485 | 822 | 19 | 551 | 954 | 29 | 86.2 |
California | 13,562 | 1,159 | 9 | 5,803 | 1,062 | 18 | 7,758 | 1,223 | 14 | 86.8 |
Colorado | 2,226 | 1,240 | 16 | 960 | 1,142 | 19 | 1,265 | 1,312 | 26 | 87.0 |
Connecticut | 1,360 | 1,260 | 44 | 617 | 1,130 | 41 | 743 | 1,399 | 30 | 80.8 |
Delaware | 367 | 996 | 12 | 178 | 972 | 21 | 189 | 1,018 | 20 | 95.5 |
District of Columbia | 300 | 1,740 | 18 | 155 | 1,626 | 52 | 145 | 1,876 | 32 | 86.7 |
Florida | 7,938 | 952 | 9 | 3,695 | 861 | 9 | 4,243 | 1,022 | 12 | 84.2 |
Georgia | 3,924 | 986 | 12 | 1,816 | 891 | 20 | 2,109 | 1,087 | 27 | 82.0 |
Hawaii | 473 | 1,038 | 25 | 209 | 963 | 20 | 265 | 1,136 | 33 | 84.8 |
Idaho | 664 | 975 | 15 | 277 | 851 | 17 | 387 | 1,085 | 27 | 78.4 |
Illinois | 4,660 | 1,136 | 13 | 2,164 | 1,014 | 14 | 2,496 | 1,262 | 26 | 80.3 |
Indiana | 2,549 | 996 | 17 | 1,121 | 861 | 16 | 1,427 | 1,109 | 25 | 77.6 |
Iowa | 1,228 | 972 | 20 | 546 | 883 | 18 | 681 | 1,066 | 25 | 82.8 |
Kansas | 1,095 | 1,007 | 13 | 480 | 920 | 20 | 614 | 1,079 | 33 | 85.3 |
Kentucky | 1,495 | 945 | 14 | 668 | 860 | 19 | 827 | 1,018 | 27 | 84.5 |
Louisiana | 1,552 | 926 | 18 | 743 | 822 | 21 | 809 | 1,064 | 37 | 77.3 |
Maine | 427 | 1,019 | 17 | 206 | 936 | 23 | 222 | 1,093 | 39 | 85.6 |
Maryland | 2,429 | 1,240 | 19 | 1,123 | 1,165 | 19 | 1,306 | 1,345 | 70 | 86.6 |
Massachusetts | 2,590 | 1,353 | 26 | 1,186 | 1,247 | 24 | 1,403 | 1,454 | 25 | 85.8 |
Michigan | 3,391 | 1,109 | 16 | 1,450 | 987 | 17 | 1,941 | 1,197 | 25 | 82.5 |
Minnesota | 2,159 | 1,156 | 15 | 964 | 1,101 | 39 | 1,195 | 1,210 | 37 | 91.0 |
Mississippi | 969 | 818 | 17 | 479 | 751 | 16 | 491 | 906 | 18 | 82.9 |
Missouri | 2,235 | 986 | 24 | 996 | 882 | 22 | 1,238 | 1,110 | 39 | 79.5 |
Montana | 364 | 979 | 15 | 163 | 884 | 17 | 201 | 1,082 | 23 | 81.7 |
Nebraska | 771 | 1,006 | 15 | 350 | 937 | 22 | 422 | 1,068 | 27 | 87.7 |
Nevada | 1,085 | 903 | 12 | 481 | 811 | 13 | 604 | 1,013 | 18 | 80.1 |
New Hampshire | 559 | 1,207 | 29 | 246 | 1,019 | 23 | 313 | 1,351 | 24 | 75.4 |
New Jersey | 3,511 | 1,187 | 19 | 1,546 | 1,072 | 30 | 1,964 | 1,284 | 39 | 83.5 |
New Mexico | 669 | 951 | 15 | 296 | 855 | 27 | 373 | 1,023 | 35 | 83.6 |
New York | 6,761 | 1,151 | 8 | 3,114 | 1,072 | 19 | 3,647 | 1,239 | 17 | 86.5 |
North Carolina | 3,762 | 976 | 13 | 1,760 | 902 | 15 | 2,002 | 1,053 | 32 | 85.7 |
North Dakota | 311 | 1,005 | 13 | 138 | 900 | 12 | 174 | 1,140 | 21 | 78.9 |
Ohio | 4,008 | 1,005 | 11 | 1,796 | 902 | 11 | 2,212 | 1,103 | 16 | 81.8 |
Oklahoma | 1,364 | 863 | 18 | 641 | 769 | 14 | 723 | 952 | 24 | 80.8 |
Oregon | 1,494 | 1,143 | 16 | 663 | 1,074 | 30 | 831 | 1,204 | 33 | 89.2 |
Pennsylvania | 4,701 | 1,095 | 14 | 2,157 | 981 | 16 | 2,545 | 1,195 | 20 | 82.1 |
Rhode Island | 412 | 1,140 | 24 | 186 | 1,138 | 30 | 225 | 1,142 | 36 | 99.6 |
South Carolina | 1,729 | 929 | 18 | 822 | 841 | 22 | 907 | 1,016 | 27 | 82.8 |
South Dakota | 338 | 990 | 15 | 153 | 886 | 22 | 185 | 1,076 | 26 | 82.3 |
Tennessee | 2,510 | 956 | 16 | 1,128 | 859 | 20 | 1,382 | 1,047 | 34 | 82.0 |
Texas | 10,690 | 1,014 | 9 | 4,665 | 916 | 10 | 6,025 | 1,103 | 14 | 83.0 |
Utah | 1,227 | 1,054 | 16 | 470 | 884 | 15 | 757 | 1,210 | 25 | 73.1 |
Vermont | 225 | 1,129 | 20 | 107 | 1,007 | 31 | 117 | 1,214 | 33 | 82.9 |
Virginia | 3,356 | 1,159 | 16 | 1,599 | 1,054 | 30 | 1,757 | 1,324 | 48 | 79.6 |
Washington | 2,870 | 1,197 | 23 | 1,201 | 1,097 | 34 | 1,669 | 1,279 | 33 | 85.8 |
West Virginia | 596 | 937 | 15 | 270 | 828 | 19 | 325 | 1,065 | 40 | 77.7 |
Wisconsin | 2,088 | 1,077 | 21 | 930 | 940 | 24 | 1,158 | 1,169 | 24 | 80.4 |
Wyoming | 199 | 1,023 | 17 | 83 | 869 | 24 | 116 | 1,150 | 24 | 75.6 |
Note: In general, the sampling error for the state estimates is considerably larger than it is for the national estimates; thus, comparisons of state estimates should be made with caution. Data shown are based on workers' state of residence; workers' reported earnings, however, may or may not be from a job located in the same state. | ||||||||||
Last Modified Date: Friday, March 01, 2024