An official website of the United States government
An official website of the United States government
The .gov means it's official.
Federal government websites often end in .gov or .mil. Before sharing sensitive information,
make sure you're on a federal government site.
The site is secure.
The
https:// ensures that you are connecting to the official website and that any
information you provide is encrypted and transmitted securely.
22-521-SAN
Thursday, March 24, 2022
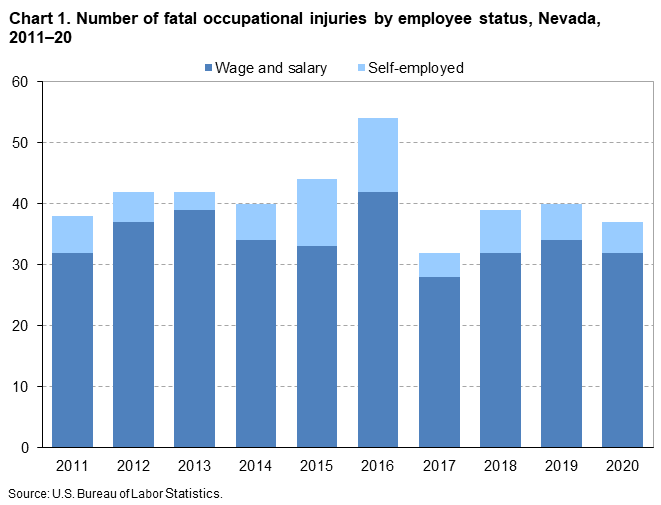
Fatal work injuries totaled 37 in 2020 for Nevada, the U.S. Bureau of Labor Statistics reported today. Regional Commissioner Chris Rosenlund noted that the number of work-related fatalities in Nevada was three less than the previous year. (See chart 1.) Fatal occupational injuries in the state have ranged from a high of 71 in 2007 to a low of 24 in 2009.
Nationwide, a total of 4,764 fatal work injuries were recorded in 2020, an 11-percent decrease from 5,333 in 2019, according to the results from the Census of Fatal Occupational Injuries (CFOI). The 4,764 fatal occupational injuries in 2020 represents the lowest annual number since 2013.
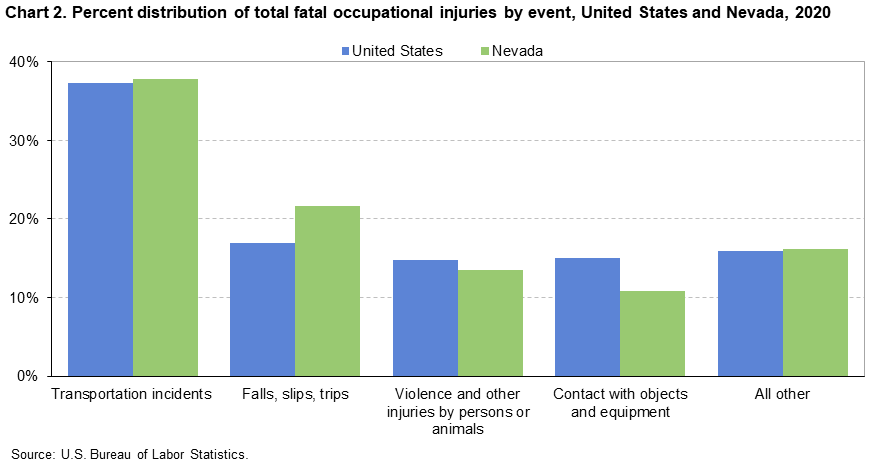
Fatal event or exposureIn Nevada, transportation incidents resulted in 14 fatal work injuries and falls, slips, or trips accounted for 8 fatalities. These two major categories accounted for 59 percent of all fatal workplace injuries in the state. (See chart 2 and table 1.) Worker deaths from transportation incidents were down from 18 over the year and worker fatalities due to falls, slips, or trips were down from 9.
Violence and other injuries by persons or animals were the third-most frequent fatal work event with five fatalities, and contact with objects and equipment resulted in four work-related deaths.
Nationally, transportation incidents were the most frequent fatal workplace event in 2020, accounting for 37 percent of fatal work injuries. Falls, slips, and trips was the second-most common fatal event (17 percent).
IndustryThe private transportation and warehousing industry sector had the highest number of fatalities in Nevada with 10, up from 9 in the previous year. (See table 2.) Transportation incidents resulted in 8 of the 10 fatalities in the industry. The truck transportation subsector accounted for 6 of the 10 fatal workplace injuries in the transportation and warehousing industry.
The private construction industry sector had nine fatal workplace injuries, up from seven in 2019. Government had four fatalities, up from one in 2019.
OccupationThe transportation and material moving occupational group had the highest number of fatal workplace injuries with 14. (See table 3.) Motor vehicle operators accounted for 9 of the 14 fatalities among transportation and material moving workers. The construction and extraction occupational group had the second highest number of fatal workplace injuries with eight.
Additional highlights:CFOI reports fatal workplace injuries only. These may include fatal workplace injuries complicated by an illness such as COVID-19. Fatal workplace illnesses not precipitated by an injury are not in scope for CFOI. CFOI does not report any illness related information, including COVID-19. Additional information is available at www.bls.gov/covid19/effects-of-covid-19-on-workplace-injuries-and-illnesses-compensation-and-occupational-requirements.htm.
Background of the program. The Census of Fatal Occupational Injuries (CFOI), part of the Bureau of Labor Statistics (BLS) Occupational Safety and Health Statistics (OSHS) program, is a count of all fatal work injuries occurring in the U.S. during the calendar year. The CFOI uses a variety of state, federal, and independent data sources to identify, verify, and describe fatal work injuries. This ensures counts are as complete and accurate as possible. For the 2020 national data, over 21,600 unique source documents were reviewed as part of the data collection process. For technical information and definitions for the CFOI, see the BLS Handbook of Methods on the BLS website at www.bls.gov/opub/hom/cfoi/home.htm and the CFOI definitions at www.bls.gov/iif/oshcfdef.htm.
Federal/State agency coverage. The CFOI includes data for all fatal work injuries, some of which may be outside the scope of other agencies or regulatory coverage. Comparisons between CFOI counts and those released by other agencies should account for the different coverage requirements and definitions used by each agency. For more information on the scope of CFOI, see www.bls.gov/iif/cfoiscope.htm and www.bls.gov/opub/hom/cfoi/concepts.htm.
Acknowledgments. BLS thanks the Nevada Division of Industrial Relations for their efforts in collecting accurate, comprehensive, and useful data on fatal work injuries. BLS also appreciates the efforts of all federal, state, local, and private sector entities that provided source documents used to identify fatal work injuries. Among these agencies are the Occupational Safety and Health Administration; the National Transportation Safety Board; the U.S. Coast Guard; the Mine Safety and Health Administration; the Office of Workers’ Compensation Programs (Federal Employees' Compensation and Longshore and Harbor Workers' Compensation divisions); the Federal Railroad Administration; the National Highway Traffic Safety Administration; state vital statistics registrars, coroners, and medical examiners; state departments of health, labor, and industrial relations and workers' compensation agencies; state and local police departments; and state farm bureaus.
Information in this release will be made available to individuals with sensory impairments upon request. Voice phone: (202) 691-5200; Telecommunications Relay Service: 7-1-1.
| Event or exposure (1) | 2019 | 2020 | |
|---|---|---|---|
| Number | Number | Percent | |
Total | 40 | 37 | 100 |
Violence and other injuries by persons or animals | 6 | 5 | 14 |
Transportation incidents | 18 | 14 | 38 |
Aircraft incidents | 2 | 3 | 8 |
Other in-flight crash | -- | 3 | 8 |
Other in-flight crash between air vehicles | -- | 2 | 5 |
Roadway incidents involving motorized land vehicle | 12 | 8 | 22 |
Roadway collision with other vehicle | 6 | 5 | 14 |
Falls, slips, trips | 9 | 8 | 22 |
Falls on same level | -- | 4 | 11 |
Falls to lower level | 7 | 3 | 8 |
Jumps to lower level | -- | 1 | 3 |
Contact with objects and equipment | -- | 4 | 11 |
Footnotes: | |||
NOTE: Data for all years are final. Totals for major categories may include subcategories not shown separately. For complete information on how the data are coded and presented see our definitions page at https://www.bls.gov/iif/oshcfdef.htm. Dashes indicate no data reported or data that do not meet publication criteria. CFOI fatal injury counts exclude illness-related deaths unless precipitated by an injury event. | |||
| Industry (1) | 2019 | 2020 | |
|---|---|---|---|
| Number | Number | Percent | |
Total | 40 | 37 | 100 |
Private industry (2) | 39 | 33 | 89 |
Goods producing | -- | -- | -- |
Natural resources and mining | 1 | 1 | 3 |
Mining, quarrying, and oil and gas extraction (3) | 1 | 1 | 3 |
Mining (except oil and gas) | 1 | 1 | 3 |
Metal ore mining | 1 | 1 | 3 |
Gold ore and silver ore mining | 1 | 1 | 3 |
Gold ore mining | 1 | 1 | 3 |
Construction | 7 | 9 | 24 |
Construction | 7 | 9 | 24 |
Service providing (4) | -- | -- | -- |
Trade, transportation, and utilities | 14 | 14 | 38 |
Transportation and warehousing | 9 | 10 | 27 |
Air transportation | -- | 2 | 5 |
Nonscheduled air transportation | -- | 2 | 5 |
Nonscheduled air transportation | -- | 2 | 5 |
Truck transportation | 8 | 6 | 16 |
General freight trucking | 5 | 4 | 11 |
General freight trucking, long-distance | -- | 4 | 11 |
Leisure and hospitality | 4 | 3 | 8 |
Arts, entertainment, and recreation | -- | 1 | 3 |
Amusement, gambling, and recreation industries | -- | 1 | 3 |
Other amusement and recreation industries | -- | 1 | 3 |
Accommodation and food services | 4 | 2 | 5 |
Food services and drinking places | -- | 2 | 5 |
Restaurants and other eating places | -- | 2 | 5 |
Restaurants and other eating places | -- | 2 | 5 |
Limited-service restaurants | -- | 2 | 5 |
Government (5) | 1 | 4 | 11 |
Federal government | 1 | 1 | 3 |
State government | -- | 1 | 3 |
Local government | -- | 2 | 5 |
Footnotes: | |||
NOTE: Data for all years are final. Totals for major categories may include subcategories not shown separately. For complete information on how the data are coded and presented see our definitions page at https://www.bls.gov/iif/oshcfdef.htm. Dashes indicate no data reported or data that do not meet publication criteria. CFOI fatal injury counts exclude illness-related deaths unless precipitated by an injury event. | |||
| Occupation (1) | 2019 | 2020 | |
|---|---|---|---|
| Number | Number | Percent | |
Total | 40 | 37 | 100 |
Management occupations | -- | 1 | 3 |
Other management occupations | -- | 1 | 3 |
Food service managers | -- | 1 | 3 |
Food service managers | -- | 1 | 3 |
Food preparation and serving related occupations | -- | 1 | 3 |
Food and beverage serving workers | -- | 1 | 3 |
Fast food and counter workers | -- | 1 | 3 |
Fast food and counter workers | -- | 1 | 3 |
Construction and extraction occupations | 5 | 8 | 22 |
Construction trades workers | 3 | 6 | 16 |
Construction laborers | -- | 2 | 5 |
Construction laborers | -- | 2 | 5 |
Transportation and material moving occupations | 12 | 14 | 38 |
Air transportation workers | -- | 3 | 8 |
Aircraft pilots and flight engineers | -- | 3 | 8 |
Commercial pilots | -- | 3 | 8 |
Motor vehicle operators | 10 | 9 | 24 |
Footnotes: | |||
NOTE: Data for all years are final. Totals for major categories may include subcategories not shown separately. For complete information on how the data are coded and presented see our definitions page at https://www.bls.gov/iif/oshcfdef.htm. Dashes indicate no data reported or data that do not meet publication criteria. CFOI fatal injury counts exclude illness-related deaths unless precipitated by an injury event. | |||
| Worker characteristics | 2019 | 2020 | |
|---|---|---|---|
| Number | Number | Percent | |
Total | 40 | 37 | 100 |
Employee status | |||
Wage and salary workers (1) | 34 | 32 | 86 |
Self-employed (2) | 6 | 5 | 14 |
Gender | |||
Men | 39 | 31 | 84 |
Women | -- | 6 | 16 |
Age (3) | |||
25 to 34 years | 4 | 7 | 19 |
35 to 44 years | 5 | 4 | 11 |
45 to 54 years | 9 | 9 | 24 |
55 to 64 years | 14 | 9 | 24 |
65 years and over | 6 | 6 | 16 |
Race or ethnic origin (4) | |||
White, non-Hispanic | 26 | 24 | 65 |
Black or African-American, non-Hispanic | 3 | 4 | 11 |
Hispanic or Latino | 7 | 8 | 22 |
Asian, non-Hispanic | -- | 1 | 3 |
Footnotes: | |||
NOTE: Data for all years are final. Totals for major categories may include subcategories not shown separately. For complete information on how the data are coded and presented see our definitions page at https://www.bls.gov/iif/oshcfdef.htm. Dashes indicate no data reported or data that do not meet publication criteria. CFOI fatal injury counts exclude illness-related deaths unless precipitated by an injury event. | |||
Last Modified Date: Thursday, March 24, 2022