An official website of the United States government
An official website of the United States government
The .gov means it's official.
Federal government websites often end in .gov or .mil. Before sharing sensitive information,
make sure you're on a federal government site.
The site is secure.
The
https:// ensures that you are connecting to the official website and that any
information you provide is encrypted and transmitted securely.
24-29-SAN
Wednesday, January 10, 2024
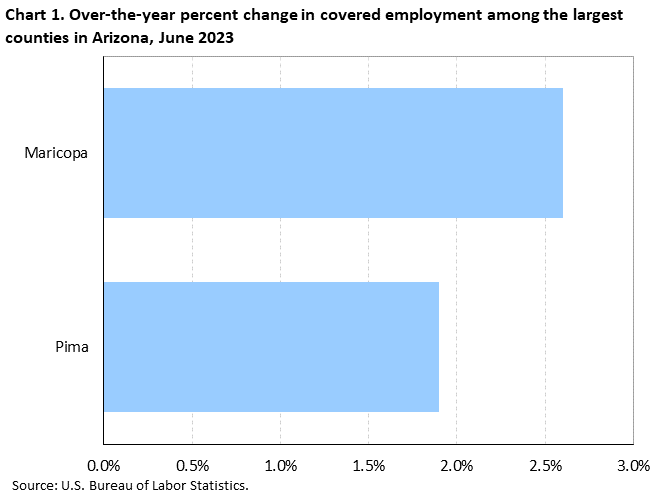
Employment rose in Arizona’s two largest counties from June 2022 to June 2023, the U.S. Bureau of Labor Statistics reported today. (Large counties are those with annual average employment levels of 75,000 or more in 2022.) Regional Commissioner Chris Rosenlund noted that Maricopa County had the larger over-the-year increase in employment with a gain of 2.6 percent. (See chart 1 and table 1.)
National employment increased 2.4 percent over the year, with 337 of the 360 largest U.S. counties reporting gains. Midland, TX, had the largest increase in employment (+7.0 percent). Elkhart, IN, had the largest over-the-year percentage decrease in employment (-7.7 percent).
Among Arizona’s two large counties, employment was higher in Maricopa County (2,180,700) in June 2023. Together, Maricopa and Pima counties accounted for 82.8 percent of total employment within the state. Nationwide, the 360 largest counties made up 72.9 percent of total U.S. employment.
Employment and wage levels (but not over-the-year changes) are also available for the 13 counties in Arizona with employment below 75,000. Wage levels in 12 of 13 smaller counties were below the national average of $1,332 in the second quarter of 2023. (See table 2.)
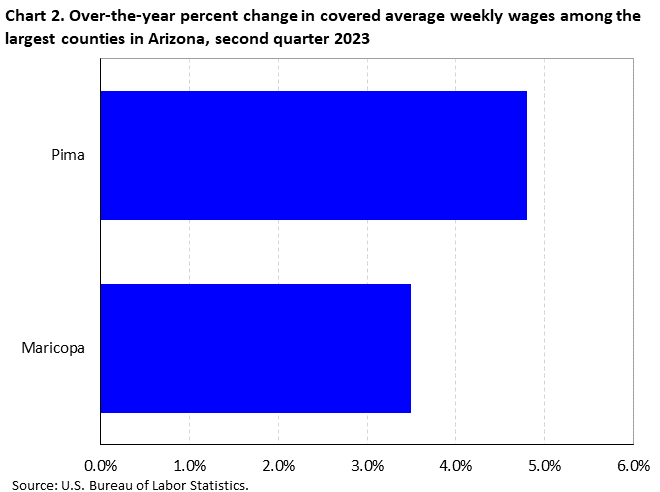
Large county wage changesAverage weekly wages increased in both of Arizona’s largest counties from the second quarter of 2022 to the second quarter of 2023. (See chart 2.) Pima County (+4.8%) and Maricopa County (+3.5%) had wage gain rates that were above the national rate of 3.2 percent.
Nationwide, wages increased by 3.2 percent over the year. Among the 360 largest counties in the United States, 332 had over-the-year wage increases. Clayton, GA, had the largest percentage wage increase (+17.2 percent). Elkhart, IN, had the largest over-the-year percentage decrease (-13.2 percent).
Large county average weekly wagesAverage weekly wages in Maricopa County ($1,319) and Pima County ($1,134) were below the national average of $1,332 and ranked 95th and 220th nationwide, respectively, in the second quarter of 2023.
Among the largest U.S. counties, 88 reported average weekly wages above the U.S. average in the second quarter of 2023. Santa Clara, CA, had the highest average weekly wage ($3,321). Average weekly wages were below the national average in the remaining 272 counties. Hidalgo, TX, had the lowest average weekly wage ($795).
Average weekly wages in Arizona’s smaller countiesAmong the 13 smaller counties in Arizona —those with employment below 75,000—Greenlee ($1,506) had an average weekly wage above the national average of $1,332. Mohave County ($955) had the lowest average weekly wage in the state.
When all 15 counties in Arizona were considered, 5 had average weekly wages of $999 or lower, 5 had wages from $1,000 to $1,099, and 5 had wages of $1,100 or higher. (See map 1.)
Additional statistics and other informationQCEW data for states have been included in this release in table 3. For additional information about quarterly employment and wages data, please read the Technical Note for the County Employment and Wages News Release or visit the Quarterly Census of Employment and Wages website.
Employment and Wages Annual Averages Online features comprehensive information by detailed industry on establishments, employment, and wages for the nation and all states. This publication is typically published in September of the following year of the reference period or shortly after the QCEW first quarter full data update.
Information in this release will be made available to individuals with sensory impairments upon request. Voice phone: (202) 691-5200; Telecommunications Relay Service: 7-1-1.
The County Employment and Wages release for the third quarter 2023 is scheduled to be released on Wednesday, February 21, 2024. The County Employment and Wages full data update for the third quarter 2023 is scheduled to be released on Wednesday, March 6, 2024.
| Area | Establishments, second quarter (thousands) | Employment | Average weekly wage (1) | |||||
|---|---|---|---|---|---|---|---|---|
| June 2023 (thousands) | Percent change, June 2022–23 (2) | National ranking by percent change (3) | Second quarter 2023 | National ranking by level (3) | Percent change, second quarter 2022–23 (2) | National ranking by percent change (3) | ||
United States (4) | 11,964.6 | 154,308.5 | 2.4 | -- | $1,332 | -- | 3.2 | -- |
Arizona | 219.1 | 3,091.7 | 3.0 | -- | 1,265 | 18 | 3.9 | 17 |
Maricopa | 137.7 | 2,180.7 | 2.6 | 117 | 1,319 | 95 | 3.5 | 117 |
Pima | 22.8 | 378.0 | 1.9 | 188 | 1,134 | 220 | 4.8 | 52 |
Footnotes: | ||||||||
Note: Data are preliminary. Covered employment and wages includes workers covered by Unemployment Insurance (UI) and Unemployment Compensation for Federal Employees (UCFE) programs. | ||||||||
| Area | Establishments | Employment June 2023 | Average weekly wage (1) |
|---|---|---|---|
United States (2) | 11,964,606 | 154,308,523 | $1,332 |
Arizona | 219,122 | 3,091,698 | 1,265 |
Apache | 626 | 16,377 | 1,063 |
Cochise | 2,548 | 34,318 | 1,106 |
Coconino | 4,004 | 63,889 | 1,022 |
Gila | 1,118 | 14,820 | 993 |
Graham | 605 | 9,928 | 1,049 |
Greenlee | 108 | 5,630 | 1,506 |
La Paz | 384 | 6,155 | 975 |
Maricopa | 137,687 | 2,180,668 | 1,319 |
Mohave | 4,823 | 54,097 | 955 |
Navajo | 1,911 | 26,946 | 961 |
Pima | 22,829 | 377,980 | 1,134 |
Pinal | 4,384 | 70,743 | 1,072 |
Santa Cruz | 1,239 | 13,485 | 1,121 |
Yavapai | 7,184 | 67,611 | 984 |
Yuma | 3,914 | 61,751 | 1,022 |
Footnotes: | |||
Note: Data are preliminary. Covered employment and wages includes workers covered by Unemployment Insurance (UI) and Unemployment Compensation for Federal Employees (UCFE) programs. | |||
| State | Establishments, second quarter (thousands) | Employment | Average weekly wage (1) | ||||
|---|---|---|---|---|---|---|---|
| June 2023 (thousands) | Percent change, June 2022–23 | Second quarter 2023 | National ranking by level | Percent change, second quarter 2022–23 | National ranking by percent change | ||
United States (2) | 11,964.6 | 154,308.5 | 2.4 | $1,332 | -- | 3.2 | -- |
Alabama | 156.7 | 2,079.2 | 2.7 | 1,107 | 35 | 4.0 | 13 |
Alaska | 25.3 | 342.4 | 3.6 | 1,285 | 15 | 3.9 | 17 |
Arizona | 219.1 | 3,091.7 | 3.0 | 1,265 | 18 | 3.9 | 17 |
Arkansas | 103.2 | 1,284.8 | 2.6 | 1,033 | 50 | 3.8 | 19 |
California | 1,767.7 | 18,151.1 | 0.9 | 1,624 | 4 | 3.4 | 26 |
Colorado | 256.6 | 2,914.3 | 2.7 | 1,426 | 8 | 4.8 | 5 |
Connecticut | 148.0 | 1,692.0 | 1.8 | 1,511 | 6 | 3.8 | 19 |
Delaware | 41.6 | 476.2 | 3.0 | 1,248 | 19 | 2.3 | 44 |
District of Columbia | 51.3 | 762.6 | 2.2 | 2,193 | 1 | 3.7 | 23 |
Florida | 891.8 | 9,547.7 | 3.7 | 1,234 | 21 | 4.3 | 8 |
Georgia | 384.5 | 4,802.8 | 2.2 | 1,247 | 20 | 2.6 | 39 |
Hawaii | 56.5 | 636.0 | 3.2 | 1,198 | 24 | 4.0 | 13 |
Idaho | 94.3 | 855.8 | 3.1 | 1,038 | 48 | 3.3 | 30 |
Illinois | 410.8 | 6,101.2 | 1.9 | 1,357 | 12 | 2.6 | 39 |
Indiana | 191.1 | 3,164.7 | 1.5 | 1,102 | 37 | 2.0 | 47 |
Iowa | 110.5 | 1,581.8 | 1.1 | 1,082 | 42 | 2.6 | 39 |
Kansas | 98.7 | 1,428.6 | 3.2 | 1,081 | 43 | 4.0 | 13 |
Kentucky | 150.1 | 1,974.5 | 2.8 | 1,100 | 38 | 3.0 | 35 |
Louisiana | 153.8 | 1,887.3 | 1.7 | 1,093 | 40 | 2.7 | 38 |
Maine | 65.0 | 654.1 | 2.1 | 1,123 | 34 | 3.3 | 30 |
Maryland | 187.1 | 2,716.4 | 2.1 | 1,402 | 9 | 2.2 | 45 |
Massachusetts | 296.4 | 3,703.4 | 1.2 | 1,670 | 2 | 2.0 | 47 |
Michigan | 318.4 | 4,463.0 | 2.5 | 1,220 | 23 | 3.4 | 26 |
Minnesota | 205.7 | 2,964.0 | 2.3 | 1,315 | 14 | 2.2 | 45 |
Mississippi | 87.7 | 1,158.0 | 1.4 | 924 | 51 | 4.3 | 8 |
Missouri | 246.7 | 2,908.7 | 2.0 | 1,150 | 32 | 4.0 | 13 |
Montana | 65.5 | 521.0 | 3.0 | 1,072 | 46 | 4.4 | 7 |
Nebraska | 76.8 | 1,022.1 | 3.0 | 1,092 | 41 | 3.4 | 26 |
Nevada | 106.7 | 1,522.8 | 3.2 | 1,189 | 27 | 2.9 | 36 |
New Hampshire | 65.3 | 694.8 | 2.3 | 1,387 | 10 | 3.2 | 32 |
New Jersey | 330.2 | 4,341.4 | 2.8 | 1,464 | 7 | 1.6 | 50 |
New Mexico | 66.7 | 859.1 | 3.8 | 1,107 | 35 | 6.5 | 1 |
New York | 699.6 | 9,623.8 | 2.4 | 1,621 | 5 | 2.5 | 42 |
North Carolina | 370.9 | 4,857.5 | 3.3 | 1,198 | 24 | 3.4 | 26 |
North Dakota | 35.4 | 430.4 | 2.9 | 1,184 | 28 | 4.9 | 3 |
Ohio | 341.8 | 5,521.9 | 1.7 | 1,160 | 31 | 3.1 | 34 |
Oklahoma | 129.7 | 1,669.0 | 3.1 | 1,052 | 47 | 3.6 | 25 |
Oregon | 200.8 | 2,010.7 | 2.2 | 1,281 | 16 | 2.4 | 43 |
Pennsylvania | 393.0 | 6,014.8 | 1.9 | 1,277 | 17 | 2.0 | 47 |
Rhode Island | 48.0 | 498.8 | 1.3 | 1,221 | 22 | -0.3 | 51 |
South Carolina | 175.9 | 2,248.6 | 2.8 | 1,079 | 44 | 3.7 | 23 |
South Dakota | 39.6 | 466.8 | 2.7 | 1,035 | 49 | 3.8 | 19 |
Tennessee | 215.9 | 3,254.2 | 3.0 | 1,195 | 26 | 3.8 | 19 |
Texas | 824.9 | 13,716.3 | 3.9 | 1,322 | 13 | 3.2 | 32 |
Utah | 135.7 | 1,699.4 | 2.8 | 1,183 | 29 | 4.2 | 11 |
Vermont | 31.8 | 310.3 | 2.3 | 1,175 | 30 | 4.1 | 12 |
Virginia | 357.1 | 4,082.3 | 2.8 | 1,371 | 11 | 4.3 | 8 |
Washington | 241.0 | 3,639.8 | 2.7 | 1,649 | 3 | 4.9 | 3 |
West Virginia | 58.8 | 695.7 | 2.9 | 1,075 | 45 | 6.1 | 2 |
Wisconsin | 204.4 | 2,975.8 | 1.9 | 1,126 | 33 | 2.9 | 36 |
Wyoming | 30.5 | 288.6 | 2.7 | 1,096 | 39 | 4.6 | 6 |
Puerto Rico | 52.6 | 929.7 | 1.6 | 622 | (3) | 4.2 | (3) |
Virgin Islands | 3.8 | 36.3 | 4.7 | 992 | (3) | 1.1 | (3) |
Footnotes: | |||||||
Note: Data are preliminary. Covered employment and wages includes workers covered by Unemployment Insurance (UI) and Unemployment Compensation for Federal Employees (UCFE) programs. | |||||||
Last Modified Date: Wednesday, January 10, 2024