An official website of the United States government
An official website of the United States government
The .gov means it's official.
Federal government websites often end in .gov or .mil. Before sharing sensitive information,
make sure you're on a federal government site.
The site is secure.
The
https:// ensures that you are connecting to the official website and that any
information you provide is encrypted and transmitted securely.

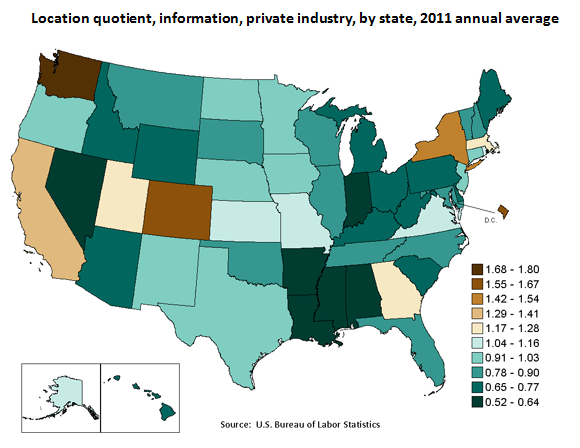
| State | Location quotient |
|---|---|
Washington | 1.80 |
District of Columbia | 1.62 |
Colorado | 1.58 |
New York | 1.46 |
California | 1.40 |
Georgia | 1.27 |
Massachusetts | 1.23 |
Utah | 1.18 |
Kansas | 1.07 |
Alaska | 1.05 |
Rhode Island | 1.05 |
Missouri | 1.04 |
Virginia | 1.04 |
Minnesota | 0.97 |
New Jersey | 0.97 |
Oregon | 0.96 |
Iowa | 0.93 |
Nebraska | 0.93 |
Connecticut | 0.92 |
North Dakota | 0.92 |
New Mexico | 0.91 |
Texas | 0.91 |
Florida | 0.88 |
North Carolina | 0.88 |
New Hampshire | 0.87 |
Montana | 0.86 |
Illinois | 0.85 |
Maryland | 0.85 |
Wisconsin | 0.83 |
Oklahoma | 0.82 |
Vermont | 0.82 |
South Dakota | 0.80 |
Tennessee | 0.80 |
Idaho | 0.77 |
Kentucky | 0.76 |
Pennsylvania | 0.76 |
West Virginia | 0.75 |
Arizona | 0.74 |
Wyoming | 0.74 |
Hawaii | 0.73 |
Ohio | 0.72 |
South Carolina | 0.72 |
Maine | 0.69 |
Delaware | 0.67 |
Michigan | 0.65 |
Alabama | 0.64 |
Arkansas | 0.64 |
Louisiana | 0.63 |
Indiana | 0.59 |
Mississippi | 0.57 |
Nevada | 0.52 |
| industry | Year | |||||||||||
|---|---|---|---|---|---|---|---|---|---|---|---|---|
| 2001 | 2002 | 2003 | 2004 | 2005 | 2006 | 2007 | 2008 | 2009 | 2010 | 2011 | ||
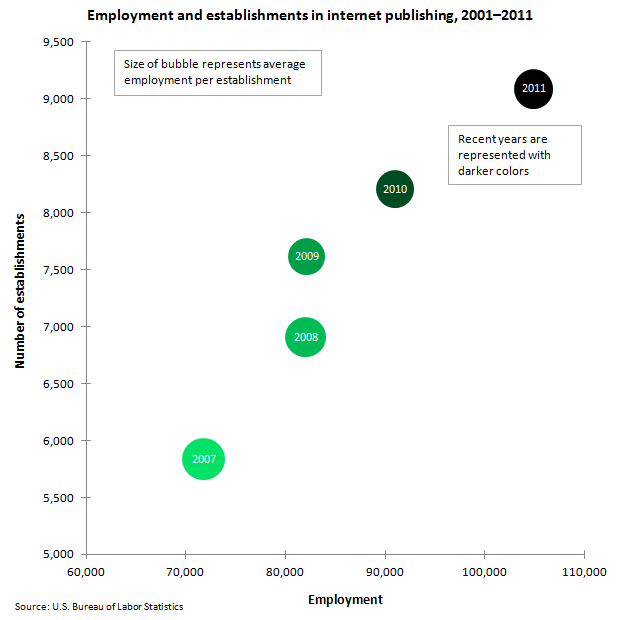
Internet publishing | ||||||||||||
Employment | 71,768 | 82,019 | 82,111 | 90,986 | 104,892 | |||||||
Number of establishments | 5,836 | 6,909 | 7,618 | 8,207 | 9,089 | |||||||
Average employment per establishment | 12.3 | 11.9 | 10.8 | 11.1 | 11.5 | |||||||
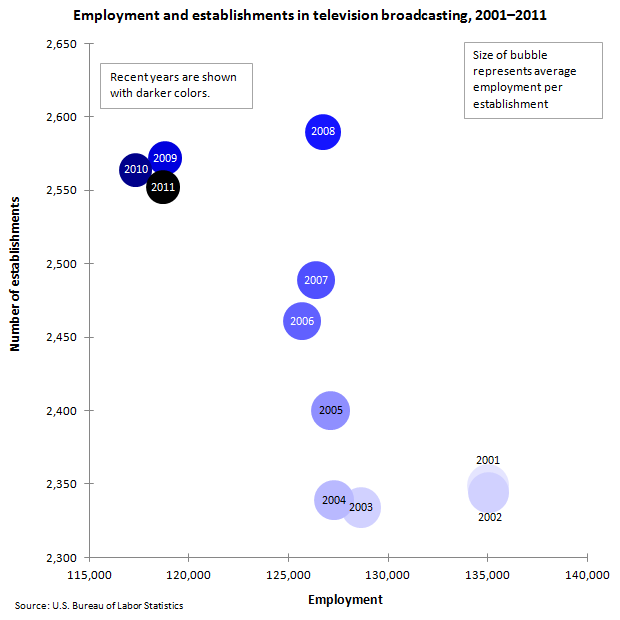
Television broadcasting | ||||||||||||
Employment | 135,033 | 131,026 | 128,652 | 127,282 | 127,127 | 125,687 | 126,380 | 126,716 | 118,799 | 117,333 | 118,702 | |
Number of establishments | 2,349 | 2,344 | 2,334 | 2,339 | 2,400 | 2,461 | 2,489 | 2,590 | 2,572 | 2,564 | 2,552 | |
Average employment per establishment | 57.5 | 55.9 | 55.1 | 54.4 | 53.0 | 51.1 | 50.8 | 48.9 | 46.2 | 45.8 | 46.5 | |
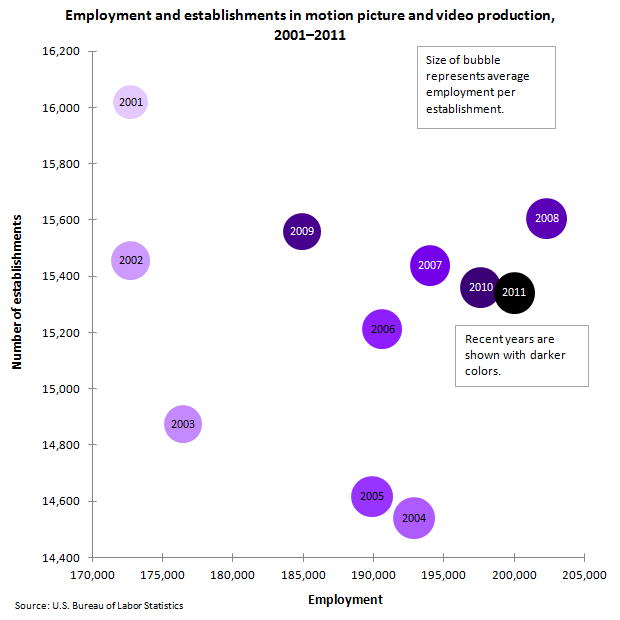
Motion picture and video production | ||||||||||||
Employment | 172,722 | 187,443 | 176,455 | 192,856 | 189,880 | 190,634 | 194,012 | 202,318 | 184,921 | 197,627 | 200,020 | |
Number of establishments | 16,019 | 15,455 | 14,875 | 14,539 | 14,617 | 15,211 | 15,438 | 15,605 | 15,559 | 15,359 | 15,341 | |
Average employment per establishment | 10.8 | 12.1 | 11.9 | 13.3 | 13.0 | 12.5 | 12.6 | 13.0 | 11.9 | 12.9 | 13.0 | |
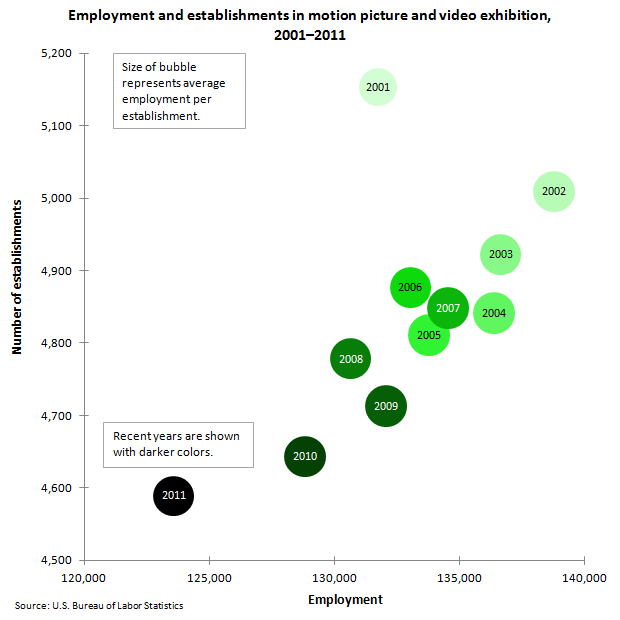
Motion picture and video exhibition | ||||||||||||
Employment | 131,761 | 138,789 | 136,649 | 136,376 | 133,802 | 133,039 | 134,542 | 130,655 | 132,073 | 128,821 | 123,572 | /tr> |
Number of establishments | 5,153 | 5,009 | 4,922 | 4,841 | 4,811 | 4,877 | 4,848 | 4,778 | 4,713 | 4,643 | 4,589 | |
Average employment per establishment | 25.6 | 27.7 | 27.8 | 28.2 | 27.8 | 27.3 | 27.8 | 27.3 | 28.0 | 27.7 | 26.9 | |
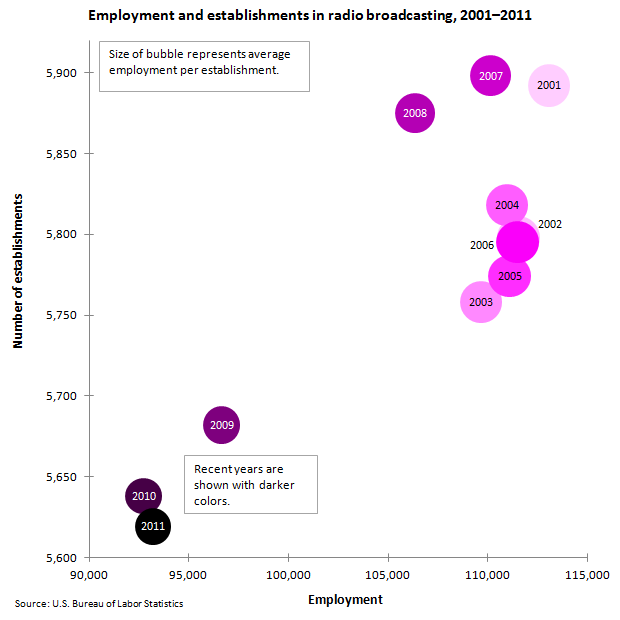
Radio broadcasting | ||||||||||||
Employment | 113,090 | 111,543 | 109,661 | 110,971 | 111,092 | 111,497 | 110,162 | 106,342 | 96,642 | 92,727 | 93,205 | |
Number of establishments | 5,892 | 5,798 | 5,758 | 5,818 | 5,774 | 5,795 | 5,898 | 5,875 | 5,682 | 5,638 | 5,619 | |
Average employment per establishment | 19.2 | 19.2 | 19.0 | 19.1 | 19.2 | 19.2 | 18.7 | 18.1 | 17.0 | 16.4 | 16.6 | |
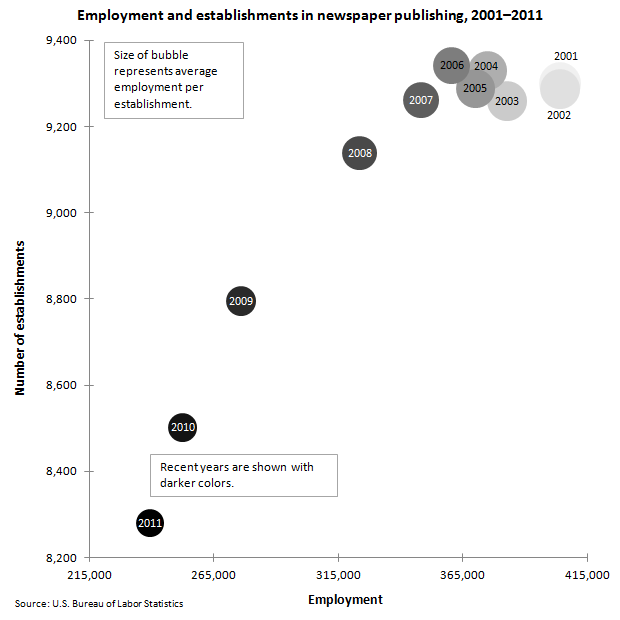
Newspaper publishing | ||||||||||||
Employment | 404,072 | 387,333 | 382,608 | 375,099 | 370,065 | 360,491 | 348,247 | 323,601 | 276,044 | 252,629 | 239,375 | |
Number of establishments | 9,300 | 9,287 | 9,259 | 9,329 | 9,288 | 9,342 | 9,262 | 9,138 | 8,795 | 8,502 | 8,280 | |
Average employment per establishment | 43.4 | 41.7 | 41.3 | 40.2 | 39.8 | 38.6 | 37.6 | 35.4 | 31.4 | 29.7 | 28.9 | |
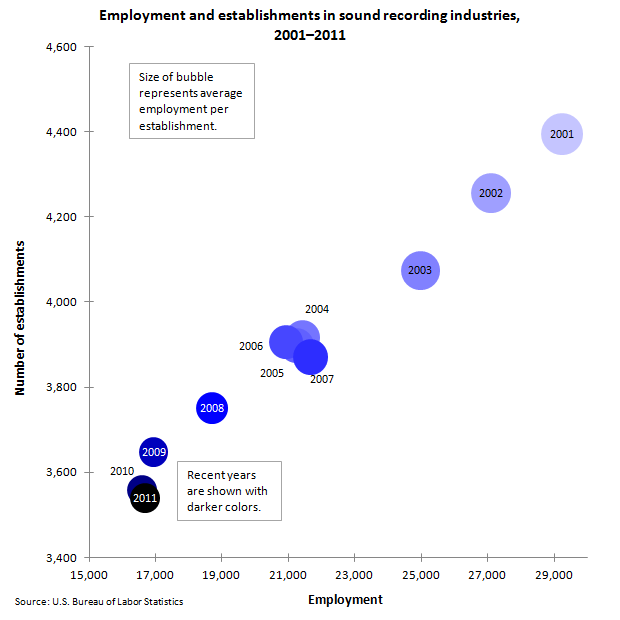
Sound recording industries | ||||||||||||
Employment | 29,246 | 27,100 | 24,969 | 21,429 | 21,250 | 20,928 | 21,664 | 18,696 | 16,940 | 16,584 | 16,679 | |
Number of establishments | 4,395 | 4,256 | 4,075 | 3,916 | 3,897 | 3,907 | 3,871 | 3,751 | 3,648 | 3,558 | 3,540 | |
Average employment per establishment | 6.7 | 6.4 | 6.1 | 5.5 | 5.5 | 5.4 | 5.6 | 5.0 | 4.6 | 4.7 | 4.7 | |
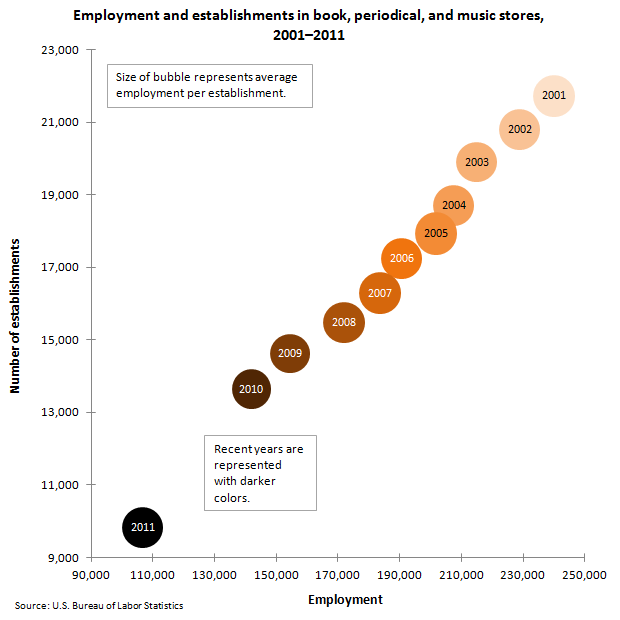
Book, periodical, and music stores | ||||||||||||
Employment | 240,104 | 228,873 | 214,938 | 207,497 | 201,694 | 190,643 | 183,531 | 171,889 | 154,479 | 141,940 | 106,611 | |
Number of establishments | 21,728 | 20,791 | 19,906 | 18,705 | 17,933 | 17,236 | 16,286 | 15,474 | 14,623 | 13,643 | 9,817 | |
Average employment per establishment | 11.1 | 11.0 | 10.8 | 11.1 | 11.2 | 11.1 | 11.3 | 11.1 | 10.6 | 10.4 | 10.9 | |
| Occupation | Employment | Annual wages | ||
|---|---|---|---|---|
| 25th percentile | 50th percentile (median) | 75th percentile | ||
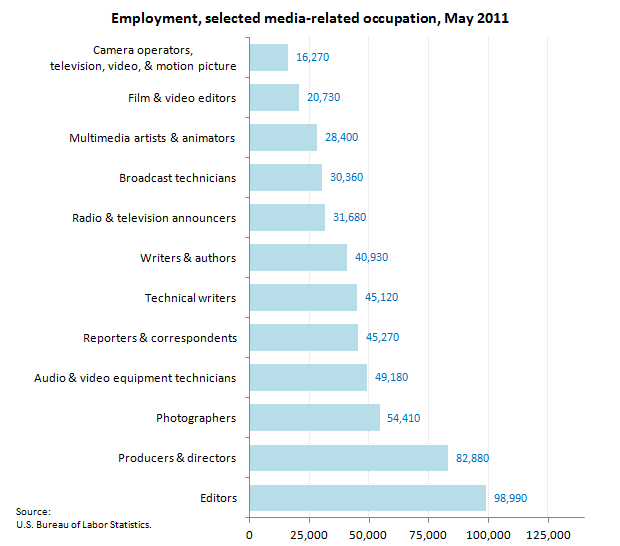
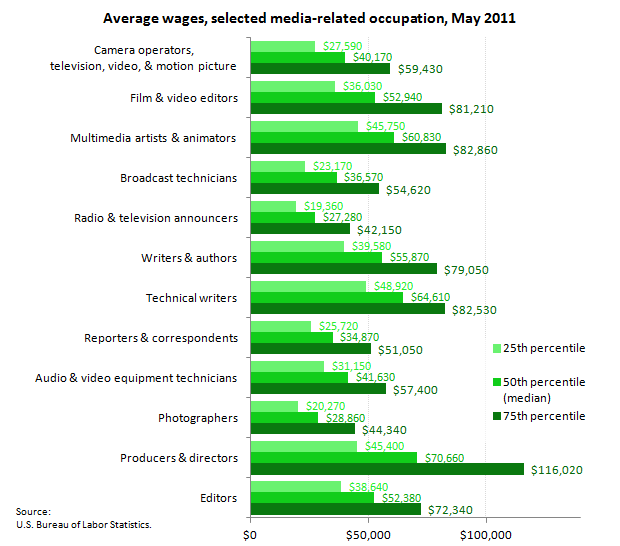
Editors | 98,990 | $38,640 | $52,380 | $72,340 |
Producers and directors | 82,880 | 45,400 | 70,660 | 116,020 |
Photographers | 54,410 | 20,270 | 28,860 | 44,340 |
Audio and video equipment technicians | 49,180 | 31,150 | 41,630 | 57,400 |
Reporters and correspondents | 45,270 | 25,720 | 34,870 | 51,050 |
Technical writers | 45,120 | 48,920 | 64,610 | 82,530 |
Writers and authors | 40,930 | 39,580 | 55,870 | 79,050 |
Radio and television announcers | 31,680 | 19,360 | 27,280 | 42,150 |
Broadcast technicians | 30,360 | 23,170 | 36,570 | 54,620 |
Multimedia artists and animators | 28,400 | 45,750 | 60,830 | 82,860 |
Film and video editors | 20,730 | 36,030 | 52,940 | 81,210 |
Camera operators, television, video, and motion picture | 16,270 | 27,590 | 40,170 | 59,430 |
| Occupation | Projected employment in 2020 | Change, 2010-2020 | |
|---|---|---|---|
| Percent change | Numeric change | ||
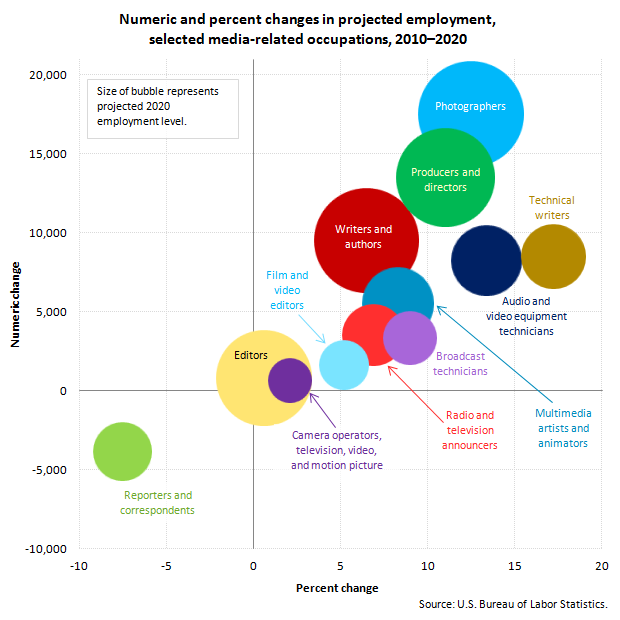
Photographers | 156,900 | 12.5 | 17,500 |
Writers and authors | 155,400 | 6.5 | 9,500 |
Producers and directors | 136,000 | 11.0 | 13,500 |
Editors | 128,000 | 0.6 | 800 |
Multimedia artists and animators | 72,000 | 8.3 | 5,500 |
Audio and video equipment technicians | 69,400 | 13.4 | 8,200 |
Technical writers | 58,000 | 17.2 | 8,500 |
Radio and television announcers | 53,600 | 6.9 | 3,500 |
Reporters and correspondents | 48,000 | -7.5 | -3,900 |
Broadcast technicians | 40,000 | 9.0 | 3,300 |
Film and video editors | 33,200 | 5.2 | 1,600 |
Camera operators, television, video, and motion picture | 27,300 | 2.1 | 600 |
Source: Employment Projections
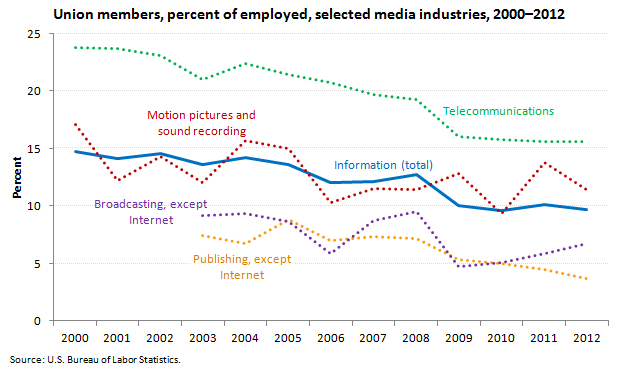
| Year | Industry | ||||
|---|---|---|---|---|---|
| Information (total) | Publishing, except Internet | Motion pictures and sound recording | Broadcasting, except Internet | Telecommunications | |
2000 | 14.7 | 17.1 | 23.8 | ||
2001 | 14.1 | 12.2 | 23.7 | ||
2002 | 14.6 | 14.3 | 23.1 | ||
2003 | 13.6 | 7.4 | 12.0 | 9.2 | 21.0 |
2004 | 14.2 | 6.7 | 15.7 | 9.3 | 22.4 |
2005 | 13.6 | 8.8 | 15.0 | 8.6 | 21.4 |
2006 | 12.0 | 7.0 | 10.3 | 5.9 | 20.7 |
2007 | 12.1 | 7.3 | 11.5 | 8.7 | 19.7 |
2008 | 12.7 | 7.2 | 11.4 | 9.5 | 19.3 |
2009 | 10.0 | 5.3 | 12.8 | 4.7 | 16.0 |
2010 | 9.6 | 5.0 | 9.3 | 5.1 | 15.8 |
2011 | 10.1 | 4.5 | 13.8 | 5.9 | 15.6 |
2012 | 9.7 | 3.7 | 11.4 | 6.7 | 15.6 |
Source: Current Population Survey
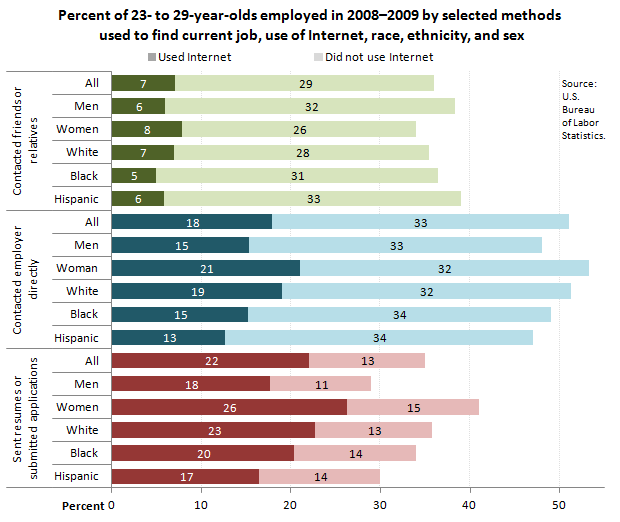
| Demographic characteristic and internet use | Method used to find job | ||
|---|---|---|---|
| Contacted friends or relatives | Contacted employer directly | Sent resumes or submitted applications | |
Total | 36 | 50 | 35 |
Did not use Internet | 29 | 33 | 13 |
Used Internet | 7 | 18 | 22 |
Men | 38 | 48 | 29 |
Did not use Internet | 32 | 33 | 11 |
Used Internet | 6 | 15 | 18 |
Women | 34 | 53 | 41 |
Did not use Internet | 26 | 32 | 15 |
Used Internet | 8 | 21 | 26 |
White | 35 | 51 | 36 |
Did not use Internet | 28 | 32 | 13 |
Used Internet | 7 | 19 | 23 |
Black or African American | 36 | 49 | 34 |
Did not use Internet | 31 | 34 | 14 |
Used Internet | 5 | 15 | 20 |
Hispanic or Latino | 39 | 46 | 30 |
Did not use Internet | 33 | 34 | 14 |
Used Internet | 6 | 13 | 16 |
Source: National Longitudinal Surveys
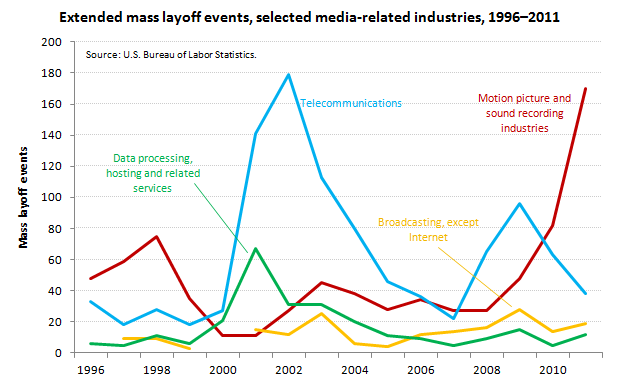
| Year | Motion picture and sound recording industries | Broadcasting, except Internet | Telecommunications | Data processing, hosting and related services | ||||
|---|---|---|---|---|---|---|---|---|
| Layoff events | Separations | Layoff events | Separations | Layoff events | Separations | Layoff events | Separations | |
1996 | 48 | 30,585 | 33 | 6,612 | 6 | 5,118 | ||
1997 | 59 | 48,687 | 9 | 1,356 | 18 | 3,237 | 5 | 678 |
1998 | 75 | 31,320 | 9 | 1,818 | 28 | 4,512 | 11 | 1,677 |
1999 | 35 | 13,517 | 3 | 715 | 18 | 3,930 | 6 | 1,411 |
2000 | 11 | 3,180 | 27 | 4,375 | 21 | 4,263 | ||
2001 | 11 | 2,530 | 15 | 1,822 | 141 | 30,607 | 67 | 11,281 |
2002 | 27 | 12,525 | 12 | 2,364 | 179 | 32,073 | 31 | 3,553 |
2003 | 45 | 28,107 | 25 | 4,222 | 113 | 21,773 | 31 | 5,769 |
2004 | 38 | 10,691 | 6 | 1,014 | 80 | 17,189 | 20 | 3,965 |
2005 | 28 | 8,719 | 4 | 326 | 46 | 7,604 | 11 | 1,788 |
2006 | 34 | 6,511 | 12 | 2,902 | 36 | 5,119 | 9 | 1,959 |
2007 | 27 | 5,359 | 14 | 1,675 | 22 | 2,638 | 5 | 996 |
2008 | 27 | 12,246 | 16 | 2,020 | 65 | 10,836 | 9 | 1,375 |
2009 | 48 | 11,444 | 28 | 4,101 | 96 | 17,452 | 15 | 2,087 |
2010 | 82 | 31,006 | 14 | 1,687 | 63 | 12,770 | 5 | 1,978 |
2011 | 170 | 52,496 | 19 | 2,312 | 38 | 13,432 | 12 | 1,472 |
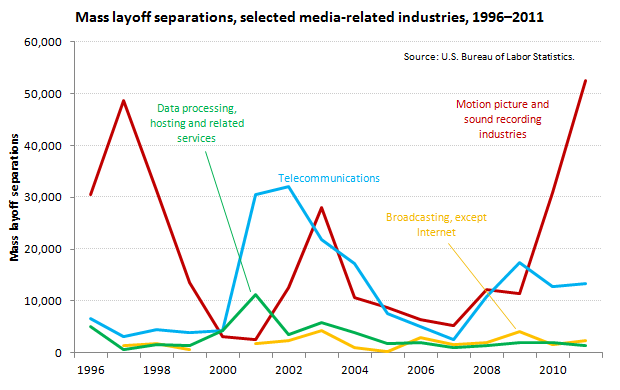
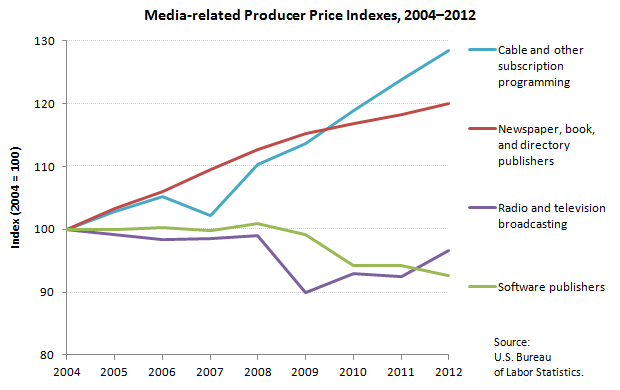
| Year | Cable and other subscription programming | Newspaper, book, and directory publishers | Radio and television broadcasting | Software publishers |
|---|---|---|---|---|
2004 | 100.0 | 100.0 | 100.0 | 100.0 |
2005 | 102.9 | 103.3 | 99.1 | 100.0 |
2006 | 105.2 | 106.1 | 98.3 | 100.3 |
2007 | 102.2 | 109.5 | 98.5 | 99.8 |
2008 | 110.4 | 112.7 | 98.9 | 100.9 |
2009 | 113.6 | 115.2 | 90.0 | 99.1 |
2010 | 118.8 | 116.8 | 93.0 | 94.3 |
2011 | 123.8 | 118.2 | 92.5 | 94.2 |
2012(p) | 128.5 | 120.1 | 96.7 | 92.7 |
Footnotes: | ||||
NOTE: 2004 = 100.0 | ||||
Source: Producer Price Index
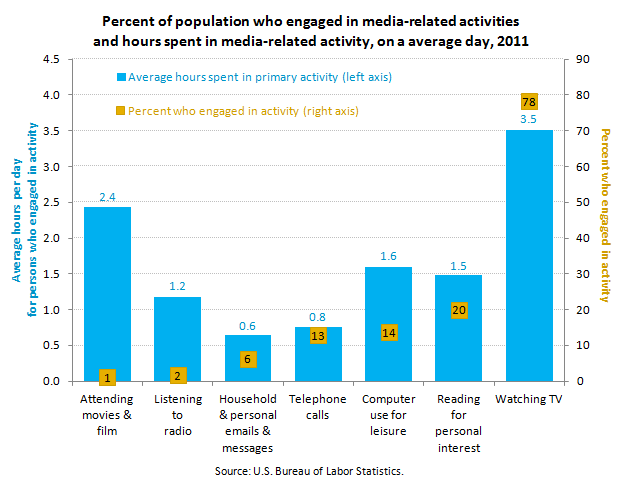
| Activity | Average hours per day for persons who engaged in activity | Percent who engaged in activity |
|---|---|---|
Attending movies and film | 2.43 | 1.10 |
Listening to radio | 1.18 | 1.60 |
Household and personal emails and messages | 0.64 | 6.30 |
Telephone calls | 0.75 | 12.90 |
Computer use for leisure | 1.60 | 13.70 |
Reading for personal interest | 1.48 | 20.00 |
Watching TV | 3.51 | 78.30 |
NOTE: Data refer to persons in the civilian noninstitutional population, age 15 years and older. A primary activity is a person's main activity. Other activities done simultaneously are not included in these data. Some activities frequently are done at the same time and secondary to other activities, for example, someone might be driving as a primary activity while also listening to the radio. | ||
Source: American Time Use Survey
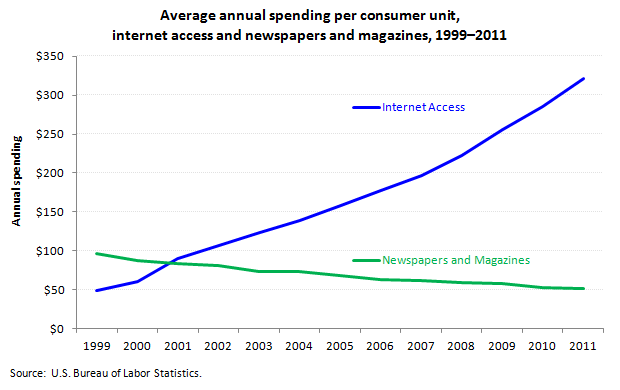
| Year | Newspapers and magazines | Internet access |
|---|---|---|
1999 | $97 | $49 |
2000 | 88 | 61 |
2001 | 84 | 90 |
2002 | 81 | 107 |
2003 | 73 | 124 |
2004 | 74 | 139 |
2005 | 68 | 158 |
2006 | 63 | 178 |
2007 | 62 | 197 |
2008 | 60 | 222 |
2009 | 58 | 256 |
2010 | 53 | 286 |
2011 | 52 | 321 |
Source: Consumer Expenditure Survey
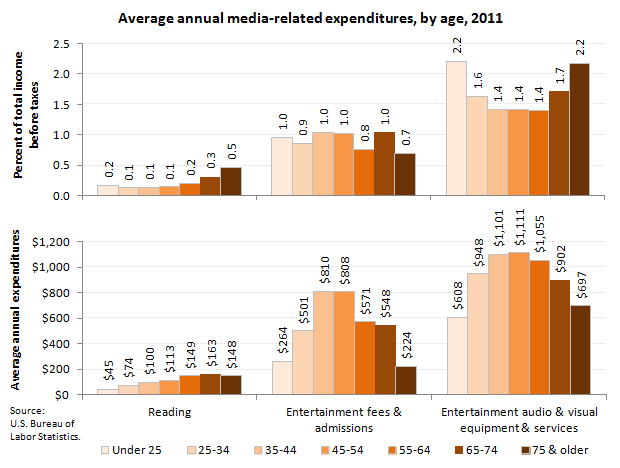
| Age and item | Reading | Entertainment fees and admissions | Entertainment audio and visual equipment and services |
|---|---|---|---|
Under 25 years | |||
Average annual expenditures | $45 | $264 | $608 |
Percent of total income before taxes | 0.2 | 1.0 | 2.2 |
25-34 years | |||
Average annual expenditures | 74 | 501 | 948 |
Percent of total income before taxes | 0.1 | 0.9 | 1.6 |
35-44 years | |||
Average annual expenditures | 100 | 810 | 1101 |
Percent of total income before taxes | 0.1 | 1.0 | 1.4 |
45-54 years | |||
Average annual expenditures | 113 | 808 | 1111 |
Percent of total income before taxes | 0.1 | 1.0 | 1.4 |
55-64 years | |||
Average annual expenditures | 149 | 571 | 1055 |
Percent of total income before taxes | 0.2 | 0.8 | 1.4 |
65-74 years | |||
Average annual expenditures | 163 | 548 | 902 |
Percent of total income before taxes | 0.3 | 1.0 | 1.7 |
75 years and older | |||
Average annual expenditures | 148 | 224 | 697 |
Percent of total income before taxes | 0.5 | 0.7 | 2.2 |
Source: Consumer Expenditure Survey | Chart
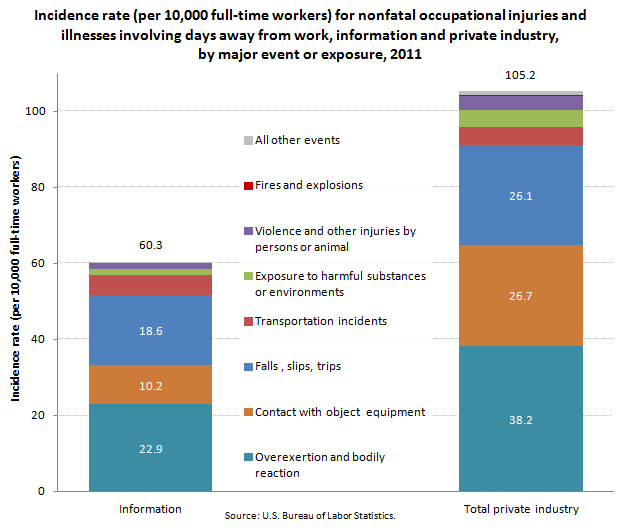
| Event or exposure | Information | All private industry |
|---|---|---|
Inicidence rate, total | 60.3 | 105.2 |
Overexertion and bodily reaction | 22.9 | 38.2 |
Contact with object equipment | 10.2 | 26.7 |
Falls , slips, trips | 18.6 | 26.1 |
Transportation incidents | 5.1 | 4.7 |
Exposure to harmful substances or environments | 1.8 | 4.5 |
Violence and other injuries by persons or animal | 1.4 | 3.8 |
Fires and explosions | 0.2 | |
All other events | 0.2 | 1.0 |