An official website of the United States government
An official website of the United States government
The .gov means it's official.
Federal government websites often end in .gov or .mil. Before sharing sensitive information,
make sure you're on a federal government site.
The site is secure.
The
https:// ensures that you are connecting to the official website and that any
information you provide is encrypted and transmitted securely.

| Occupation | Employment (millions) |
|---|---|
Retail salespersons | 4.5 |
Cashiers | 3.3 |
Combined food preparation and serving workers, including fast food | 3.0 |
Office clerks, general | 2.8 |
Registered nurses | 2.7 |
Waiters and waitresses | 2.4 |
Customer service representatives | 2.4 |
Laborers and freight, stock, and material movers, hand | 2.3 |
Secretaries and administrative assistants, except legal, medical, and executive | 2.2 |
Janitors and cleaners, except maids and housekeeping cleaners | 2.1 |
| Occupation | Annual mean wage |
|---|---|
Retail salespersons | $25,370 |
Cashiers | 20,420 |
Combined food preparation and serving workers, including fast food | 18,880 |
Office clerks, general | 29,990 |
Registered nurses | 68,910 |
Waiters and waitresses | 20,880 |
Customer service representatives | 33,370 |
Laborers and freight, stock, and material movers, hand | 26,690 |
Secretaries and administrative assistants, except legal, medical, and executive | 34,000 |
Janitors and cleaners, except maids and housekeeping cleaners | 25,140 |
All occupations | 46,440 |
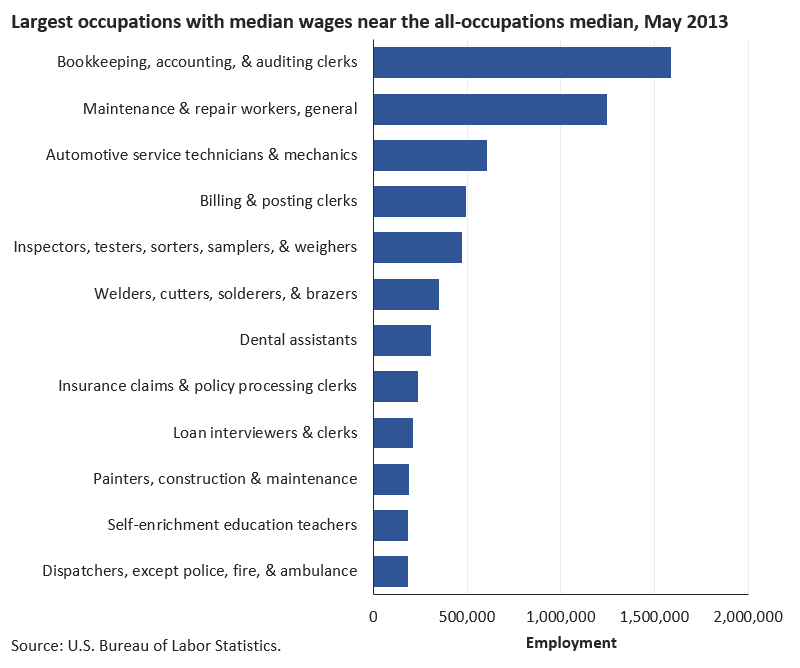
| Occupation (1) | Employment |
|---|---|
Bookkeeping, accounting, and auditing clerks | 1,586,380 |
Maintenance and repair workers, general | 1,249,080 |
Automotive service technicians and mechanics | 604,990 |
Billing and posting clerks | 493,840 |
Inspectors, testers, sorters, samplers, and weighers | 471,750 |
Welders, cutters, solderers, and brazers | 352,250 |
Dental assistants | 309,540 |
Insurance claims and policy processing clerks | 236,160 |
Loan interviewers and clerks | 213,270 |
Painters, construction and maintenance | 192,890 |
Self-enrichment education teachers | 187,180 |
Dispatchers, except police, fire, and ambulance | 185,270 |
| Footnotes: (1) These are occupations with the highest employment among occupations having median wages within 5 percent of the all-occupations median of $35,080. | |
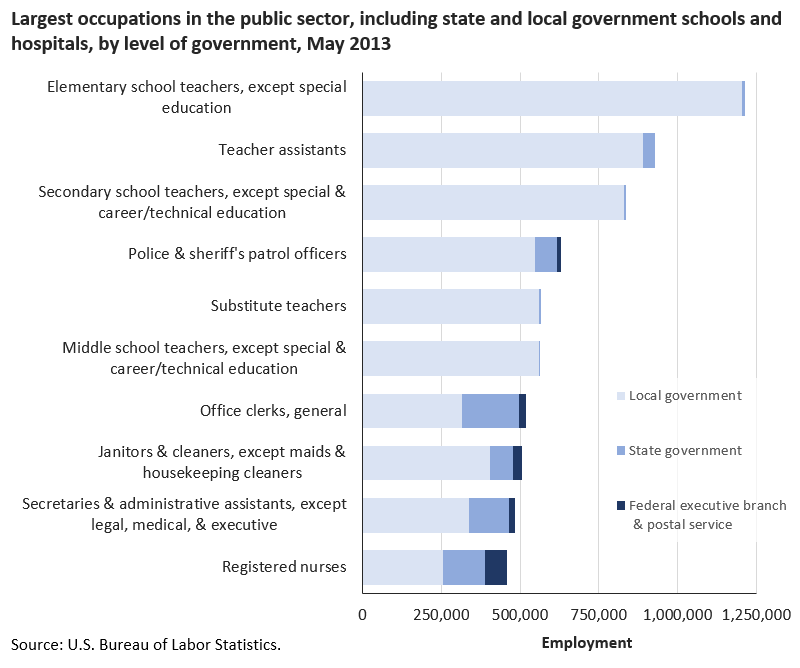
| Occupation | Federal executive branch and postal service | State government | Local government |
|---|---|---|---|
Elementary school teachers, except special education | 0 | 7,830 | 1,205,900 |
Teacher assistants | 0 | 37,230 | 891,700 |
Secondary school teachers, except special and career/technical education | 0 | 6,780 | 829,020 |
Police and sheriff's patrol officers | 12,570 | 70,020 | 547,700 |
Substitute teachers | 0 | 5,660 | 560,010 |
Middle school teachers, except special and career/technical education | 0 | 2,360 | 560,730 |
Office clerks, general | 21,510 | 182,140 | 314,710 |
Janitors and cleaners, except maids and housekeeping cleaners | 27,280 | 72,700 | 405,440 |
Secretaries and administrative assistants, except legal, medical, and executive | 19,400 | 128,250 | 337,720 |
Registered nurses | 69,930 | 132,800 | 256,710 |
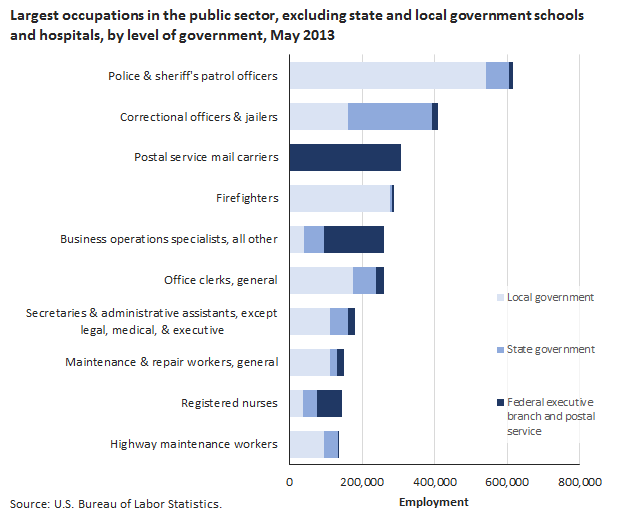
| Occupation | Federal executive branch and postal service | State government | Local government |
|---|---|---|---|
Police and sheriff's patrol officers | 12,570 | 61,190 | 542,450 |
Correctional officers and jailers | 16,340 | 232,350 | 160,980 |
Postal service mail carriers | 307,480 | 0 | 0 |
Firefighters | 7,560 | 5,490 | 275,240 |
Business operations specialists, all other | 165,670 | 54,770 | 39,370 |
Office clerks, general | 21,510 | 62,480 | 174,480 |
Secretaries and administrative assistants, except legal, medical, and executive | 19,400 | 50,940 | 109,660 |
Maintenance and repair workers, general | 17,270 | 21,320 | 110,090 |
Registered nurses | 69,930 | 37,760 | 37,550 |
Highway maintenance workers | 40 | 38,340 | 94,680 |
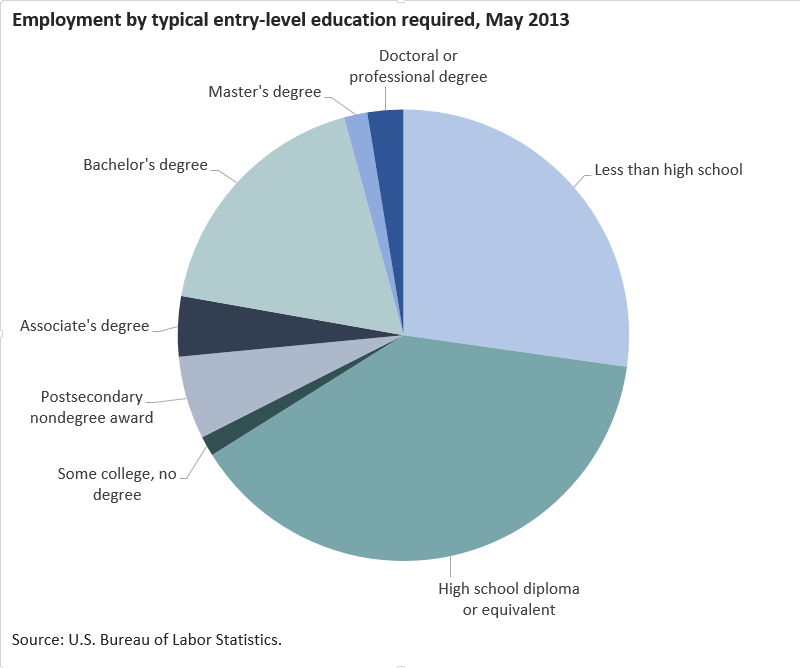
| Typical entry level education | Employment | Percent of total employment |
|---|---|---|
Less than high school | 36,116,050 | 27.2 |
High school diploma or equivalent | 51,519,730 | 38.9 |
Some college, no degree | 1,909,330 | 1.4 |
Postsecondary nondegree award | 7,874,230 | 5.9 |
Associate's degree | 5,719,860 | 4.3 |
Bachelor's degree | 23,829,150 | 18.0 |
Master's degree | 2,214,480 | 1.7 |
Doctoral or professional degree | 3,405,980 | 2.6 |
| Typical entry level education | Annual mean wage |
|---|---|
Less than high school | $23,840 |
High school diploma or equivalent | 41,170 |
Some college, no degree | 35,460 |
Postsecondary nondegree award | 38,810 |
Associate's degree | 60,080 |
Bachelor's degree | 79,590 |
Master's degree | 70,330 |
Doctoral or professional degree | 117,750 |
All occupations | 46,440 |
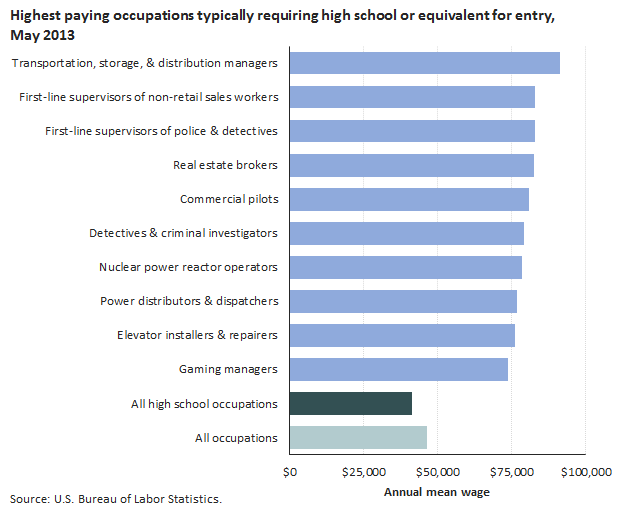
| Occupation (1) | Annual mean wage |
|---|---|
Transportation, storage, and distribution managers | $91,220 |
First-line supervisors of non-retail sales workers | 82,890 |
First-line supervisors of police and detectives | 82,710 |
Real estate brokers | 82,380 |
Commercial pilots | 80,800 |
Detectives and criminal investigators | 79,030 |
Nuclear power reactor operators | 78,400 |
Power distributors and dispatchers | 76,580 |
Elevator installers and repairers | 76,220 |
Gaming managers | 73,760 |
All high school occupations | 41,170 |
All occupations | 46,440 |
| Footnotes: (1) Excludes residual ("all other") occupations. | |
| Industry | Percent of industry employment in occupations typically requiring a bachelor's degree for entry |
|---|---|
Software publishers | 72.8 |
Computer systems design and related services | 70.3 |
Securities and commodity exchanges | 66.8 |
Securities and commodity contracts intermediation and brokerage | 66.7 |
Other financial investment activities | 64.6 |
Computer and peripheral equipment manufacturing | 64.2 |
Monetary authorities – central bank | 59.7 |
Specialized design services | 59.4 |
Architectural, engineering, and related services | 56.4 |
Elementary and secondary schools | 55.8 |
All industries | 18.0 |
| STEM category | Employment (millions) |
|---|---|
Computer occupations | 3.6 |
Engineers | 1.5 |
Drafters, engineering technicians, and mapping technicians | 0.7 |
STEM-related management | 0.6 |
STEM-related sales | 0.4 |
Life and physical science technicians | 0.3 |
Life scientists | 0.3 |
Physical scientists | 0.3 |
STEM-related postsecondary teachers | 0.2 |
Architects, surveyors, and cartographers | 0.2 |
Mathematical science occupations | 0.1 |
Note: STEM occupations are defined here to include computer and mathematical, architecture and engineering, and life and physical science occupations; managerial and postsecondary teaching occupations related to these functional areas; and sales occupations requiring scientific or technical knowledge at the postsecondary level. | |
| Occupation | Employment |
|---|---|
Software developers, applications | 643,830 |
Computer user support specialists | 541,250 |
Computer systems analysts | 507,100 |
Software developers, systems software | 373,510 |
Network and computer systems administrators | 362,310 |
Sales representatives, wholesale and manufacturing, technical and scientific products | 352,830 |
Computer and information systems managers | 319,080 |
Computer programmers | 312,340 |
Civil engineers | 262,170 |
Mechanical engineers | 258,630 |
Note: STEM occupations are defined here to include computer and mathematical, architecture and engineering, and life and physical science occupations; managerial and postsecondary teaching occupations related to these functional areas; and sales occupations requiring scientific or technical knowledge at the postsecondary level. | |
| Occupation | Annual mean wage |
|---|---|
Petroleum engineers | $149,180 |
Architectural and engineering managers | 136,540 |
Natural sciences managers | 132,850 |
Computer and information systems managers | 132,570 |
Physicists | 117,040 |
All STEM occupations | 83,940 |
All occupations | 46,440 |
Environmental science and protection technicians, including health | 45,470 |
Biological technicians | 43,710 |
Surveying and mapping technicians | 43,540 |
Forest and conservation technicians | 37,720 |
Agricultural and food science technicians | 37,010 |
Note: STEM occupations are defined here to include computer and mathematical, architecture and engineering, and life and physical science occupations; managerial and postsecondary teaching occupations related to these functional areas; and sales occupations requiring scientific or technical knowledge at the postsecondary level. | |
| Industry | STEM employment as a percentage of industry employment |
|---|---|
Computer systems design and related services | 67.0 |
Architectural, engineering, and related services | 64.0 |
Software publishers | 62.3 |
Computer and peripheral equipment manufacturing | 59.4 |
Scientific research and development services | 55.6 |
Data processing, hosting, and related services | 45.2 |
Communications equipment manufacturing | 42.5 |
Navigational, measuring, electromedical, and control instruments manufacturing | 38.0 |
Semiconductor and other electronic component manufacturing | 37.9 |
Aerospace product and parts manufacturing | 32.4 |
All industries | 6.2 |
Note: STEM occupations are defined here to include computer and mathematical, architecture and engineering, and life and physical science occupations; managerial and postsecondary teaching occupations related to these functional areas; and sales occupations requiring scientific or technical knowledge at the postsecondary level. | |
| Metropolitan area name | STEM occupations as a percentage of total area employment | Employment in STEM occupations |
|---|---|---|
Abilene, TX | 3.0% | 1,890 |
Akron, OH | 6.6 | 21,020 |
Albany, GA | 3.4 | 2,000 |
Albany-Schenectady-Troy, NY | 7.6 | 32,280 |
Albuquerque, NM | 7.6 | 28,010 |
Alexandria, LA | 2.8 | 1,690 |
Allentown-Bethlehem-Easton, PA-NJ | 4.8 | 16,090 |
Altoona, PA | 2.5 | 1,420 |
Amarillo, TX | 3.8 | 4,180 |
Ames, IA | 11.7 | 4,840 |
Anchorage, AK | 7.2 | 12,580 |
Anderson, IN | 2.2 | 830 |
Anderson, SC | 2.3 | 1,400 |
Ann Arbor, MI | 11.0 | 22,280 |
Anniston-Oxford, AL | 3.0 | 1,290 |
Appleton, WI | 3.9 | 4,490 |
Asheville, NC | 2.9 | 5,060 |
Athens-Clarke County, GA | 4.5 | 3,490 |
Atlanta-Sandy Springs-Marietta, GA | 7.0 | 162,600 |
Atlantic City-Hammonton, NJ | 3.3 | 4,430 |
Auburn-Opelika, AL | 5.0 | 2,560 |
Augusta-Richmond County, GA-SC | 5.4 | 10,850 |
Austin-Round Rock-San Marcos, TX | 11.3 | 96,360 |
Bakersfield-Delano, CA | 5.3 | 15,320 |
Baltimore-Towson, MD | 8.4 | 107,450 |
Bangor, ME | 3.7 | 2,330 |
Barnstable Town, MA | 3.8 | 3,730 |
Baton Rouge, LA | 5.5 | 20,020 |
Battle Creek, MI | 4.3 | 2,270 |
Bay City, MI | 2.8 | 950 |
Beaumont-Port Arthur, TX | 4.3 | 6,760 |
Bellingham, WA | 4.8 | 3,650 |
Bend, OR | 4.2 | 2,610 |
Billings, MT | 4.6 | 3,800 |
Binghamton, NY | 6.1 | 6,300 |
Birmingham-Hoover, AL | 5.6 | 27,600 |
Bismarck, ND | 5.6 | 3,830 |
Blacksburg-Christiansburg-Radford, VA | 8.5 | 5,400 |
Bloomington, IN | 7.1 | 5,150 |
Bloomington-Normal, IL | 7.3 | 6,350 |
Boise City-Nampa, ID | 7.4 | 19,970 |
Boston-Cambridge-Quincy, MA-NH | 10.6 | 268,330 |
Boulder, CO | 15.7 | 25,580 |
Bowling Green, KY | 3.8 | 2,240 |
Bremerton-Silverdale, WA | 8.8 | 6,830 |
Bridgeport-Stamford-Norwalk, CT | 6.5 | 27,410 |
Brownsville-Harlingen, TX | 1.4 | 1,800 |
Brunswick, GA | 2.2 | 840 |
Buffalo-Niagara Falls, NY | 5.0 | 26,740 |
Burlington, NC | 2.5 | 1,370 |
Burlington-South Burlington, VT | 9.0 | 10,540 |
Canton-Massillon, OH | 3.1 | 5,190 |
Cape Coral-Fort Myers, FL | 2.7 | 5,600 |
Cape Girardeau-Jackson, MO-IL | 2.5 | 1,060 |
Carson City, NV | 6.9 | 1,770 |
Casper, WY | 4.4 | 1,870 |
Cedar Rapids, IA | 8.0 | 11,090 |
Champaign-Urbana, IL | 5.5 | 5,320 |
Charleston, WV | 3.8 | 5,440 |
Charleston-North Charleston-Summerville, SC | 6.3 | 18,460 |
Charlotte-Gastonia-Rock Hill, NC-SC | 6.5 | 56,870 |
Charlottesville, VA | 6.3 | 6,190 |
Chattanooga, TN-GA | 4.1 | 9,330 |
Cheyenne, WY | 5.5 | 2,450 |
Chicago-Joliet-Naperville, IL-IN-WI | 5.9 | 255,060 |
Chico, CA | 2.8 | 1,940 |
Cincinnati-Middletown, OH-KY-IN | 6.7 | 66,320 |
Clarksville, TN-KY | 3.4 | 2,770 |
Cleveland, TN | 3.9 | 1,510 |
Cleveland-Elyria-Mentor, OH | 6.0 | 60,290 |
Coeur d'Alene, ID | 3.8 | 2,020 |
College Station-Bryan, TX | 8.8 | 8,470 |
Colorado Springs, CO | 8.7 | 21,390 |
Columbia, MO | 6.2 | 5,470 |
Columbia, SC | 5.6 | 19,310 |
Columbus, GA-AL | 5.0 | 5,580 |
Columbus, IN | 12.7 | 5,960 |
Columbus, OH | 7.6 | 71,810 |
Corpus Christi, TX | 3.1 | 5,660 |
Corvallis, OR | 15.3 | 5,050 |
Crestview-Fort Walton Beach-Destin, FL | 8.8 | 6,580 |
Cumberland, MD-WV | 3.4 | 1,260 |
Dallas-Fort Worth-Arlington, TX | 7.5 | 228,580 |
Dalton, GA | 3.7 | 2,270 |
Danbury, CT | 4.9 | 3,380 |
Danville, IL | 3.3 | 890 |
Danville, VA | 1.8 | 670 |
Davenport-Moline-Rock Island, IA-IL | 4.7 | 8,480 |
Dayton, OH | 7.8 | 28,750 |
Decatur, AL | 5.0 | 2,640 |
Decatur, IL | 2.4 | 1,160 |
Deltona-Daytona Beach-Ormond Beach, FL | 3.0 | 4,630 |
Denver-Aurora-Broomfield, CO | 9.1 | 116,490 |
Des Moines-West Des Moines, IA | 6.4 | 21,230 |
Detroit-Warren-Livonia, MI | 8.7 | 157,070 |
Dothan, AL | 2.1 | 1,170 |
Dover, DE | 3.9 | 2,380 |
Dubuque, IA | 5.2 | 2,980 |
Duluth, MN-WI | 4.6 | 5,710 |
Durham-Chapel Hill, NC | 14.1 | 39,100 |
Eau Claire, WI | 4.7 | 3,710 |
El Centro, CA | 1.9 | 990 |
El Paso, TX | 2.7 | 7,730 |
Elizabethtown, KY | 4.0 | 1,890 |
Elkhart-Goshen, IN | 3.3 | 3,790 |
Elmira, NY | 2.6 | 940 |
Erie, PA | 3.2 | 4,030 |
Eugene-Springfield, OR | 4.9 | 6,840 |
Evansville, IN-KY | 3.6 | 6,090 |
Fairbanks, AK | 8.3 | 2,950 |
Fargo, ND-MN | 5.2 | 6,760 |
Farmington, NM | 2.9 | 1,440 |
Fayetteville, NC | 3.2 | 3,990 |
Fayetteville-Springdale-Rogers, AR-MO | 5.5 | 11,470 |
Flagstaff, AZ | 5.0 | 2,810 |
Flint, MI | 2.8 | 3,750 |
Florence, SC | 3.7 | 3,000 |
Florence-Muscle Shoals, AL | 2.5 | 1,300 |
Fond du Lac, WI | 4.1 | 1,830 |
Fort Collins-Loveland, CO | 10.2 | 13,940 |
Fort Smith, AR-OK | 2.4 | 2,650 |
Fort Wayne, IN | 4.5 | 9,070 |
Fresno, CA | 3.0 | 9,600 |
Gadsden, AL | 1.1 | 360 |
Gainesville, FL | 6.7 | 8,010 |
Gainesville, GA | 2.7 | 2,020 |
Glens Falls, NY | 1.9 | 1,000 |
Goldsboro, NC | 2.5 | 990 |
Grand Forks, ND-MN | 4.2 | 2,090 |
Grand Junction, CO | 3.3 | 1,910 |
Grand Rapids-Wyoming, MI | 5.6 | 22,090 |
Great Falls, MT | 3.3 | 1,140 |
Greeley, CO | 3.7 | 3,210 |
Green Bay, WI | 5.3 | 8,760 |
Greensboro-High Point, NC | 4.6 | 15,920 |
Greenville, NC | 3.9 | 2,970 |
Greenville-Mauldin-Easley, SC | 6.6 | 20,120 |
Gulfport-Biloxi, MS | 4.4 | 4,440 |
Hagerstown-Martinsburg, MD-WV | 4.6 | 4,620 |
Hanford-Corcoran, CA | 1.8 | 670 |
Harrisburg-Carlisle, PA | 6.7 | 20,580 |
Harrisonburg, VA | 3.2 | 1,890 |
Hartford-West Hartford-East Hartford, CT | 7.9 | 44,320 |
Hattiesburg, MS | 2.5 | 1,420 |
Hickory-Lenoir-Morganton, NC | 2.4 | 3,400 |
Hinesville-Fort Stewart, GA | 4.4 | 740 |
Holland-Grand Haven, MI | 6.9 | 7,300 |
Honolulu, HI | 5.2 | 23,120 |
Hot Springs, AR | 2.3 | 790 |
Houma-Bayou Cane-Thibodaux, LA | 2.4 | 2,330 |
Houston-Sugar Land-Baytown, TX | 8.0 | 221,930 |
Huntington-Ashland, WV-KY-OH | 3.0 | 3,190 |
Huntsville, AL | 16.1 | 33,860 |
Idaho Falls, ID | 4.1 | 2,080 |
Indianapolis-Carmel, IN | 6.8 | 62,120 |
Iowa City, IA | 7.0 | 6,240 |
Ithaca, NY | 4.9 | 2,420 |
Jackson, MI | 6.3 | 3,520 |
Jackson, MS | 3.9 | 9,690 |
Jackson, TN | 2.6 | 1,500 |
Jacksonville, FL | 5.2 | 30,550 |
Jacksonville, NC | 2.4 | 1,050 |
Janesville, WI | 2.8 | 1,720 |
Jefferson City, MO | 6.3 | 4,540 |
Johnson City, TN | 3.8 | 2,920 |
Johnstown, PA | 3.5 | 1,960 |
Jonesboro, AR | 2.0 | 1,000 |
Joplin, MO | 2.8 | 2,160 |
Kalamazoo-Portage, MI | 6.3 | 8,130 |
Kankakee-Bradley, IL | 2.1 | 840 |
Kansas City, MO-KS | 6.9 | 67,640 |
Kennewick-Pasco-Richland, WA | 11.1 | 10,940 |
Killeen-Temple-Fort Hood, TX | 3.6 | 4,660 |
Kingsport-Bristol-Bristol, TN-VA | 4.7 | 5,390 |
Kingston, NY | 2.2 | 1,230 |
Knoxville, TN | 5.7 | 18,550 |
La Crosse, WI-MN | 3.5 | 2,600 |
Lafayette, IN | 6.2 | 5,380 |
Lafayette, LA | 4.9 | 7,610 |
Lake Charles, LA | 3.6 | 3,230 |
Lake Havasu City-Kingman, AZ | 2.6 | 1,150 |
Lakeland-Winter Haven, FL | 3.3 | 6,480 |
Lancaster, PA | 3.6 | 7,940 |
Lansing-East Lansing, MI | 7.6 | 15,000 |
Laredo, TX | 1.8 | 1,670 |
Las Cruces, NM | 6.5 | 4,420 |
Las Vegas-Paradise, NV | 2.7 | 22,560 |
Lawrence, KS | 4.6 | 2,070 |
Lawton, OK | 3.5 | 1,430 |
Lebanon, PA | 2.0 | 990 |
Leominster-Fitchburg-Gardner, MA | 2.7 | 1,240 |
Lewiston, ID-WA | 3.5 | 840 |
Lewiston-Auburn, ME | 2.8 | 1,290 |
Lexington-Fayette, KY | 6.1 | 15,310 |
Lima, OH | 2.7 | 1,300 |
Lincoln, NE | 6.5 | 10,780 |
Little Rock-North Little Rock-Conway, AR | 5.3 | 17,730 |
Logan, UT-ID | 6.0 | 2,970 |
Longview, TX | 2.8 | 2,790 |
Longview, WA | 2.6 | 870 |
Los Angeles-Long Beach-Santa Ana, CA | 6.3 | 339,780 |
Louisville-Jefferson County, KY-IN | 4.4 | 27,020 |
Lubbock, TX | 3.4 | 4,370 |
Lynchburg, VA | 4.8 | 4,660 |
Macon, GA | 3.5 | 3,300 |
Madera-Chowchilla, CA | 2.6 | 990 |
Madison, WI | 10.1 | 34,790 |
Manchester, NH | 6.2 | 6,290 |
Manhattan, KS | 5.8 | 2,890 |
Mankato-North Mankato, MN | 4.3 | 2,050 |
Mansfield, OH | 3.0 | 1,470 |
McAllen-Edinburg-Mission, TX | 1.8 | 4,190 |
Medford, OR | 3.6 | 2,770 |
Memphis, TN-MS-AR | 4.1 | 24,260 |
Merced, CA | 2.2 | 1,320 |
Miami-Fort Lauderdale-Pompano Beach, FL | 3.9 | 89,730 |
Michigan City-La Porte, IN | 2.9 | 1,190 |
Midland, TX | 8.2 | 6,750 |
Milwaukee-Waukesha-West Allis, WI | 6.2 | 50,540 |
Minneapolis-St. Paul-Bloomington, MN-WI | 8.0 | 142,510 |
Missoula, MT | 5.8 | 3,200 |
Mobile, AL | 4.9 | 8,180 |
Modesto, CA | 2.5 | 3,890 |
Monroe, LA | 2.9 | 2,170 |
Monroe, MI | 5.4 | 2,080 |
Montgomery, AL | 5.3 | 8,440 |
Morgantown, WV | 6.4 | 4,030 |
Morristown, TN | 3.0 | 1,300 |
Mount Vernon-Anacortes, WA | 4.2 | 1,800 |
Muncie, IN | 3.8 | 1,680 |
Muskegon-Norton Shores, MI | 3.3 | 1,870 |
Myrtle Beach-North Myrtle Beach-Conway, SC | 1.7 | 1,860 |
Napa, CA | 2.6 | 1,730 |
Naples-Marco Island, FL | 2.1 | 2,510 |
Nashville-Davidson--Murfreesboro--Franklin, TN | 5.3 | 42,180 |
New Bedford, MA | 2.0 | 1,290 |
New Haven, CT | 5.6 | 15,360 |
New Orleans-Metairie-Kenner, LA | 4.3 | 22,490 |
New York-Northern New Jersey-Long Island, NY-NJ-PA | 5.5 | 464,950 |
Niles-Benton Harbor, MI | 4.7 | 2,660 |
North Port-Bradenton-Sarasota, FL | 3.0 | 7,380 |
Norwich-New London, CT-RI | 8.8 | 11,170 |
Ocala, FL | 2.2 | 2,020 |
Ocean City, NJ | 1.1 | 400 |
Odessa, TX | 3.0 | 2,150 |
Ogden-Clearfield, UT | 6.0 | 12,200 |
Oklahoma City, OK | 6.3 | 37,760 |
Olympia, WA | 9.1 | 8,760 |
Omaha-Council Bluffs, NE-IA | 6.2 | 28,380 |
Orlando-Kissimmee-Sanford, FL | 5.0 | 52,240 |
Oshkosh-Neenah, WI | 5.0 | 4,550 |
Owensboro, KY | 2.3 | 1,140 |
Oxnard-Thousand Oaks-Ventura, CA | 7.2 | 21,130 |
Palm Bay-Melbourne-Titusville, FL | 10.9 | 20,760 |
Palm Coast, FL | 2.2 | 420 |
Panama City-Lynn Haven-Panama City Beach, FL | 4.8 | 3,370 |
Parkersburg-Marietta-Vienna, WV-OH | 3.5 | 2,340 |
Pascagoula, MS | 6.3 | 3,370 |
Pensacola-Ferry Pass-Brent, FL | 4.0 | 6,120 |
Peoria, IL | 8.4 | 15,260 |
Philadelphia-Camden-Wilmington, PA-NJ-DE-MD | 6.8 | 182,180 |
Phoenix-Mesa-Glendale, AZ | 7.1 | 126,810 |
Pine Bluff, AR | 4.2 | 1,400 |
Pittsburgh, PA | 6.4 | 72,520 |
Pittsfield, MA | 5.8 | 1,940 |
Pocatello, ID | 5.0 | 1,670 |
Port St. Lucie, FL | 3.0 | 3,700 |
Portland-South Portland-Biddeford, ME | 5.5 | 10,790 |
Portland-Vancouver-Hillsboro, OR-WA | 8.5 | 86,830 |
Portsmouth, NH-ME | 10.5 | 5,950 |
Poughkeepsie-Newburgh-Middletown, NY | 5.0 | 12,260 |
Prescott, AZ | 2.7 | 1,480 |
Providence-Fall River-Warwick, RI-MA | 5.1 | 27,790 |
Provo-Orem, UT | 7.7 | 14,440 |
Pueblo, CO | 3.2 | 1,770 |
Punta Gorda, FL | 2.7 | 1,110 |
Racine, WI | 3.1 | 2,320 |
Raleigh-Cary, NC | 10.3 | 54,910 |
Rapid City, SD | 4.0 | 2,440 |
Reading, PA | 3.7 | 6,180 |
Redding, CA | 4.1 | 2,320 |
Reno-Sparks, NV | 4.5 | 8,650 |
Richmond, VA | 6.5 | 39,390 |
Riverside-San Bernardino-Ontario, CA | 3.2 | 38,210 |
Roanoke, VA | 3.5 | 5,190 |
Rochester, MN | 8.3 | 8,660 |
Rochester, NY | 6.7 | 33,160 |
Rochester-Dover, NH-ME | 7.7 | 4,120 |
Rockford, IL | 3.5 | 5,020 |
Rocky Mount, NC | 3.5 | 1,890 |
Rome, GA | 2.9 | 1,010 |
Sacramento--Arden-Arcade--Roseville, CA | 8.2 | 68,770 |
Saginaw-Saginaw Township North, MI | 5.9 | 4,820 |
Salem, OR | 4.3 | 6,100 |
Salinas, CA | 2.9 | 4,530 |
Salisbury, MD | 3.2 | 1,640 |
Salt Lake City, UT | 7.3 | 47,180 |
San Angelo, TX | 2.4 | 1,110 |
San Antonio-New Braunfels, TX | 5.1 | 44,990 |
San Diego-Carlsbad-San Marcos, CA | 9.5 | 122,600 |
San Francisco-Oakland-Fremont, CA | 10.7 | 218,660 |
San Jose-Sunnyvale-Santa Clara, CA | 20.4 | 189,990 |
San Luis Obispo-Paso Robles, CA | 5.0 | 5,120 |
Sandusky, OH | 2.7 | 960 |
Santa Barbara-Santa Maria-Goleta, CA | 6.5 | 11,300 |
Santa Cruz-Watsonville, CA | 6.1 | 5,250 |
Santa Fe, NM | 4.9 | 2,890 |
Santa Rosa-Petaluma, CA | 4.7 | 8,230 |
Savannah, GA | 3.7 | 5,690 |
Scranton--Wilkes-Barre, PA | 3.1 | 7,840 |
Seattle-Tacoma-Bellevue, WA | 12.3 | 209,880 |
Sebastian-Vero Beach, FL | 2.8 | 1,300 |
Sheboygan, WI | 5.2 | 2,870 |
Sherman-Denison, TX | 3.3 | 1,360 |
Shreveport-Bossier City, LA | 2.8 | 4,780 |
Sioux City, IA-NE-SD | 2.8 | 2,010 |
Sioux Falls, SD | 4.5 | 6,390 |
South Bend-Mishawaka, IN-MI | 3.9 | 4,810 |
Spartanburg, SC | 4.5 | 5,470 |
Spokane, WA | 4.6 | 9,180 |
Springfield, IL | 4.6 | 4,810 |
Springfield, MA-CT | 4.3 | 12,320 |
Springfield, MO | 3.6 | 6,750 |
Springfield, OH | 3.1 | 1,440 |
St. Cloud, MN | 3.4 | 3,320 |
St. George, UT | 2.5 | 1,240 |
St. Joseph, MO-KS | 2.9 | 1,530 |
St. Louis, MO-IL | 6.3 | 81,910 |
State College, PA | 9.3 | 6,080 |
Steubenville-Weirton, OH-WV | 3.4 | 1,340 |
Stockton, CA | 2.5 | 5,050 |
Sumter, SC | 3.3 | 1,100 |
Syracuse, NY | 5.6 | 16,720 |
Tallahassee, FL | 7.0 | 11,010 |
Tampa-St. Petersburg-Clearwater, FL | 5.4 | 62,110 |
Terre Haute, IN | 3.4 | 2,250 |
Texarkana-Texarkana, TX-AR | 1.8 | 980 |
Toledo, OH | 4.3 | 12,910 |
Topeka, KS | 4.7 | 5,070 |
Trenton-Ewing, NJ | 10.2 | 22,060 |
Tucson, AZ | 7.2 | 25,280 |
Tulsa, OK | 5.0 | 21,210 |
Tuscaloosa, AL | 3.8 | 3,490 |
Tyler, TX | 3.6 | 3,370 |
Utica-Rome, NY | 3.7 | 4,550 |
Valdosta, GA | 2.0 | 970 |
Vallejo-Fairfield, CA | 3.9 | 4,800 |
Victoria, TX | 3.6 | 1,840 |
Vineland-Millville-Bridgeton, NJ | 1.5 | 890 |
Virginia Beach-Norfolk-Newport News, VA-NC | 7.2 | 52,380 |
Visalia-Porterville, CA | 2.1 | 2,760 |
Waco, TX | 4.0 | 4,080 |
Warner Robins, GA | 9.3 | 5,280 |
Washington-Arlington-Alexandria, DC-VA-MD-WV | 12.4 | 362,710 |
Waterbury, CT | 2.8 | 1,790 |
Waterloo-Cedar Falls, IA | 3.4 | 3,050 |
Wausau, WI | 5.3 | 3,480 |
Wenatchee-East Wenatchee, WA | 3.9 | 1,530 |
Wheeling, WV-OH | 2.4 | 1,490 |
Wichita Falls, TX | 2.1 | 1,200 |
Wichita, KS | 6.1 | 17,290 |
Williamsport, PA | 3.8 | 2,010 |
Wilmington, NC | 5.0 | 7,000 |
Winchester, VA-WV | 3.0 | 1,610 |
Winston-Salem, NC | 4.0 | 8,160 |
Worcester, MA-CT | 6.6 | 16,150 |
Yakima, WA | 2.4 | 1,920 |
York-Hanover, PA | 4.0 | 6,950 |
Youngstown-Warren-Boardman, OH-PA | 2.7 | 5,910 |
Yuba City, CA | 3.0 | 1,110 |
Yuma, AZ | 4.6 | 2,690 |
| Area | Location quotient | Employment | Annual mean wage |
|---|---|---|---|
Midland, TX | 55.5 | 1,210 | 156,510 |
Casper, WY | 18.6 | 210 | 123,070 |
Houston-Sugar Land-Baytown, TX | 17.2 | 12,520 | 163,490 |
Anchorage, AK | 12.3 | 570 | 166,840 |
Oklahoma City, OK | 10.3 | 1,620 | 158,170 |
Bakersfield-Delano, CA | 8.2 | 620 | 129,680 |
Lafayette, LA | 7.2 | 290 | 126,680 |
Tulsa, OK | 7.2 | 800 | 155,670 |
| Occupation | Percent of occupation's employment in nonmetropolitan areas |
|---|---|
Mine shuttle car operators | 74.3 |
Loading machine operators, underground mining | 73.5 |
Logging equipment operators | 71.3 |
Log graders and scalers | 69.9 |
Fallers | 69.8 |
Roof bolters, mining | 63.3 |
Logging workers, all other | 61.4 |
Continuous mining machine operators | 60.4 |
Mine cutting and channeling machine operators | 59.2 |
Forest and conservation technicians | 56.2 |
All occupations | 13.1 |
| Occupation | Percent of occupation's employment in large metropolitan areas |
|---|---|
Political scientists | 81.9 |
Fashion designers | 79.3 |
Actors | 76.7 |
Flight attendants | 76.6 |
Makeup artists, theatrical and performance | 71.5 |
Agents and business managers of artists, performers, and athletes | 70.4 |
Subway and streetcar operators | 68.8 |
Media and communication workers, all other | 67.7 |
Film and video editors | 67.5 |
Economists | 66.4 |
All occupations | 34.6 |