
An official website of the United States government
An official website of the United States government
The .gov means it's official.
Federal government websites often end in .gov or .mil. Before sharing sensitive information,
make sure you're on a federal government site.
The site is secure.
The
https:// ensures that you are connecting to the official website and that any
information you provide is encrypted and transmitted securely.

More BLS articles and information related to the fish or seafood industry are available online at the following links:
Facts of the catch: occupational injuries, illnesses, and fatalities to fishing workers, 2003–2009, Beyond the Numbers.
Fishers and Related Fishing Workers, Occupational Outlook Handbook, 2014–15.
Shrimp has become a popular purchase for American consumers, with U.S. consumption of shrimp reaching 3.8 pounds per person in 2012.1 Demand for shrimp has increased over the years, and shrimp is currently the largest imported seafood species, accounting for 29 percent of seafood imports by dollar value.2 In 2013, consumers and businesses found themselves paying higher prices with less product available in supermarkets and restaurants. For example, the popular restaurant chain Red Lobster recently saw a 35-percent increase in the price the company paid for shrimp. The price hike contributed to a 3.1-percent increase in the company’s overall food costs and, more recently, an 18-percent decrease in earnings during the quarter that ended in February 2014.3 Similarly, Noodles & Company noted that the cost of shrimp in its pasta dishes would rise 29 percent this year.4
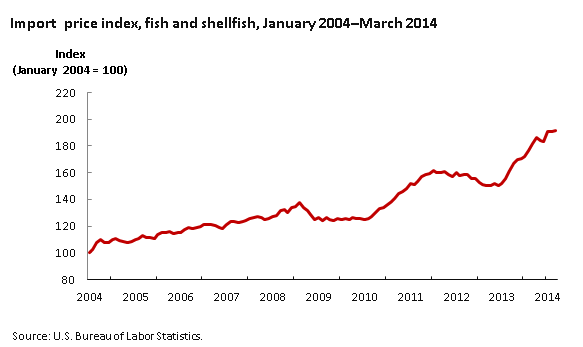
The reason for the higher shrimp prices is a shortage of imports from the top shrimp producers in Southeast Asia. With about 90 percent of shrimp consumed in the United States coming from imports, any change in foreign supply affects both U.S. import prices and overall consumer prices.5 From 2005 to 2009, the import price index for fish and shellfish increased 3.0 percent, on average, on a year-over-year basis. (See chart 1.) During this period, the United States was importing approximately 50 percent of its shrimp from Southeast Asia. In 2010, however, the index jumped 18.1 percent because of the Deepwater Horizon oil spill in the Gulf of Mexico, an event that shut down a significant part of the Gulf’s fishable area, and because of the appearance of diseased shrimp in China and Vietnam, two of the biggest suppliers to the United States. Import prices moderated somewhat in 2012 but still remained high before climbing again, after which they reached a record high year-over-year increase of 25.5 percent in January 2014. Similarly, consumer prices for fish and other seafood rose 6.0 percent from January 2013 to January 2014.
| Date | Import |
|---|---|
January 2004 | 100.0 |
February 2004 | 102.8 |
March 2004 | 107.4 |
April 2004 | 109.9 |
May 2004 | 108.0 |
June 2004 | 107.5 |
July 2004 | 110.0 |
August 2004 | 110.6 |
September 2004 | 109.1 |
October 2004 | 108.7 |
November 2004 | 108.0 |
December 2004 | 108.5 |
January 2005 | 109.6 |
February 2005 | 110.9 |
March 2005 | 112.8 |
April 2005 | 111.8 |
May 2005 | 111.2 |
June 2005 | 111.0 |
July 2005 | 113.6 |
August 2005 | 114.8 |
September 2005 | 114.8 |
October 2005 | 116.2 |
November 2005 | 114.4 |
December 2005 | 115.3 |
January 2006 | 115.0 |
February 2006 | 117.4 |
March 2006 | 119.1 |
April 2006 | 118.0 |
May 2006 | 118.9 |
June 2006 | 119.5 |
July 2006 | 120.8 |
August 2006 | 121.3 |
September 2006 | 121.4 |
October 2006 | 120.4 |
November 2006 | 118.6 |
December 2006 | 118.3 |
January 2007 | 121.3 |
February 2007 | 123.3 |
March 2007 | 123.7 |
April 2007 | 122.9 |
May 2007 | 123.4 |
June 2007 | 124.0 |
July 2007 | 125.6 |
August 2007 | 126.4 |
September 2007 | 126.9 |
October 2007 | 126.2 |
November 2007 | 125.0 |
December 2007 | 125.3 |
January 2008 | 127.5 |
February 2008 | 127.6 |
March 2008 | 131.6 |
April 2008 | 132.2 |
May 2008 | 129.8 |
June 2008 | 134.0 |
July 2008 | 134.3 |
August 2008 | 137.3 |
September 2008 | 134.1 |
October 2008 | 131.9 |
November 2008 | 128.5 |
December 2008 | 125.2 |
January 2009 | 126.1 |
February 2009 | 124.2 |
March 2009 | 126.5 |
April 2009 | 125.2 |
May 2009 | 124.3 |
June 2009 | 125.7 |
July 2009 | 125.1 |
August 2009 | 125.5 |
September 2009 | 124.8 |
October 2009 | 126.2 |
November 2009 | 125.6 |
December 2009 | 125.6 |
January 2010 | 124.8 |
February 2010 | 125.6 |
March 2010 | 127.2 |
April 2010 | 130.3 |
May 2010 | 133.0 |
June 2010 | 134.1 |
July 2010 | 136.2 |
August 2010 | 138.5 |
September 2010 | 140.6 |
October 2010 | 144.1 |
November 2010 | 145.8 |
December 2010 | 148.3 |
January 2011 | 151.6 |
February 2011 | 151.2 |
March 2011 | 153.1 |
April 2011 | 156.9 |
May 2011 | 158.3 |
June 2011 | 159.1 |
July 2011 | 161.9 |
August 2011 | 160.2 |
September 2011 | 160.1 |
October 2011 | 160.8 |
November 2011 | 158.3 |
December 2011 | 157.4 |
January 2012 | 159.9 |
February 2012 | 157.9 |
March 2012 | 158.7 |
April 2012 | 158.8 |
May 2012 | 155.5 |
June 2012 | 155.3 |
July 2012 | 152.3 |
August 2012 | 151.0 |
September 2012 | 150.1 |
October 2012 | 150.4 |
November 2012 | 152.1 |
December 2012 | 150.6 |
January 2013 | 151.8 |
February 2013 | 155.3 |
March 2013 | 161.2 |
April 2013 | 166.5 |
May 2013 | 170.0 |
June 2013 | 170.8 |
July 2013 | 172.4 |
August 2013 | 176.4 |
September 2013 | 181.9 |
October 2013 | 186.1 |
November 2013 | 184.2 |
December 2013 | 183.3 |
January 2014 | 190.5 |
February 2014 | 191.0 |
March 2014 | 191.3 |
A large contributor to the seafood price increases was a disease-related decline in supplies from the top three shrimp-producing countries: Thailand, Vietnam, and China. Chart 2 depicts the volume of U.S. shrimp imports from those countries. Compared with 2012 data, total shrimp imports from Thailand to the United States were down 38.2 percent, and total imports from China were down 8.9 percent, in 2013. After declines in 2011 and 2012, there was a 45.2-percent increase in import volumes from Vietnam in 2013. According to data from the U.S. Department of Commerce, total U.S. shrimp imports by volume decreased 4.8 percent from 2012 to 2013. In contrast, according to the U.S. Department of Agriculture, the total dollar value of U.S. shrimp imports increased 18.9 percent during the same period.

| Year | Thailand | Vietnam | China |
|---|---|---|---|
2008 | 404,373 | 106,487 | 106,179 |
2009 | 424,979 | 93,046 | 97,134 |
2010 | 448,178 | 106,622 | 106,031 |
2011 | 409,581 | 100,144 | 94,738 |
2012 | 300,006 | 90,725 | 78,576 |
2013 | 185,515 | 131,745 | 71,570 |
The nature of shrimp farming makes the shrimp highly susceptible to disease. Eighty percent of world shrimp production takes place on small-scale, open-air systems in which water flows in and out between ponds. One of the leading factors behind the higher import prices is the early mortality syndrome (EMS) epidemic that has affected supplies in Southeast Asia. Specifically, a bacterial disease known as acute hepatopancreatic necrosis syndrome (AHPNS) causes EMS. AHPNS kills juvenile shrimp by destroying their hepatopancreas, an organ crucial to the animal’s digestion. The disease spreads quickly as shrimp eat and infect other shrimp, and it can wipe out a pond’s entire shrimp population within a matter of months. In addition, the syndrome’s onset takes place before the shrimp are mature enough to reproduce. First appearing in China in 2009, AHPNS spread to Vietnam in 2010, Malaysia in 2011, and Thailand, the world’s largest shrimp exporter, in 2012. AHPNS has affected shrimp supplies, particularly Pacific white shrimp and black tiger shrimp, in the latter three countries.
Although it is unclear how EMS emerged, a U.S. researcher has identified the pathogen responsible for the disease: a unique strain of the vibrio parahaemolyticus bacterium. Donald Lightner and his team at the University of Arizona are continuing to research the disease and are trying to determine how the bacterium spreads from pond to pond.6 With the problem now identified, the shrimp industry is hopeful that production will start to increase. In the meantime, other countries, such as India, have increased their production to help ease some of the pressure. According to the U.S. Department of Agriculture, U.S. shrimp imports from India increased 42.8 percent in 2013.7
There have been signs of decreasing market pressures in the past few months, as scientists have determined the cause of the disease and imports have increased. As long as scientists can prevent the spread of EMS, an increase in supply from India and other countries can help ease supply pressures. Analysts do not expect demand to ease much, however, because there is no real substitute for shrimp in terms of consumer preference. There are wild-caught shrimp and farmed shrimp from other countries, but these shrimp are not available on any kind of scale necessary to replace what has been lost. Therefore, the anticipation is that, although the supply of shrimp might stabilize, demand for this popular seafood may not encourage either import prices or consumer prices to fall back to pre-AHPNS levels anytime soon.8
During the first quarter of 2014, import prices increased 1.9 percent, after declining 1.4 percent during the final quarter of 2013. A 7.6-percent rise in prices for fuels and lubricants drove the first-quarter advance. Prices for nonfuel imports also contributed to the increase in import prices: the price index for nonfuel imports rose 0.5 percent for the 3 months ended in March.
Fuel imports. The first-quarter advance in prices for imported fuels and lubricants followed a 6.6-percent decline during the final quarter of 2013. The increase was the largest quarterly advance since the index rose 8.0 percent during the third quarter of 2012. A 5.3-percent rise in February led the quarterly increase; the index also rose in January and March, up 1.0 percent and 1.2 percent, respectively.
Petroleum prices increased 5.2 percent in the first quarter, led by a 4.7-percent advance in February. A combination of shrinking petroleum-product stockpiles and higher demand in the United States, the top oil-consuming nation, drove the advance. Colder-than-normal temperatures in recent months have resulted in an increase in demand for heating oil.9 Signs of higher employment and, in general, an economic recovery in the United States boosted demand for petroleum products as more people commuted to jobs.10 Crude-oil stockpiles decreased by 2.4 million barrels, to a level of 380.1 million barrels, in the week ended March 28, according to the U.S. Energy Information Administration.11
Higher natural gas prices also contributed to the advance in fuel prices, increasing 75.7 percent over the first quarter of 2014. The first-quarter rise was the largest quarterly increase since the index began publication in September 1981. Depleted gas inventories, due to strong demand from the severe winter chill, pushed prices higher.12
Nonfuel imports. Import prices excluding fuel also rose during the first quarter of 2014, advancing 0.5 percent after recording no change during the final quarter of 2013. The increase was the largest quarterly rise since a 0.6-percent advance during the first quarter of 2012. Chart 3 shows that an increase in prices for foods, feeds, and beverages and a rise in consumer goods prices were the largest contributors to the overall advance in nonfuel prices. Prices for nonfuel industrial supplies and materials had a smaller contribution to the advance, while prices for capital goods and prices for automotive vehicles decreased for the quarter.

| Category | Percent-change contribution |
|---|---|
Food, feeds, and beverages | 0.23 |
Industrial supplies and materials, excluding fuel | 0.13 |
Capital goods | -0.02 |
Automotive vehicles | -0.03 |
Consumer goods, excluding automotives | 0.22 |
Prices for foods, feeds, and beverages rose 3.6 percent, the largest quarterly increase since the index advanced 7.5 percent for the 3 months ended in March 2011. Rising prices for fruit and fruit preparations (up 11.7 percent) and for coffee (up 16.3 percent) drove the increase in the index. A drought in California, the state with the highest fruit production, and a crop disease among Florida oranges have pushed fruit prices higher.13 In Brazil, the country’s hot and dry summer has resulted in difficult growing conditions for coffee. Brazil accounts for about one-third of the world’s annual coffee output, as well as half of the world’s orange juice supply, according to the U.S. Department of Agriculture.14
Nonfuel industrial supplies and materials prices increased 0.8 percent in the first quarter of 2014, after declining 0.4 percent in the fourth quarter of 2013. A 0.6-percent rise in March drove the quarterly increase, with higher prices for gold as the main contributor. Despite decelerating Chinese demand for gold, both political unrest in Ukraine and the Federal Reserve’s commitment to low interest rates in the long term have propelled gold prices higher.15
Prices for the major finished goods areas were mostly down during the quarter. The price index for capital goods edged down 0.1 percent, while prices for automotive vehicles decreased 0.2 percent. In contrast, consumer goods prices increased 0.8 percent during the first quarter of 2014.
U.S. export prices advanced 1.8 percent during the first quarter of 2014, after edging down 0.1 percent during the fourth quarter of 2013. Prices for nonagricultural commodities increased 1.6 percent for the 3 months ended in March, after recording no change the previous quarter. Agricultural exports prices rose 4.0 percent between December and March, after falling 1.2 percent during the final quarter of 2013.
Agricultural exports. The price index for agricultural exports increased 4.0 percent during the first quarter of 2014. A 2.7-percent advance in March and an increase of 1.4 percent in February led the way. Rising prices for soybeans, wheat, meat, corn, and dairy products and eggs were responsible for the increases. Robust demand from China for soybeans as feedstock has resulted in the smallest amount of soybean stockpiles in 10 years: 135 million bushels before this autumn’s harvest, as reported by the U.S. Department of Agriculture (USDA).16 The tensions in Ukraine have caused higher prices for wheat and corn, as Ukrainian farmers face difficulty getting credit to buy items such as seed and fertilizer.17 According to USDA projections, Ukraine will be the fifth-largest exporter of wheat and third-largest shipper of corn in the current (2013–2014) marketing year.18 Weather also was a contributing factor to the rise in grain prices. Dry weather in the southern U.S. Plains, along with a cold front sweeping through the Plains and Midwest have sparked concerns over grain supplies.19
Nonagricultural exports. Nonagricultural export prices rose 1.6 percent between December and March, the largest quarterly increase since the index advanced 1.7 percent during the second quarter of 2011. As seen in chart 4, most of the increase resulted from higher prices for nonagricultural industrial supplies and materials; these prices were up 3.8 percent for the quarter. As chart 4 shows, for this category of exports. A 2.0-percent rise in nonmonetary gold prices, a 5.2-percent advance in prices for other petroleum products, and a 0.8-percent increase in fuel oil prices were the largest contributors to the overall jump in prices for nonagricultural industrial supplies and materials.

| Category | Percent change |
|---|---|
Nonagricultural industrial supplies and materials | 1.34 |
Capital goods | -0.03 |
Automotive Vehicles | 0.00 |
Consumer goods, excluding automotives | 0.28 |
Price movements for finished-goods categories were mixed this quarter. Capital goods prices rose 0.7 percent for the 3 months ended in March while prices for consumer goods declined 0.3 percent for the same period. The price index for automotive vehicles remained unchanged for the quarter.
This Beyond the Numbers summary was prepared by Kristen Reed and Sharon Royales, economists in the Office of Prices and Living Conditions, U.S. Bureau of Labor Statistics. Email: MXPinfo@bls.gov. Telephone: 202-691-7101.
Information in this article will be made available upon request to individuals with sensory impairments. Voice phone: (202) 691-5200. Federal Relay Service: 1-800-877-8339. This article is in the public domain and may be reproduced without permission
Kristen Reed and Sharon Royales, “Shrimp disease in Asia resulting in high U.S. import prices ,” Beyond the Numbers: Global Economy, vol. 3 / no. 14 (U.S. Bureau of Labor Statistics, June 2014), https://www.bls.gov/opub/btn/volume-3/shrimp-disease-in-asia-resulting-in-high-us-import-prices.htm
Publish Date: Tuesday, June 24, 2014