
An official website of the United States government
An official website of the United States government
The .gov means it's official.
Federal government websites often end in .gov or .mil. Before sharing sensitive information,
make sure you're on a federal government site.
The site is secure.
The
https:// ensures that you are connecting to the official website and that any
information you provide is encrypted and transmitted securely.
More BLS articles and information related to occupational employment and wages are available online at the following links:
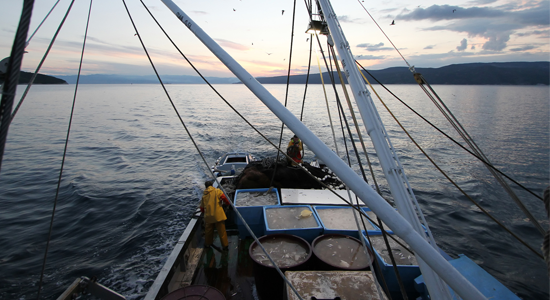
Fishers and related fishing workers1 deal with a set of working conditions unique among all other occupations. This occupation is characterized by strenuous work, long hours, seasonal employment, and some of the most hazardous conditions in the workforce.2 These workers are often at sea for weeks or months at a time, sometimes having to stand on deck, fishing for long periods with little or no sleep. They are constantly being tossed around by wind and rough seas, with water in their face and under their feet, which adds an element of balance to the skills needed to do their job safely. Weather does not stop production, and given that these workers do not work in a factory or office building, it increases the unpredictability of their working conditions. Access to on-site medical care for these workers is limited to the knowledge of those on the boat with them or the response of the Coast Guard.
Thanks to television shows such as Deadliest Catch, Lobstermen, Swords, Rajin Cajuns, Hook Line and Sisters, Wicked Tuna, Big Shrimpin’, and Toughest Tribes,3 viewers can see the hazards these workers face first hand. But what do the numbers show? Fishers and related fishing workers have had the highest fatal injury rate of any occupation since 2005. Their rate of fatal injury in 2009 was 203.6 per 100,000 full-time equivalent workers, more than 50 times the all-worker rate of 3.5. From 2003 to 2009, an average of 48 fishers and related fishing workers died each year as a result of an injury incurred on the job.
There were approximately 31,000 people employed as fishers and related fishing workers in 2009.4 This issue of Beyond the Numbers looks at data from the Bureau of Labor Statistics (BLS) Injuries, Illnesses, and Fatalities program on fishers and related fishing workers for the period from 2003 to 2009.Although this report focuses primarily on fatal injuries among workers in this occupation, for context, it begins with some information on the nonfatal injuries and illnesses experienced by these workers. This is followed by a detailed description of what the data from the Census of Fatal Occupational Injuries (CFOI) show about fatal injuries to fishers and related fishing workers during the 2003–2009 period. The final section gives an overview of the fatal injuries that occurred among a subset of the fishers and related fishing workers in the private shellfish fishing industry, including crab fishing, lobster fishing, and shrimp fishing, in order to provide more insight into the special hazards these workers endure.
Data on nonfatal injuries and illnesses come from the BLS Survey of Occupational Injuries and Illnesses (SOII) and are limited to the private sector industries only; fatalities data are for both the public and the private sector, so the data are not directly comparable.5 In addition, the nonfatal injuries and illness data do not include the self-employed, whereas the fatal injury data do. This is an important distinction because more than 50 percent of all fishers are self-employed.6 Also, as the name of the survey suggests, nonfatal data include illnesses. Fatalities data exclude illness-related deaths unless precipitated by an injury event. For example, a fatal heart attack, such as the one incurred by Captain Phil Harris on Deadliest Catch, would not be included in the count of fatal work injuries.7
There were 610 nonfatal injuries and illnesses to fishers and related fishing workers requiring days away from work over the 2003–2009 period. Contact with objects or equipment (33 percent) and overexertion (16 percent) were the two leading events in these nonfatal cases. Containers were the source in almost one-fifth of the 610 cases. Accounting for a third of the total injuries and illnesses to fishers and related fishing workers were sprains and strains. Not surprisingly, almost 40 percent of the cases involved the trunk as the body part affected. The rate of nonfatal occupational injuries or illness involving days away from work for fishers and related fishing workers was 72.6 per 10,000 full-time workers in 2009, compared with a rate of 106.4 for private industry overall.
There were 334 fatal occupational injuries to fishers and related fishing workers over the 2003–2009 period. The five states with the most fatalities during this period are also ones that are traditionally associated with fishing activities: Alaska (70), Massachusetts (39), Florida (29), Louisiana (25), and Oregon (25). In Alaska, this occupational group accounted for more than 30 percent of all the fatal workplace injuries that occurred from 2003 to 2009.
Given the relatively small number of workers in this occupation, the rate tends to be more volatile than for other occupations. Nonetheless, rates in recent years have consistently been well above those of all workers. In 2009, the rate of fatal injury for fishers and related fishing workers was 203.6 per 100,000 full-time equivalent workers, which is more than 50 times the all-worker rate of 3.5 per 100,000. The fatality rate in 2009 was the highest recorded for fishers and related fishing workers since the change in rate methodology in 2006.8 The lowest rate for fishers and related fishing workers since the methodology change was recorded in 2007, with a rate of 109.5 per 100,000 workers, which was still almost 30 times the all-worker rate of 4.0 per 100,000.
Not surprisingly, white workers and men accounted for most of the fatalities in this occupation, which is consistent with the profile of all workers. Similar to all workers, the 35- to 44-year-old age group incurred the highest proportion of fatal injuries among fishers and related fishing workers (27 percent). Foreign-born workers made up 15 percent of the fatal injuries in this occupation, with those from Mexico and Vietnam each making up about one-fifth of this total.
Of the 334 fishers and related fishing workers who were killed on the job from 2003 to 2009, 40 percent were self-employed, while the rest were wage and salary workers. Sometimes fishers work on their own boats, but more often they are part of a company that has a crew and most likely more than one person per boat.
About 80 percent of fatal injuries to fishers and fishing workers resulted from water vehicle transportation incidents (270 fatalities).9 Of these fatal injuries, sinking and/or capsized water vehicle accounted for 53 percent, falls from ship or boat, not elsewhere classified, not elsewhere classified, accounted for 36 percent, and collisions accounted for 4 percent.10 Weather and atmospheric conditions was listed as a contributing factor for 17 percent of the fatal injuries over the 2003–2009 period.11 Eighty-four percent of the fatalities to fishers and related fishing workers were due to drowning, which is not surprising given the nature of the occupation and that the location for 96 percent of the fatalities was either at sea or on a river.
Fishing is very seasonal: not all fish or shellfish (crabs, shrimp, etc.) are available at all times of the year. This may lead people to believe that warmer months take the largest toll on fishers, but fishers are always fishing, they just fish for different things at different times of the year. When one season is over, another begins. Thus, the distribution of fatalities over months is fairly even. The same holds for the time of day and day of week, since fishers fish at all hours of the day and whenever the nets or pots are ready to be picked up. (See tables 1, 2, and 3 for incidents by time of day and day of week.)
| Month of Incident | Percentage of total |
|---|---|
| January | 11 |
| February | 7 |
| March | 7 |
| April | 7 |
| May | 9 |
| June | 6 |
| July | 8 |
| August | 4 |
| September | 10 |
| October | 13 |
| November | 6 |
| December | 10 |
| NOTE: Data for all years are revised and final. | |
| Time of incident | Percentage of total |
|---|---|
| 12:00 midnight - 3:59 a.m. | 16 |
| 4:00 a.m. - 7:59 a.m. | 17 |
| 8:00 a.m. - 11:59 a.m. | 21 |
| 12:00 noon - 3:59 p.m. | 18 |
| 4:00 p.m. - 7:59 p.m. | 18 |
| 8:00 p.m. - 11:59 p.m. | 12 |
| There were 83 fatalities for which time of incident was unknown. | |
| NOTE: Data for all years are revised and final. | |
| Day of incident | Percentage of total |
|---|---|
| Sunday | 11 |
| Monday | 16 |
| Tuesday | 21 |
| Wednesday | 16 |
| Thursday | 12 |
| Friday | 11 |
| Saturday | 13 |
| NOTE: Data for all years are revised and final. | |
The size of the boat is often a factor in incidents involving fatal occupational injuries. In boating accidents in general, data compiled by the U.S. Coast Guard show that the size of the boat is a contributing factor, with incidents occurring in smaller boats more frequently.12 The size of the boat that was involved in the fatal injuries was identified in 131 of the 334 cases during the 2003–2009 period. Seventeen of the boats were less than 20 feet long, 37 were between 20 and 39 feet long, 37 were between 40 and 59 feet long, 20 were between 60 and 79 feet long, 14 were between 80 and 99 feet long, and 6 were over 100 feet long. Almost all of the incidents that involved fishing vessels less than 20 feet long were due to sinking or capsizing. The majority of the decedents of the vessels that were over 100 feet long fell from the ship or boat.
Thirty-six percent (97 fatalities) of water transportation fatalities were due to the worker falling overboard. Information on what the decedent was doing at the time of death can sometimes be found in the case narrative. In reviewing the case narratives for the 97 fatal injuries in which the event was fall from ship or boat, not elsewhere classified, 33 of these narratives included more specific information on what the fishermen were doing at the time of the incident. Five of them were working on repairing equipment or the boat. Getting entangled in the nets or gear and as a result getting dragged overboard or drowning accounted for 13 of the fatalities, 6 involved checking, repairing, or retrieving the nets, and 5 occurred while setting or hauling gear.
During the 2003–2009 period, a total of 121 fatally injured fishers and related fishing workers were killed in an incident in which at least one other worker died, which accounts for 36 percent of the cases. These 121 workers were fatally injured in 45 different incidents, 8 of which had 4 or more workers killed in the same incident. Of these 121 fatally injured workers, 96 (79 percent) died on a sinking or capsizing water vehicle, 8 (7 percent) died during a fall from the ship or boat, not elsewhere classified, and 6 (5 percent) died from a water vehicle collision.
Fishers and fishing workers come from many different industries. Of the 334 fishers who were killed on the job between 2003 and 2009, 45 percent (150 workers) were in the shellfish fishing industry, 23 percent (77 workers) were in the finfish fishing industry, and 3 percent (11 workers) were in other marine fishing. The fishers depicted in the show Swords would be classified under the other marine fishing category, since swordfish are billfish. Workers who are primarily engaged in fishing for tuna, salmon and trout would be in the finfish industry, including the salmon fishers of Hook Line and Sisters and the tuna fishers of Wicked Tuna. Captain and crew on the Deadliest Catch, Lobstermen, Big Shrimpin’, and Rajin Cajuns would be classified in the shellfish fishing industry, which is getting the most exposure on television and accounts for almost half of the fishers and fishing workers killed on the job in the past 7 years.
As noted previously, there were 150 fatal occupational injuries to fishers and related fishing workers in the private shellfish fishing industry during the period from 2003 to 2009. The circumstances and characteristics of fatal injuries in this industry are much the same as fishers overall. One difference is that fall from ship or boat, not elsewhere classified, and sinking, capsized water vehicle, each make up about one third of the fatal incidents in this industry, whereas for all fishers falls from the ship or boat accounted for 29 percent of the fatalities, and sinking in a capsized water vehicle accounted for 43 percent.
The title “crab fisherman” is not an official occupational code in the Standard Occupational Classification (SOC) system, nor is “crab fishing” an industry in the North American Industrial Classification System (NAICS). Rather, crab fishermen are included within fishers and related fishing workers and crab fishing is included in the shellfish fishing industry.13
The four States with the most crab fishermen fatalities were Alaska (10), Oregon (8), California (6), and Washington (6). Fourteen of the 37 fatalities (38 percent) to crab fishermen were from a fall from ship or boat, not elsewhere classified, and 20 (54 percent) were from a sinking or capsized water vehicle.
Case narratives provide a little more information, but often the details are not consistent enough or thorough enough to allow for any real analysis. For cases that did have information on the circumstances surrounding the fatality, 20 of the 37 cases involving crab fishermen mentioned rough seas, swells, or rough waves, with 12 of these citing at least 20 foot swells and waves. Even less reliable are accounts of what the deceased was doing at the time of death, which is mostly because all crew members may have perished during the incident. However, in 8 of the 37 cases, activities to do with the crab pots were specifically mentioned, either a fall off the stacked pots, or becoming entangled with and/or thrown overboard with the crab pots.
Of the 37 crab fishermen fatalities, 26 had information about the decedent being found or presumed dead. Thirteen of these 26 were never found and presumed dead (50 percent), while the others were found the day of the incident or sometimes weeks later. Thirteen of the 37 fatalities had information on the decedents survival suit or life jacket status. Only 6 of the 13 had their survival suits on, were trying to put them on, or were wearing them improperly at the time of the fatal incident, the others, where information was present, were not wearing their suits.
As with crab fishermen, the title “lobster fisherman” is not an official occupational code in the SOC system, nor is “lobster fishing” an industry classified in the NAICS. Rather, lobster fishermen are included within fishers and related fishing workers and lobster fishing is included in the shellfish fishing industry.14 There were 17 fatal injuries to lobstermen from 2003 to 2009, about half of which were due to a fall from ship or boat, not elsewhere classified.
“Shrimp fisherman” is not an official occupational title in the SOC system, nor is “shrimp fishing” an industry in the NAICS. Rather, shrimp fishermen are included within fishers and related fishing workers and shrimp fishing is included in the shellfish fishing industry.15 There were 36 fatal injuries to shrimp fishermen from 2003 to 2009. Not surprisingly, 69 percent of the fatalities were due to water transportation incidents, almost three quarters of which were the result of a fall from ship or boat, not elsewhere classified, and 16 percent from a sinking or capsized water vehicle. Seventeen percent of the 36 fatalities to shrimp fishers were due to exposure to harmful substances or environments such as contact with electric current, inhalation of substances, or drowning. Contact with objects or equipment accounted for another 14 percent of the fatalities.
Overall, fishers and related fishing workers face a unique set of challenges in the workplace. The occupation is also considered a higher risk occupation because of the high fatality rate relative to the rate for all workers. Reality television series continue to document the everyday lives of fishermen and show the public the conditions and dangers faced by these workers. This Beyond the Numbers report helps to quantify in a more concrete manner the causes of their occupational injuries and fatalities. Understanding the circumstances that lead to workplace injuries and fatalities among fishers and related fishing workers can help create a safer environment in which to work.
This BEYOND THE NUMBERS article was prepared by Jill Janocha, an economist in the Office of Compensation and Working Conditions, Census of Fatal Occupational Injuries program. Telephone: 202-691-6217
Email: Janocha.Jill@bls.gov
Information in this summary will be made available to sensory-impaired individuals upon request. Voice phone: (202) 691-5200. Federal Relay Service: 1-800-877-8339. This summary is in the public domain and may be reproduced, with appropriate citation, without permission.
Jill Janocha, “Facts of the catch: occupational injuries, illnesses, and fatalities to fishing workers, 2003–2009 ,” Beyond the Numbers: Workplace Injuries, vol. 1 / no. 9 (U.S. Bureau of Labor Statistics, August 2012), https://www.bls.gov/opub/btn/volume-1/facts-of-the-catch-occupational-injuries-illnesses-and-fatalities-to-fishing-workers-2003-2009.htm
1 Fishers and related fishing workers are defined under the Standard Occupational Classification (SOC) system code 45-3011 as workers who use nets, fishing rods, traps, or other equipment to catch and gather fish or other aquatic animals from rivers, lakes, or oceans, for human consumption or other uses. They may also haul game onto boats or ships.
2 For more information, see “Fishers and Related Fishing Occupations,” Occupational Outlook Handbook, 2012–2013 edition (U.S. Bureau of Labor Statistics, 2012), https://www.bls.gov/ooh/farming-fishing-and-forestry/fishers-and-related-fishing-workers.htm.
3 All shows are Discovery Channel Series, except Hook Line and Sisters, which is on the TLC network, Wicked Tuna, which is on the National Geographic Channel, and Big Shrimpin’, which is on the History Channel .
4 Information on the demographics of fishers and related fishing workers are not available from the Current Population Survey because the base is less than 50,000 workers and the data do not meet publication standards at that level of detail. For 2009 employment figures for fishers and related fishing workers, see table 11, “Employed persons by detailed occupation, sex, race, and Hispanic or Latino ethnicity,” Current Population Survey, 2009 annual averages, ftp://ftp.bls.gov/pub/special.requests/lf/aa2009/pdf/cpsaat11.pdf.
5 Beginning in 2008, the BLS Survey of Occupational Injuries and Illnesses expanded collection of nonfatal data to include state and local government workers nationwide beginning in 2008.
6 See “Fishers and Related Fishing Occupations,” Occupational Outlook Handbook, https://www.bls.gov/ooh/farming-fishing-and-forestry/fishers-and-related-fishing-workers.htm.
7 For information on this specific incident, see http://dsc.discovery.com/fansites/deadliestcatch/phil-harris/
8 For more information on the changes in methodology, see https://www.bls.gov/opub/hom/soii/home.htm and https://www.bls.gov/opub/hom/cfoi/home.htm; see also, Joyce Northwood, “Change to Hours-Based Fatality Rates in the Census of Fatal Occupational Injuries,” Compensation and Working Conditions Online, January 2010.
9 This is not surprising given the order or precedence with which the event is selected. For more information on the rules of selection, see section 2.4, “Event or Exposure,” in Occupational Injury and Illness Classification Manual (U.S. Bureau of Labor Statistics, September 2007).
10 Because of the rules of selection for source based on event, it is also not surprising that 82 percent of the fatalities have a source of water vehicle, which includes motorboats, ships, tugboats, and commercial fishing boats. For more information, see Occupational Injury and Illness Classification Manual.
11 This is determined by the secondary source code. For more information, see Occupational Injury and Illness Classification Manual.
12 U.S. Coast Guard data cited on the American Boating Association website, “ABA Boating Safety Program,” http://www.americanboating.org/safety.asp.
13 In order to obtain information on crab fishermen only, the author reviewed all of the narratives that describe the fatal injury, as well as the industry and the occupation narratives, which sometimes contain information on occupations other than just fishers. Using this method, of the 150 fishers that incurred fatal injuries in the shellfish industry during the 2003–2009 period, 37 could be positively identified as crab fishermen and 16 are still unidentified; the others were identified as other types of fishers such as shrimp and lobster fishers.
14 In order to obtain information on lobster fishermen only, the author reviewed all of the narratives that describe the fatal injury, as well as the industry and the occupation narratives, which sometimes contain more information than just fisher. Using this method, of the 150 fishers that incurred fatal injuries in the shellfish industry during the 2003–2009 period, 17 could be positively identified as lobster fishermen, while the others were unknown or identified as other types of fishers such as crab and shrimp fishers.
15 In order to obtain information on shrimp fishermen only, the author reviewed all of the narratives that describe the fatal injury, as well as the industry and the occupation narratives, which sometimes contain more information than just fisher. Using this method, of the 150 fishers that incurred fatal injuries in the shellfish industry during the 2003–2009 period, 36 could be positively identified as shrimp fishermen, while the others were unidentified or identified as other types of fishers such as crab and lobster fishers.
Publish Date: Friday, August 17, 2012