
An official website of the United States government
An official website of the United States government
The .gov means it's official.
Federal government websites often end in .gov or .mil. Before sharing sensitive information,
make sure you're on a federal government site.
The site is secure.
The
https:// ensures that you are connecting to the official website and that any
information you provide is encrypted and transmitted securely.
Data are collected using a variety of source documents and entered manually by state partners once a fatal occupational injury has been identified. As more information is gathered, the data are revised until the case has been fully coded. See the data source section for more information on Census of Fatal Occupational Injuries (CFOI) source documents.
The CFOI system uses a matching scheme to keep duplicate entries for the same fatal injury from being entered. After data entry—but before tabulation—a final manual check and final computer-assisted check ensure there are no duplicates. The CFOI uses multiple source documents, rather than relying on a single data collection tool, to ensure a complete annual count of fatal work injuries.
To ensure an accurate count of fatal occupational injuries, the CFOI requires that, for each case, the work relationship (that is, whether a fatality is work-related) be substantiated by two or more independent source documents or a source document and a follow-up questionnaire. Follow-up questionnaires are sent either to the employer or to another contact with knowledge of the incident. The follow-up questionnaire is also used to collect information that may be missing from the source documents. At the end of the collection period, fatal injuries for which the state has only one source document are reviewed by the Bureau of Labor Statistics (BLS). The case is included in the national database only if the state and BLS agree that there is sufficient information on the sole source document to determine that it is work-related.
CFOI uses a combination of system edits and manual review to validate CFOI case codes. Within the CFOI system, there are edits that might indicate missing information or a mismatch in codes according to various coding rules and structures. (See the concepts section for more information.)
The CFOI program conducts periodic reviews of both the case coding and source documents to ensure information transcribed and coded is correct. Coding review for each case is conducted by BLS offices to ensure consistency and accuracy throughout the nation. During the review, cases with unusual circumstances may be further vetted to ensure those cases meet the scope criteria for the CFOI—according to the definitions found on the CFOI definitions page.
Once data validation checks have been completed, data are compiled by aggregating cross tabulated variables and applying publishability rules to protect the confidentiality of decedents. For a more complete listing of how the data are presented, see the presentation section.
Fatal injury rates estimate the risk of incurring a fatal occupational injury faced by all workers or a subgroup of workers and are used to compare risk over time and with other worker groups. Workers can be grouped for comparison by a number of variables, including industry, worker’s age, or gender. Because employment data are not collected by the CFOI, fatal injury rates are calculated using estimates of hours worked from the Current Population Survey (CPS).1
In 2008, the CFOI adopted hours-based employment as the denominator of fatal injury rates to measure fatal injury risk (rates were calculated retroactively using this new method for 2006 and 2007 data). This methodology is generally considered to be more accurate than employment-based rates per the standardized length of exposure to risk of occupational injury. Hours-based fatal injury rates should not be directly compared to employment-based rates because of the differences in the numerators and denominators used. More information on the change from employment to hours-based fatal injury rates is available at https://www.bls.gov/iif/additional-resources/cfoi-hours-based-rates.htm. The article “Change to Hours-Based Fatality Rates in the Census of Fatal Occupational Injuries” details the impact of the methodology change.
To accurately describe fatal injury risk for a worker group, the numerator (fatal injuries) and denominator (total hours worked) of the rate must refer to the same group of workers. The hours-worked data from the CPS used in the rate calculations do not include workers under the age of 16, volunteers, and members of the resident military. Therefore, fatal injuries occurring to these workers are also excluded from the numerator. Industry data for national rates are broken out by ownership: private, overall government, federal government, state government, and local government.
National fatal injury rates use data from the CPS. Compared with the employment number, data on people at work exclude those who were temporarily absent from a job (classified in the zero-hours-worked category, with a job but not at work). Those not at work were absent from their jobs for the entire week for such reasons as bad weather, vacation, illness, or involvement in a labor dispute. The denominator, annual hours worked (EH), is calculated as the total hours worked by all workers in the group during an average reference week, multiplied by 50 weeks.
The hours-based rate (expressed per 100,000 full-time equivalent workers) is:
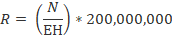
where:
R = hours-based rate of fatal injuries for a group,
N = number of fatal injuries in a group,
EH = total hours worked by all employees in a group during the calendar year, and
200,000,000 = base number of hours for 100,000 equivalent full-time workers (working 40 hours per week, 50 weeks per year).
State rates by industry can be imputed by using national-level total hours at work during an average reference week data to calculate the total annual number of hours for each industry group across ownership. State rates are not available by demographic characteristics, occupational groups, or for public and private sectors separately.
The rate represents the number of fatal occupational injuries per 100,000 full-time equivalent workers and is calculated as:
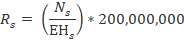
where:
Rs = hours-based rate of fatal injuries for a state,
NS = number of fatal work injuries in the state,
EHS = total hours worked by all employees in the state during the calendar year, and
200,000,000 = base number of hours for 100,000 equivalent full-time workers (working 40 hours per week, 50 weeks per year).
State rates are imputed by using national-level total hours worked by industry information from CPS. These hours are divided by the number of employed persons by industry, also from CPS, to obtain an average number of hours worked per employee in that industry. This average is then multiplied by the annual average of employed people by industry in each state from Local Area Unemployment Statistics (LAUS) data. This apportionment is also expressed per 100,000 full-time equivalent employees.
Because the number of fatal injuries comes from a census, we assume there is no variance associated with the annual count of fatalities. However, when a rate is calculated, the hours-worked value is an estimate that comes from sample data so it does have variance. Therefore, the CFOI count does not have a variance, but the rate does.
The variance of the CFOI rate, R, is calculated as follows:
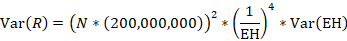
where:
Var(R) = variance of the CFOI rate,
N = number of fatal work injuries,
EH = total hours worked by all employees in a group during the calendar year, and
Var(EH) = variance of the hours-worked number produced by CPS.
CFOI fatal injury rates published by BLS for the years 1992 through 2007 were employment-based rates and measured the risk of fatal injury for those employed during a given period, regardless of hours worked. The formula for calculating a fatality rate from 1992 through 2007 is to divide the number of fatally injured workers, 16 years and older, by the number of employed workers, 16 years and older, multiplied by 100,000.
CFOI uses the Local Area Unemployment Statistics (LAUS) data to calculate state rates.
State industry rates are not directly comparable with national industry rates. Because of the difference in the way LAUS and national CPS calculate their employment data—state rates include government workers in their respective industry sector and are not broken out separately—both the numerator and denominator include a different group of workers than that of the national rates.
If users decide to add up all the states in one industry and average out their rates to compare it with the national average, they will not get the national average as a result of this data difference, with the all-ownership/state rates most likely being slightly higher because of the added fatal injuries and different employment data.
Comparisons of state fatal injury rates across states should be made with caution as differences in rates can be due to many factors. Large differences in the industry composition of employment by state, for example, may affect the overall state fatal injury rate. Comparing rates for a state with a large agricultural economy with that of a state with a large industrial economy should be done with caution as agriculture has one of the highest fatal injury rates while manufacturing generally has a lower rate. In addition, the number of fatalities and their circumstances can vary markedly within a state from one year to the next, in part reflecting single incidents involving multiple deaths, such as airplane crashes and natural disasters.
There are several limitations of using CPS data in CFOI rate calculations. LAUS estimates for states are derived from signal-plus-noise models that use the monthly employment and unemployment measures tabulated from the CPS as the primary input and therefore the caveats from CPS apply to the LAUS data as well.
Employment sampling error: The CPS data used to calculate the CFOI rates are estimates based on a sample rather than a complete count. Therefore, the CPS estimates and corresponding fatality rates have sampling error. The margin of error in the fatality rates is a result of the sampling error of the CPS data used as the denominators. The fatality rates calculated using the CPS may differ from those that would have been obtained from a census of employed persons. See the Explanatory Notes and Estimates of Error in the February 2004 Employment and Earnings for an explanation of CPS sampling and estimation methodology, and standard error computations. The relative standard errors of the CPS estimates can be used to approximate confidence ranges for the fatality rates. Margins of error are presented for the national fatality rates at the 95 percent confidence interval. More information on the reliability of estimates can be found at https://www.bls.gov/iif/additional-resources/reliability-of-estimates.htm.
• Primary job versus job at the time of incident: The CPS annual average employment data used in the rate calculations count workers according to their primary job, whereas CFOI uses the job held when fatally injured, which may differ.
• State of residence versus state of incident: CPS counts workers by their state of residence, whereas CFOI counts workers by state of incident.
• The annual average of hours worked represent total hours at work for CPS respondents, including those that work more than one job. Total hours worked for respondents with multiple jobs will be recorded in the occupation and industry of the primary job.
• Rates are calculated at the level of detail available from the CPS data. Rates are only calculated for those occupations and industries that met minimum thresholds of having at least 5 fatal injuries and 40 million hours worked for national data. The threshold for calculating state fatal injury rates is 5 fatal injuries. See the following section on using fatality rates to evaluate risk for more discussion on the importance of thresholds.
Fatal injury rates estimate the risk of incurring a fatal work injury for workers in a given worker group expressed as the proportion of fatal injuries per total hours worked annually per 100,000 full-time equivalent workers. This allows risks to be compared among different worker groups. Occupations with few fatal injuries and low employment in the reference year are removed from annual fatal injury rate tabulations. Therefore, rates produced in prior years may not appear in future years if they do not meet this threshold.
There are many other elements that factor into any definition of a “dangerous job” such as the likelihood of incurring a nonfatal injury, the potential severity of that nonfatal injury, the safety precautions necessary to perform the job, and the physical and mental rigors the job entails.
Because there is no universal definition of “dangerous” or “hazardous,” the Injuries, Illnesses, and Fatalities (IIF) program does not frame occupations as the “most dangerous” in a particular year. The IIF program also has certain minimum thresholds that must be met for a fatal injury rate to be published. As such, fatal injury rates are not calculated for many occupations that have a relatively small number of fatal work injuries and employment. Please see “Using fatality rates to evaluate risk and dangerous jobs” for more information.
The IIF program has two components that collect and publish data on injuries, illnesses, and fatalities in the workplace: the Survey of Occupational Injuries and Illnesses (SOII) and the Census of Fatal Occupational Injuries (CFOI).
SOII and CFOI collect data and publish incidence rates in different ways, and thus should not be compared with each other. Nonfatal incidence rates by industry are calculated using hours-worked data collected as part of the SOII and are expressed per 100 full-time workers for injury and illness, or injury only cases, and per 10,000 full-time workers for illness cases. Incidence rates for case circumstances and worker characteristics are calculated using hours-worked data collected as part of the SOII for industry and case characteristic rates, as well occupational employment data from the CPS and Occupational Employment Survey (OES) for demographic and occupational rates. Incidence rates for case circumstances and worker characteristics are expressed per 10,000 full-time workers. Fatal injury rates are calculated using hours-worked data provided by the CPS and are expressed per 100,000 full-time equivalent (FTE) workers.
Users should consider a few important factors when comparing different types of nonfatal incidence rates and fatal injury rates.
Caution should be used when comparing estimates between private sector and public sector industries in any particular state because of potential differences in industry makeup and the nature of work done between ownership groups. CFOI state data is only published for all ownerships together at the industry sector level.
Different industry mixes at the industry sector level (the only level at which CFOI publishes state fatal injury rates) mean state-to-state comparisons should be made with caution.
These different industry mixes are a factor when examining both SOII and CFOI rates. Take for instance, a comparison of rates in the agriculture industry in Wisconsin and Florida. Wisconsin’s agriculture industry is primarily animal production; for Florida, it is primarily crop production. Comparing rates in the agriculture industry between these two states would not be advisable because one would be comparing two very different types of agriculture; each with its own workers, equipment, work environments, specific job tasks, hazards, etc.
1 For further discussion, see Joyce Northwood, “Change to Hours-Based Fatality Rates in the Census of Fatal Occupational Injuries,” Monthly Labor Review (January 2010), https://www.bls.gov/opub/mlr/cwc/change-to-hours-based-fatality-rates-in-the-census-of-fatal-occupational-injuries.pdf.