
An official website of the United States government
An official website of the United States government
The .gov means it's official.
Federal government websites often end in .gov or .mil. Before sharing sensitive information,
make sure you're on a federal government site.
The site is secure.
The
https:// ensures that you are connecting to the official website and that any
information you provide is encrypted and transmitted securely.
Crossref 0
A Behavioral Safety Model for Clinical Settings: Coaching for Institutionalization, Perspectives on Behavior Science, 2019.
Patient-on-Staff Assaults: Perspectives of Mental Health Staff at an Acute Inpatient Psychiatric Teaching Hospital in the United States, Canadian Journal of Nursing Research, 2021.
Working conditions and their effect on the health level of psychiatric staff (literature review), V.M. BEKHTEREV REVIEW OF PSYCHIATRY AND MEDICAL PSYCHOLOGY, 2020.
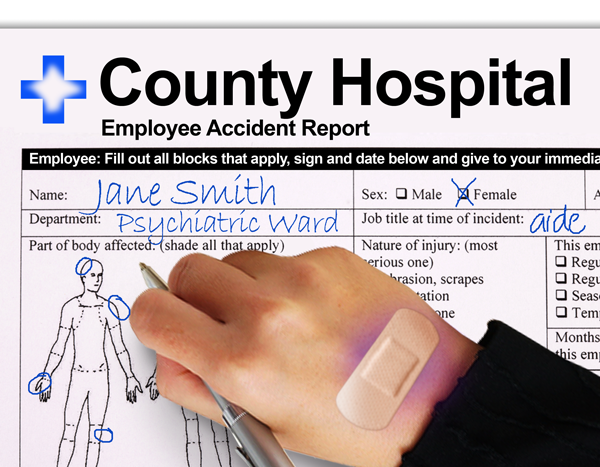
Psychiatric aides and technicians are experiencing high rates of nonfatal occupational injury and illness due to violence in the workplace by patients. For psychiatric aides, the rate is 69 times higher than the national rate of violence in the workplace, and for psychiatric technicians it is 38 times higher. The rates for these two occupations were different from each other even though psychiatric aides and technicians have similar job environments and duties. This article analyzes the similarities and differences of these occupations, gives a brief overview of psychiatric practices in the United States, and looks at areas where more research could be conducted to help prevent future injuries and illnesses for people in these occupations.
In 2011 psychiatric aides had an occupational injury and illness rate that was 7 times higher than the national rate.1 The incidence rate of violence 2 in the workplace for this occupation was 69 times higher than the national rate. While psychiatric technicians are subject to similar working conditions as psychiatric aides, in 2011 they had an overall rate that was 4 times higher than the national rate and their rate of violent incidence in the workplace was 38 times higher than the national rate. Although both occupations experienced high incidence rates compared with the national rates, overall psychiatric aides experienced higher rates than technicians. This article analyzes the similarities and differences between these two occupations and offers some possible reasons why their workplace injury and illness rates differ so greatly from one another.
These rates, along with all nonfatal occupational injury and illness data presented in this article, come from the Survey of Occupational Injuries and Illnesses (SOII), conducted by the Bureau of Labor Statistics (BLS). Employers in this survey are required to maintain records of their workplace injuries and illnesses according to recordkeeping requirements established by the Occupational Safety and Health Administration (OSHA).3 Specifically, this article profiles 2011 SOII data for cases with days away from work. Included are data for both privately owned facilities and state and local government–owned facilities. Data on these occupations are available for prior years, and a brief overview with findings similar to those for 2011 will be shown for 2009 and 2010 data. Also available are data from the BLS Census of Fatal Occupational Injuries on fatal injuries to workers in these occupations, but the numbers are small. From 2003 through 2011, these occupations combined had a total of 4 fatalities; therefore, this article will focus solely on nonfatal data.4
According to the Occupational Outlook Handbook of the Bureau of Labor Statistics, “psychiatric technicians and aides care for people who have mental illness and developmental disabilities. The two occupations are related, but technicians provide therapeutic care, and aides help patients in their daily activities and ensure a safe, clean environment.”5 Psychiatric aides and technicians work with other healthcare professionals such as psychiatrists, psychiatric nurses, social workers, and therapists in various healthcare facilities.
A major difference between workers in these two occupations is their educational attainment. Technicians obtain a certificate or degree typically from a community college or technical school that offers courses in psychiatric or mental health technology. Some programs might also include supervised work experience or cooperative programs; both provide the student with academic credit. Psychiatric technicians may have anywhere from one semester to 2 years of course work leading to either a certificate or associate degree. Psychiatric aides need a high school diploma or equivalent and no specific certification or psychiatric course work.6
Both psychiatric aides and technicians must participate in on-the-job training before they begin to work without direct supervision. This training can vary from a few weeks to several months. Training may include gaining hands-on experience while working under the supervision of an experienced technician or aide. Technicians and aides may also attend workshops, lectures, or in-service training.7
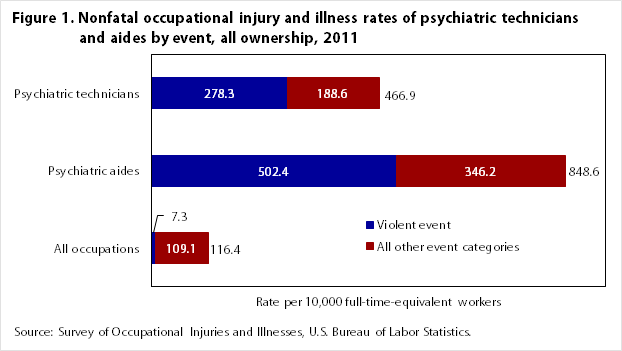
Psychiatric aides had an injury and illness rate that was nearly 2 times the rate for psychiatric technicians in 2011 and about 7 times the rate for all occupations combined (see figure 1). Comparisons for 2010 and 2009 tell a similar story: psychiatric aides had a much higher injury and illness rate than all occupations (14 times in 2010 and 11 times in 2009) as well as a higher rate than psychiatric technicians (4 times in 2010 and 2.5 times in 2009).
| Occupation | Incidence rate | ||
|---|---|---|---|
| Violent event | All other event categories | Total | |
| All occupations | 7.3 | 109.1 | 116.4 |
| Psychiatric aides | 502.4 | 346.2 | 848.6 |
| Psychiatric technicians | 278.3 | 188.6 | 466.9 |
| Note: Incidence rates represent the number of injuries and illnesses per 10,000 full-time workers. Source: Survey of Occupational Injuries and Illnesses, U.S. Bureau of Labor Statistics. | |||
Violence in the workplace was the most frequent event that led to injuries and illnesses among both psychiatric aides and technicians. Although there is a difference in the rates between psychiatric aides and technicians, both of these occupations had rates that were well above the rate of occupational injury and illness for all occupations.
In 2011, 71,570 people were employed as psychiatric aides and 69,840 as psychiatric technicians.8 There were some differences in the type of healthcare facilities that employed them. As table 1 shows, workers in these occupations were employed in similar industries, but the breakdown of where they were employed does differ to some degree. The greatest difference can be seen in mental health and substance abuse facilities. One quarter of all psychiatric aides were employed in this type of facility in 2011 compared with 6 percent for psychiatric technicians. These two occupations also exhibit differences in employment in state government facilities.
| Industry | Percent of psychiatric aides | Percent of psychiatric technicians |
|---|---|---|
| Psychiatric and substance abuse hospitals | 38.1 | 34.1 |
| Mental health and substance abuse facilities | 25.1 | 6.1 |
| State government | 17.3 | 33.7 |
| General medical and surgical hospitals | 5.9 | 13.4 |
| Note: Data are from the Occupational Employment Statistics program, which uses definitions of industries found in the North American Industry Classification System (NAICS). NAICS is used to group establishments into industries on the basis of the goods or services they produce. The NAICS structure makes it possible to collect and calculate establishment data by broad industrial sectors, subsectors (3-digit NAICS levels), industry groups (4-digit NAICS levels), and NAICS industries (5-digit NAICS levels). The OES survey produces occupational employment and wage estimates for sector, 3-, 4-, and selected 5-digit NAICS levels. With the exception of schools and hospitals, industry-specific estimates only include privately owned establishments. Schools and hospitals that are owned by state and local governments are included with the estimates of privately owned schools and hospitals in the appropriate NAICS code. OES classifies most government-owned establishments differently from NAICS, which classifies government establishments according to their primary function and includes detailed industries within sector 92, public administration. The OES does not use NAICS sector 92. Instead, the OES survey produces occupational employment and wage estimates at the federal, state, and local government levels and denotes them with industry codes 9991, 9992, and 9993, respectively. The state and local government data consist of all state and local government establishments, except schools and hospitals. Source: Occupational Employment Statistics, U.S. Bureau of Labor Statistics. | ||
Psychiatric aides’ and technicians’ employment environments also vary by patient type and establishment ownership. Patients that psychiatric aides and technicians work with can be diagnosed with a range of mental health disorders, such as depression, anxiety disorders, attention-deficit disorder, autism spectrum disorder, eating disorders, mood disorders, personality disorders, and schizophrenia. The aides and technicians also work with patients that have been diagnosed with Alzheimer’s disease or dementia, intellectual disabilities, and substance abuse. These diagnoses can vary in terms of severity. Patients can range from children to adults.9
Treatment for patients can be in either inpatient or outpatient settings. Patients receiving inpatient care live in the facilities where they are being treated. Individuals receiving outpatient care seek treatment at a facility but do not reside there during their treatment. Individuals receiving inpatient treatment are more likely to have been diagnosed with a more severe mental illness and to have been involuntarily committed or civilly committed through court proceedings to the facility where they are receiving treatment.10 Civil commitment principles have shifted in the United States over the last two centuries, away from a “need-for-treatment model” to a “dangerous model,” where “dangerous” alludes to the likelihood of inflicting physical harm on oneself (suicide) or another person (homicide) in the near future.11 In 1964, the District of Columbia set this “dangerous model” standard for civil commitment.12 All but a few states have followed the District by using a “dangerous model” when setting their standards for civil commitment.13
Apart from the standard civil commitment situations, there are unique situations resulting in civil commitment. One such situation is when a person has broken the law during an episode or episodes of mental illness, and then in a court of law has been found not guilty by reason of insanity. In this scenario, the individual is committed to the medical system and receives psychiatric care. In many circumstances, the length of treatment at a psychiatric facility can surpass a prison sentence for the crime that was committed during the individual’s altered mental state.14
A second unique situation of civil commitment is enacted in 20 different states across the United States and is used to commit individuals who are deemed to be sexually violent predators. In this situation, a person is sentenced to serve time in a correctional facility after the person is found guilty in a court of law of committing a violent sexual crime. If after serving the sentence, the individual is diagnosed with a mental illness, he or she is then civilly committed to a psychiatric facility. The laws in these states deem these individuals to present a risk to the public because of their diagnosis; these individuals need medical assistance to keep the general public safe and to help the individual with their mental illness.15
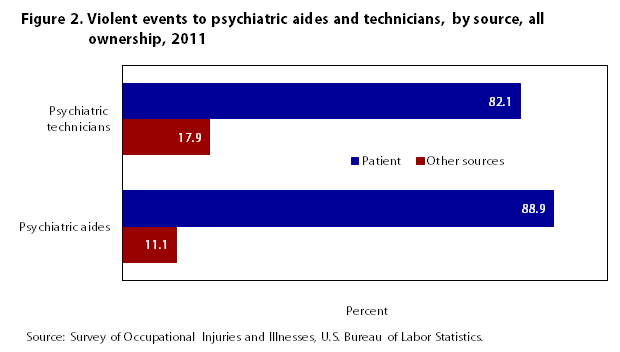
It is unclear to what extent patients with a mental illness diagnosis, such as those discussed above, are violent because of their disease or because of the “social interchange that led up to the violence.”16 What is known, however, is that this cohort of the population does, at times, exhibit erratic behaviors. A major source of violence among psychiatric technicians (82.1 percent) and psychiatric aides (88.9 percent) in 2011 was “patient” (see figure 2 17).
| Source of violent event | Percent distribution | |
|---|---|---|
| Psychiatric aides | Psychiatric technicians | |
| Other sources | 11.1 | 17.9 |
| Patient | 88.9 | 82.1 |
| Source: Survey of Occupational Injuries and Illnesses, U.S. Bureau of Labor Statistics. | ||
| Occupation | Incidence rate | |
|---|---|---|
| State ownership | Private ownership | |
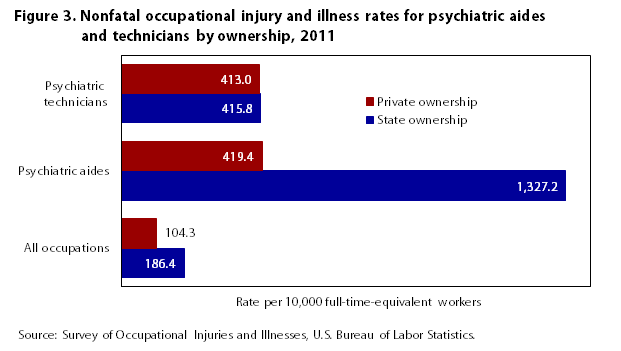
| All occupations | 186.4 | 104.3 |
| Psychiatric aides | 1,327.2 | 419.4 |
| Psychiatric technicians | 415.8 | 413.0 |
| Note: Incidence rates represent the number of injuries and illnesses per 10,000 full-time workers. Source: Survey of Occupational Injuries and Illnesses, U.S. Bureau of Labor Statistics. | ||
Figure 3 displays data for nonfatal occupational injuries and illnesses of psychiatric aides and technicians compared with all occupations and provides a breakdown between state-owned and privately owned facilities for 2011. The most striking rate is that of psychiatric aides in state facilities, at 1,327.2 cases per 10,000 workers. It is roughly 3 times the rate of psychiatric aides in private institutions and psychiatric technicians in both state and private institutions. This rate is also roughly 7 times the rate of all occupations in state-owned establishments in 2011.
| Occupation | Incidence rate | |
|---|---|---|
| State ownership | Private ownership | |
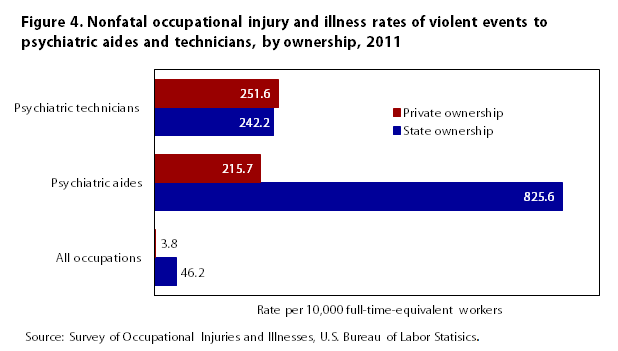
| All occupations | 46.2 | 3.8 |
| Psychiatric aides | 825.6 | 215.7 |
| Psychiatric technicians | 242.2 | 251.6 |
| Note: Incidence rates represent the number of illnesses and injuries per 10,000 full-time workers. Source: Survey of Occupational Injuries and Illnesses, U.S. Bureau of Labor Statistics. | ||
Looking at the rates of violent events for these occupations, by ownership (see figure 4), we see that psychiatric aides in state institutions experienced the highest rate of violent acts at 825.6 cases per 10,000 workers. That rate was nearly 4 times the rate for those employed in privately owned facilities and about 3 times the rate for psychiatric technicians employed in either state- or privately owned facilities. The rate for psychiatric aides in state-owned facilities was nearly 18 times the rate for total occupations in state establishments. This graph shows that relationships between nonfatal occupational injury and illness rates of psychiatric technicians and the rates for all occupations are similar to the relationships shown in figures 1 through 3.
Although psychiatric technicians did not have rates of nonfatal occupational injuries and illnesses that were as high as those for aides, they did have rates that were higher than all occupations combined in 2011. This relationship also was true for the rates of violence against psychiatric technicians in both privately and state-owned institutions.
| Nature of the injury or illness | Proportion of psychiatric aides’ injuries and illnesses | Proportion of psychiatric technicians’ injuries and illnesses |
|---|---|---|
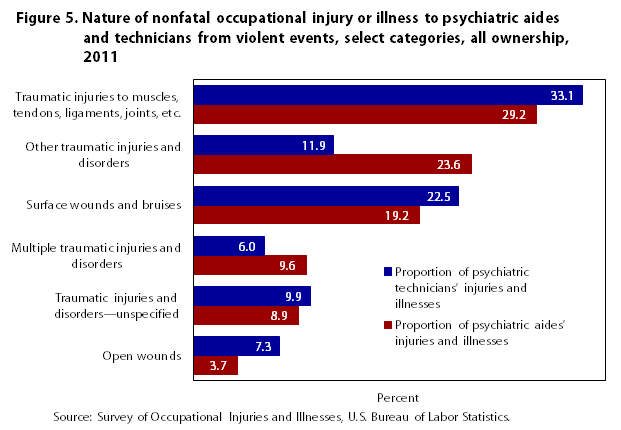
| Open wounds | 3.7 | 7.3 |
| Traumatic injuries and disorders—unspecified | 8.9 | 9.9 |
| Multiple traumatic injuries and disorders | 9.6 | 6.0 |
| Surface wounds and bruises | 19.2 | 22.5 |
| Other traumatic injuries and disorders | 23.6 | 11.9 |
| Traumatic injuries to muscles, tendons, ligaments, joints, etc. | 29.2 | 33.1 |
| Source: Survey of Occupational Injuries and Illnesses, U.S. Bureau of Labor Statistics. | ||
The nature 18 of the injuries and illnesses due to violent events is somewhat different for psychiatric aides and technicians. The biggest difference is found in the nature category “other traumatic injuries and disorders,” which accounted for 11.9 percent of violent injuries and illnesses among psychiatric technicians compared with 23.6 percent among psychiatric aides (see figure 5). This nature category includes symptoms such as soreness, pain, swelling, inflammation, and irritation. It also captures conditions that are not included in other nature-of-illness-or-injury categories. For other categories, the percentages for psychiatric aides are similar to those for psychiatric technicians. The kind of violent injury most often suffered by psychiatric aides and technicians is “traumatic injuries to muscles, tendons, ligaments, joints, etc.” In this category psychiatric aides had a proportion of 29.2 percent while technicians had a proportion of 33.1 percent. This nature category includes symptoms such as dislocations, sprains, strains, and tears.
| Nature of the injury or illness | Number of days away from work | |
|---|---|---|
| Psychiatric aides | Psychiatric technicians | |
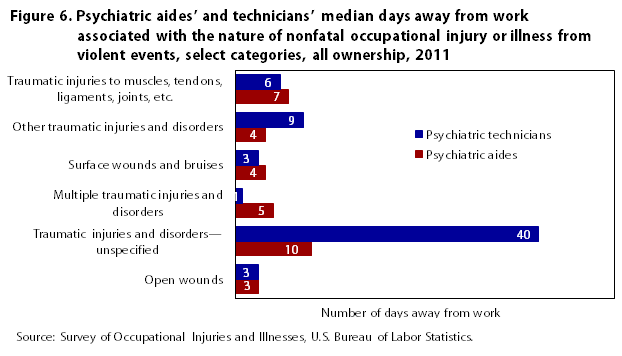
| Open wounds | 3 | 3 |
| Traumatic injuries and disorders—unspecified | 10 | 40 |
| Multiple traumatic injuries and disorders | 5 | 1 |
| Surface wounds and bruises | 4 | 3 |
| Other traumatic injuries and disorders | 4 | 9 |
| Traumatic injuries to muscles, tendons, ligaments, joints, etc. | 7 | 6 |
| Source: Survey of Occupational Injuries and Illnesses, U.S. Bureau of Labor Statistics. | ||
Another way to analyze the severity of the injury or illness caused by a violent event is to look at median days away from work (see figure 6). These data can help show how severe the injury or illness was for the categories shown because more severe injuries or illnesses typically require more days away from work to recuperate. One can see again that workers in the two occupations experience some differences in terms of severity of injury or illness. The most striking difference is in “traumatic injuries and disorders—unspecified,” a category that results in the highest median days away from work for both occupations: technicians have a median of 40 days away from work, while the median days away from work for aides is 10. Although “traumatic injuries and disorders—unspecified” accounts for a similar proportion of total violence-related injuries and illnesses encountered by aides and by technicians (9.9 percent and 8.9 percent respectively), the median number of days away from work shows that workers in these two occupations experience different levels of severity for this type of injury or illness. Hence, while the occupations have some similarities in terms of violence-related injuries and illnesses, some major differences exist as well.
| Part of body affected | Proportion of psychiatric aides’ injuries and illnesses | Proportion of psychiatric technicians’ injuries and illnesses |
|---|---|---|
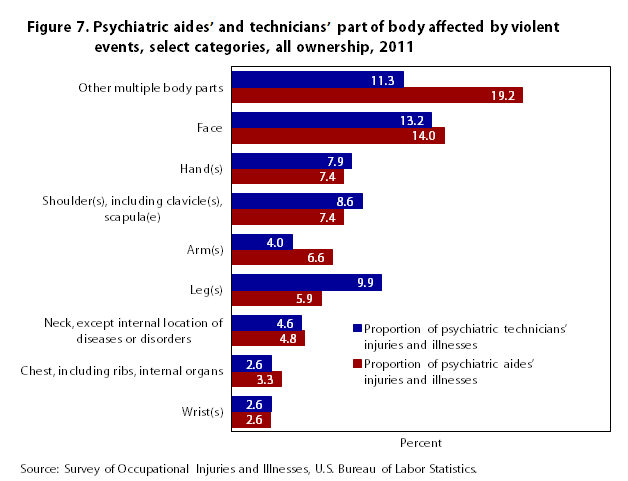
| Wrist(s) | 2.6 | 2.6 |
| Chest, including ribs, internal organs | 3.3 | 2.6 |
| Neck, except internal location of diseases or disorders | 4.8 | 4.6 |
| Leg(s) | 5.9 | 9.9 |
| Arm(s) | 6.6 | 4.0 |
| Shoulder(s), including clavicle(s), scapula(e) | 7.4 | 8.6 |
| Hand(s) | 7.4 | 7.9 |
| Face | 14.0 | 13.2 |
| Other multiple body parts | 19.2 | 11.3 |
| Source: Survey of Occupational Injuries and Illnesses, U.S. Bureau of Labor Statistics. | ||
Likewise, the two occupations have some similarities and differences when it comes to the part of body 19 affected by a violent event (see figure 7). The categories with the largest contrast are legs and “other multiple body parts.” Technicians suffered proportionately more injuries and illnesses to their legs than did aides, but aides had proportionately more injuries in the category of “other multiple body parts.” This shows again that the two occupations, while similar in many categories of part of body affected, have some categories that differ greatly. For both occupations, hitting, kicking, beating, shoving, or contact with a person while restraining or subduing are examples of the types of violent events that led up to legs or “other multiple body parts” being affected during an incident.
The associated median days away from work show the severity of the injuries and illnesses to the part of body affected during a violent event. Figure 8 shows that the biggest difference in days away from work, and therefore in severity, is in wrist injuries. While the proportion of wrist injuries is nearly the same for both occupations (less than 3 percent), the median number of days away from work for psychiatric technicians, at 43 days, is 7 times greater than the median for psychiatric aides (6 days).
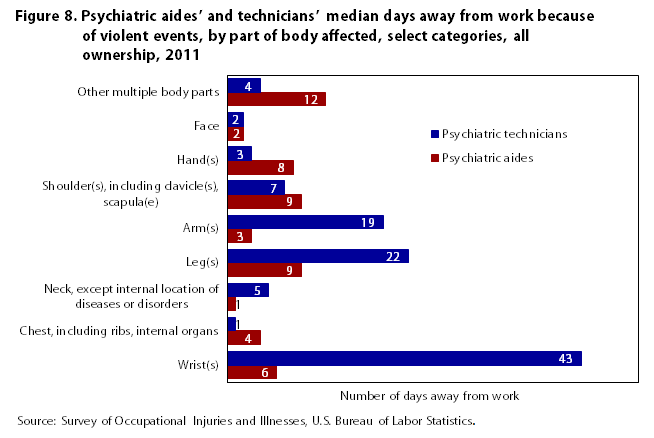
| Part of body affected | Number of days away from work | |
|---|---|---|
| Psychiatric aides | Psychiatric technicians | |
| Wrist(s) | 6 | 43 |
| Chest, including ribs, internal organs | 4 | 1 |
| Neck, except internal location of diseases or disorders | 1 | 5 |
| Leg(s) | 9 | 22 |
| Arm(s) | 3 | 19 |
| Shoulder(s), including clavicle(s), scapula(e) | 9 | 7 |
| Hand(s) | 8 | 3 |
| Face | 2 | 2 |
| Other multiple body parts | 12 | 4 |
| Source: Survey of Occupational Injuries and Illnesses, U.S. Bureau of Labor Statistics. | ||
The severity among injuries to legs and arms differ between the two occupations. Although the proportion of violent injuries and illnesses that occur to arms is similar for the two occupations, technicians have 19 median days away from work for arm injuries compared with 3 days for aides; therefore, it is possible that technicians are experiencing more severe injuries and illnesses relative to aides. Technicians also have more severe injuries and illnesses to their legs than do aides. In contrast, aides are more likely than technicians to have injuries and illnesses to “other multiple body parts” than do technicians, and aides spend more days away from work for other-multiple-body-parts injuries and illnesses.
Therefore, although psychiatric aides had more injuries on the whole (2,710 versus 1,510), the proportions of injuries and illnesses due to violent events show some differences between the two occupations when we look at specific nature and part categories. The associated median days away from work measure also highlights some of the differences in severity that these occupations experienced. Overall, psychiatric aides experienced a median of 5 days away from work because of violent events compared with a median of 4 days for technicians, but more detailed data show that for certain categories, the differences in median days away from work and, therefore, severity are quite strong.
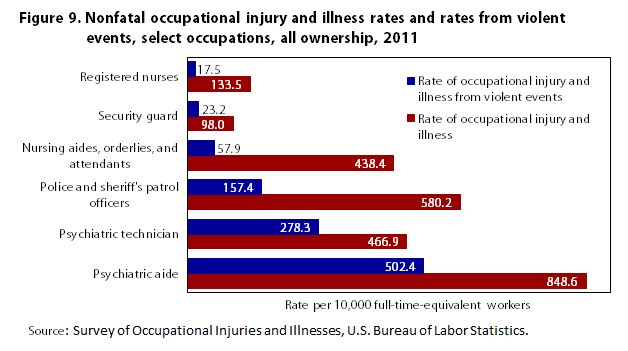
| Occupation | Rate of occupational injury and illness | Rate of occupational injury and illness from violent events |
|---|---|---|
| Psychiatric aide | 848.6 | 502.4 |
| Psychiatric technician | 466.9 | 278.3 |
| Police and sheriff's patrol officers | 580.2 | 157.4 |
| Nursing aides, orderlies, and attendants | 438.4 | 57.9 |
| Security guard | 98.0 | 23.2 |
| Registered nurses | 133.5 | 17.5 |
| Note: Incidence rates represent the number of illnesses and injuries per 10,000 full-time workers. Source: Survey of Occupational Injuries and Illnesses, U.S. Bureau of Labor Statistics. | ||
Figure 9 compares rates of violence-related injuries and illnesses for a selected group of occupations with the rates for psychiatric aides and technicians. Some of the occupations are in the healthcare industry, such as nursing aides, orderlies, and attendants; and registered nurses.20 The other occupations are characterized as having a higher likelihood of experiencing a violent event because of the nature of their job duties, such as police officer, and security guard.21
For each of the selected occupations, the figure displays the total rate of nonfatal occupational injury and illness along with the rate for the event category related to violence. From these selected occupations, psychiatric aide has a higher rate overall as well as a higher rate for events relating to violence. Psychiatric technicians also has a higher rate of injury and illness caused by violent events than did the other four occupations excluding psychiatric aides.
While these data do not provide a complete count of how many violent events these occupations encounter in their work environments (because violent events that do not result in days away from work are not included), they do indicate that psychiatric aides and technicians are likely to encounter a greater number of violent events than do certain other healthcare occupations.
An analysis of the data provides three main observations. First, psychiatric aides and technicians, while similar in environment and job duties, experience occupational injuries and illnesses at rates different from one another and different from those of other occupations. Second, the event and source of the majority of the injuries and illnesses of psychiatric aides and technicians are the same: violence and patients. Third, there are similarities in terms of their injury and illness experience when we look at the nature of the injuries and illnesses as well as the part of body affected, in certain categories, such as other traumatic injuries and disorders, legs, and “other multiple body parts;” these occupations’ rates differ from one another, reinforcing the fact that the injuries and illnesses experiences of psychiatric aides and of psychiatric technicians are not always the same.
While SOII data can give some insight into the injury and illness profile of these two occupations, much is still unknown. For example, we know that educational attainment for technicians exceeds that of aides, but we do not know how much this contributes to the differences in injury and illness experiences between these two occupations. It is also unknown how much time workers in these occupations spend with patients on a day-to-day basis. It is possible that aides spend more time with patients during the workday than do technicians and therefore are more likely to encounter a violent event. Another unknown is the employee-to-patient ratio. Knowing how many patients each aide and technician interacts with could possibly explain some of the differences, especially when comparing the rates for workers in state versus private institutions. It is also unknown how secure each type of facility is and what sort of training is given to employees before they begin their job. We also have no data on injuries to patients, so we do not know whether they, too, are injured (unintentionally) during violent events.
Data on the work environments of psychiatric aides and technicians, along with training data and employee-to-patient ratios, would be useful in determining how to prevent such high injury and illness rates from occurring in these occupations. Also, detailed data on the types of patients that psychiatric aides and technicians are working with would be useful because patients are the source of most of the nonfatal occupational injuries and illnesses that they are encountering. Access to these kinds of data may help determine both the type of training that workers in these occupations should have and what the technician-to-patient or aide-to-patient ratio should be to bring about a safer working environment.
Jacqueline Longton, "A look at violence in the workplace against psychiatric aides and psychiatric technicians," Monthly Labor Review, U.S. Bureau of Labor Statistics, March 2015, https://doi.org/10.21916/mlr.2015.4
1 All data on nonfatal work-related injuries and illnesses involving days away from work, including data on violence in the workplace, are from the BLS Survey of Occupational Injuries and Illnesses (SOII) and are available at https://www.bls.gov/iif/oshcdnew.htm.
2 The shortened term, violent event, is used throughout the paper to refer to the event category known as violence and other injuries by people or animals. Please see the Occupational Injury and Illness Classification System Manual for the full definition of violent event, https://www.bls.gov/iif/oshoiics.htm.
3 See Occupational Safety and Health Administration injury and illness recordkeeping and reporting requirements at https://www.osha.gov/recordkeeping/.
4 From the Census of Fatal Occupational Injuries, 2003–2011, https://www.bls.gov/iif/oshcfoi1.htm.
5 Occupational Outlook Handbook, April 2012, https://www.bls.gov/ooh/healthcare/psychiatric-technicians-and-aides.htm.
6 Ibid.
7 Ibid.
8 These 2011 data are from the Occupational Employment Statistics (OES) survey. For data on psychiatric technicians and psychiatric aides, see https://www.bls.gov/oes/tables.htm. The OES program uses industry definitions found in the North American Industry Classification System (NAICS). The NAICS is used throughout the federal government to group establishments into industries on the basis of the goods or services they produce. The NAICS structure makes it possible to collect and calculate establishment data by broad industrial sectors, subsectors (3-digit NAICS levels), industry groups (4-digit NAICS levels), and NAICS industries (5-digit NAICS levels). The OES survey produces occupational employment and wage estimates for sector, 3-, 4-, and selected 5-digit NAICS levels. With the exception of schools and hospitals, industry-specific estimates only include privately owned establishments. Schools and hospitals that are owned by state or local governments are included with the estimates of privately owned schools and hospitals in the appropriate NAICS code. OES classifies most government-owned establishments differently from the NAICS. The NAICS classifies government establishments according to their primary function and includes detailed industries within sector 92 Public Administration. The OES does not use NAICS sector 92. Instead, the OES survey produces occupational employment and wage estimates at the federal, state, and local government levels and denotes them with industry codes 9991, 9992, and 9993, respectively. The state and local government data consist of all state and local government establishments except schools and hospitals. Data for state and local government including schools and hospitals are also available. Estimates for schools and hospitals are available for private, state, and local government ownerships combined, as well as by individual ownership types. The federal government estimates consist of all establishments in the executive branch of the federal government. Beginning in 2010, Tennessee Valley Authority data are included in the federal government estimates as well. The judicial and legislative branches of the federal government are not surveyed.
9 For data on the types and prevalence of various mental disorders, see National Institute of Mental Health statistics at http://www.nimh.nih.gov/statistics/index.shtml and http://www.nimh.nih.gov/health/topics/index.shtml.
10 Megan Testa and Sara G. West, “Civil commitment in the United States,” Psychiatry, October 2010, pp. 30–40.
11 Ibid, pp. 33.
12 Ibid, p. 33.
13 Ibid, p. 33.
14 Ibid, p. 35.
15 Ibid, pp. 35–36.
16 Heather Stuart, “Violence and mental illness: an overview,” World Psychiatry, June 2003, http://www.ncbi.nlm.nih.gov/pmc/articles/PMC1525086/.
17 Categories in figure 2 may not sum to 100 percent because of rounding of components.
18 For the definition of what is meant by the nature of injuries and illnesses, see Occupational Injury and Illness Classification System Manual, https://www.bls.gov/iif/oshoiics.htm.
19 For the definition of what is meant by part of body, see the Occupational Injury and Illness Classification System Manual, https://www.bls.gov/iif/oshoiics.htm.
20 The number and incidence rates for nursing aides, orderlies, and attendants and registered nurses are based on the 2000 Standard Occupational Classification (SOC) definition. Employment data needed to calculate an incidence rate based on the 2010 SOC definitions are not available.
21 Information on the work environments of each of these occupations can be found in the Occupational Outlook Handbook.