Section 3: Competitiveness in manufacturing
On This Page
- Chart 3.1 - Hourly compensation costs in manufacturing, selected countries, in U.S. dollars, 2009
- Chart 3.2 - Hourly compensation costs in manufacturing, selected countries and regions, in U.S. dollars, 2009
- Chart 3.3 - Hourly compensation costs in manufacturing and exchange rates, selected countries, annual percent change, 2008–2009
- Chart 3.4 - Growth in manufacturing hourly compensation costs, selected countries, average annual rates, 2000–2007 and 2007–2009
- Chart 3.5 - Hourly compensation costs in manufacturing, selected countries and regions, annual percent changes, 2004–2009
- Chart 3.6 - Components of hourly compensation costs in manufacturing, selected countries, in percent, 2009
- Chart 3.7 - Manufacturing productivity growth, selected countries, average annual rates, 2000–2007 and 2007–2009
- Chart 3.8 - Manufacturing output growth, selected countries, average annual rates, 2000–2007 and 2007–2009
- Chart 3.9 - Growth in manufacturing hours worked, selected countries, average annual rates, 2000–2007 and 2007–2009
- Chart 3.10 - Growth in manufacturing unit labor costs in national currency, selected countries, average annual rates, 2000–2007 and 2007–2009
- Chart 3.11 - Growth in manufacturing unit labor costs in U.S. dollars, selected countries, average annual rates, 2000–2007 and 2007–2009
- Chart 3.12 - Gap between productivity and real hourly compensation in manufacturing, selected countries, 1970–2009
- Notes - Sources and definitions
Three indicators of international competitiveness in the manufactured goods sector are: hourly compensation costs, labor productivity, and unit labor costs.
Hourly compensation measures employers’ average hourly labor costs in the manufacturing sector.
Labor productivity (output per hour worked) measures how effectively hours worked are converted into output. Unit labor costs measure the cost of labor compensation expended to produce one unit of output. Increases in labor productivity indicate that a country’s workers are becoming more efficient, while declines in unit labor cost indicate that an economy is becoming more cost competitive.
Chart 3.1
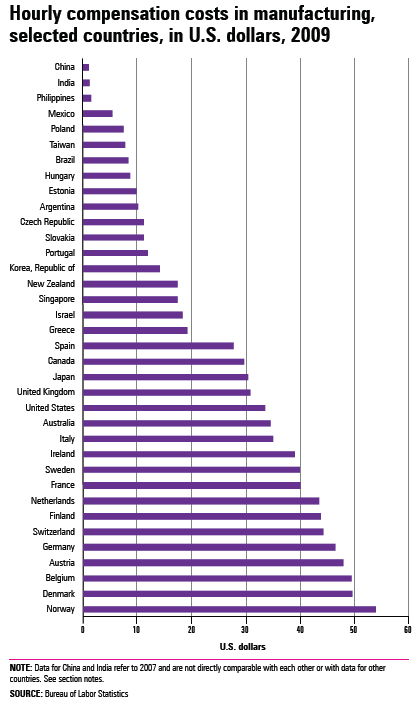
- The 12 countries with the highest manufacturing hourly compensation costs were all in Europe, followed by Australia and the United States.
- Costs in Norway were 1.6 times the U.S. level and roughly 50 times costs in China.
- Labor costs in China and India have been growing faster than those in the United States in recent years, but were still less than 4 percent of the U.S. level.
 Back to Top
Chart 3.2
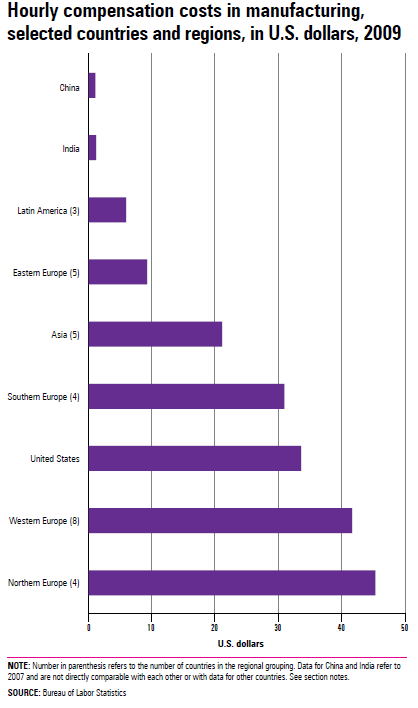
- Costs in Northern Europe were, on average, $12 higher than those in the United States, while costs in Latin America were $28 lower than the U.S. level.
- Eastern European countries, on average, had the lowest hourly compensation costs within Europe, at $36 below the Northern European level.
- Costs in China were only 5 percent of costs in other Asian countries.
Back to Top
Chart 3.3
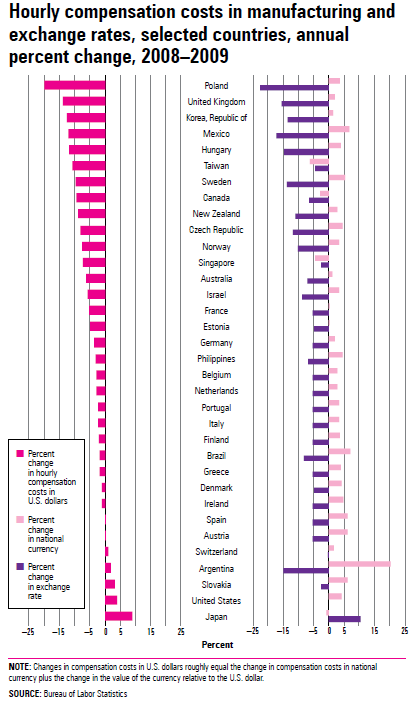
- From 2008 to 2009, currencies in all countries except Japan lost value against the U.S. dollar, causing widespread declines in dollar-denominated compensation costs.
- Canada, Singapore, and Taiwan experienced currency depreciation along with declining compensation costs in national currency, leading to even larger drops in U.S.-dollar costs.
Back to Top
Chart 3.4
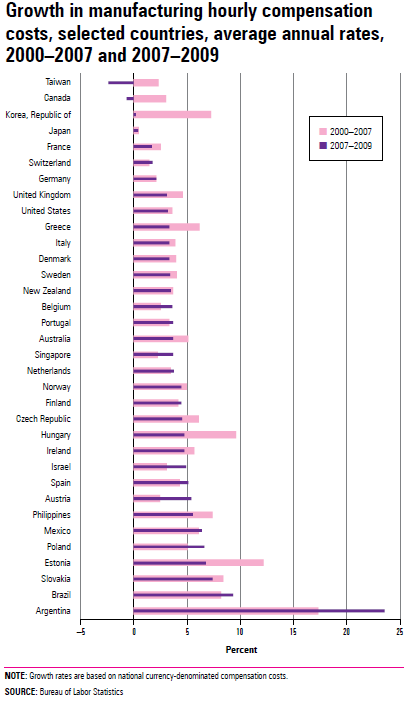
- Most countries experienced higher growth in compensation costs, on average, over the first 7 years of the last decade than they did over the last 2 years.
- The Republic of Korea, Argentina, Estonia, Hungary, and Taiwan had the largest differences in compensation cost growth across the two periods.
- In Canada and Taiwan, compensation costs declined in the latter period, a trend that is rarely seen.
Back to Top
Chart 3.5
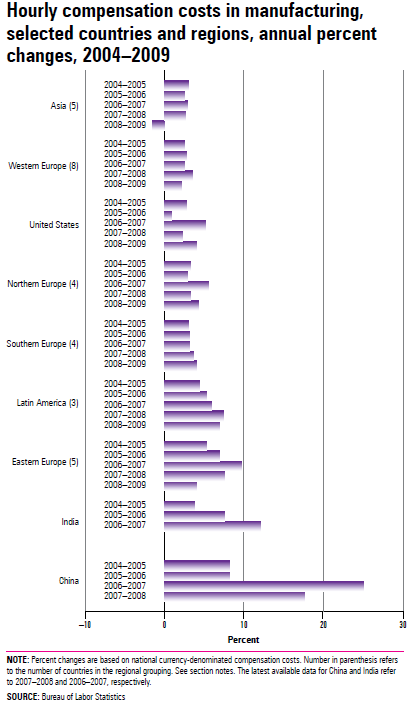
- Manufacturing compensation costs in China grew the fastest, while costs in the rest of Asia and Western Europe grew at the slowest pace.
- Eastern Europe and Latin America also saw rapid increases in compensation, although cost growth in Eastern Europe slowed substantially from 2008 to 2009.
- Asia experienced a slight decline in compensation costs between 2008 and 2009, a trend not shared with other regions of the world.
Back to Top
Chart 3.6
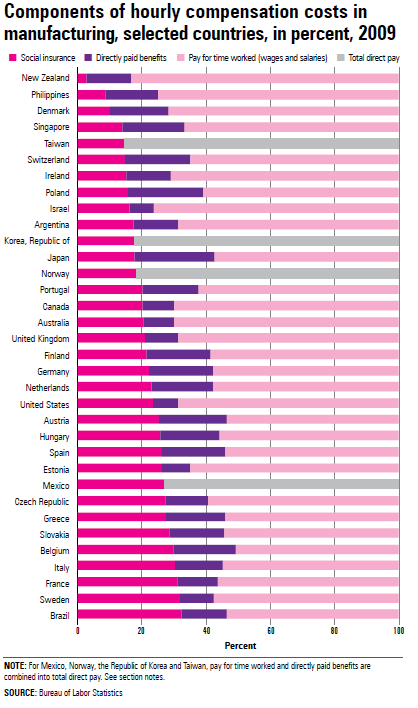
- Total benefits (social insurance and directly paid benefits) surpassed 40 percent of compensation costs in 15 of 34 countries.
- Total benefits as a percentage of total costs were highest in Belgium, at 49 percent of costs, and lowest in New Zealand, at 17 percent. The ratio of benefits to total costs in the United States was 31 percent.
- For manufacturers in Brazil, Sweden, and France, social insurance costs made up approximately 33 percent of total compensation costs in 2009. Insurance in New Zealand, however, accounted for only 3 percent of total costs.
Back to Top
Chart 3.7
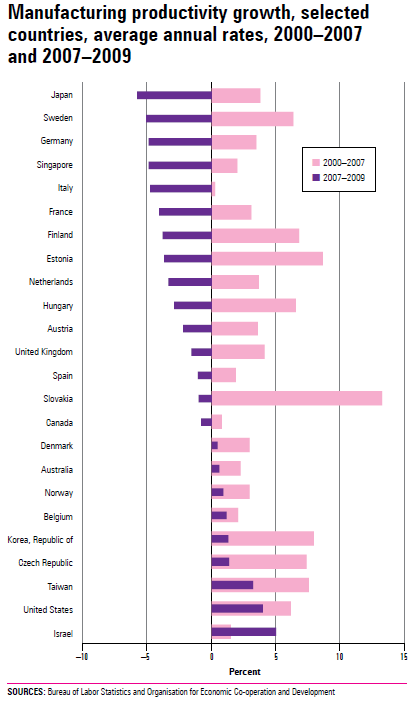
- Although manufacturing productivity (output per hour) grew for all countries from 2000 to 2007, productivity fell sharply in many countries from 2007 to 2009.
- Japan, Sweden, Germany, and Singapore experienced the largest productivity declines between 2007 and 2009.
- Israel was the only country that had faster productivity growth during 2007 to 2009 than during 2000 to 2007.
Back to Top
Chart 3.8
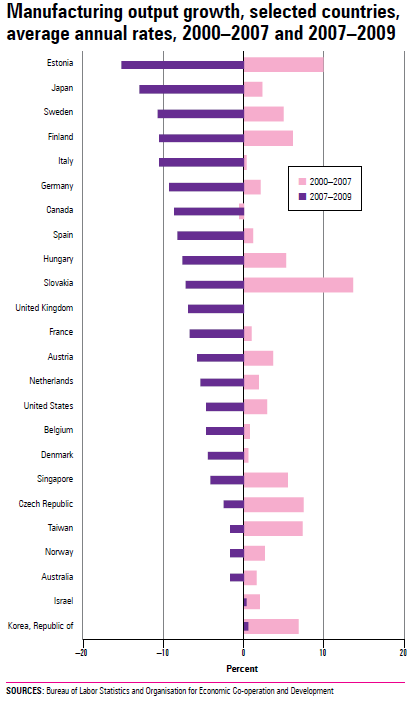
- When output is growing faster than hours worked, productivity (output per hour) rises.
- Output declined between 2007 and 2009 in all countries except the Republic of Korea and Israel, driving declines in manufacturing labor productivity for most countries during the period.
- In contrast to the 2007 to 2009 period, output increased in most countries from 2000 to 2007.
Back to Top
Chart 3.9
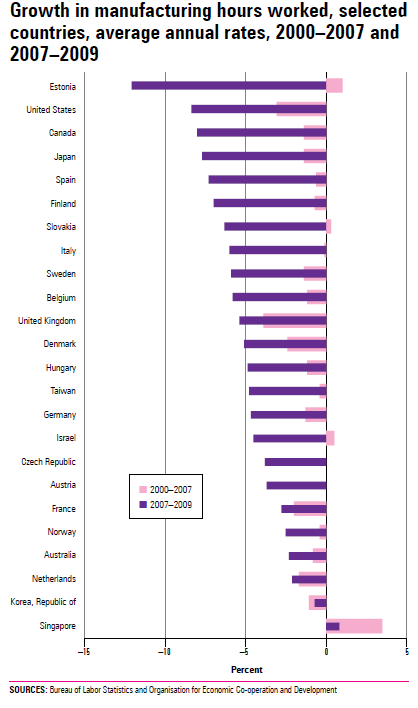
- Hours worked in manufacturing declined between 2007 and 2009 in all countries except Singapore. In many countries, hours fell by more than 5 percent.
- Hours worked also decreased in almost all countries from 2000 to 2007, but not to the extent seen during 2007 to 2009.
Back to Top
Chart 3.10
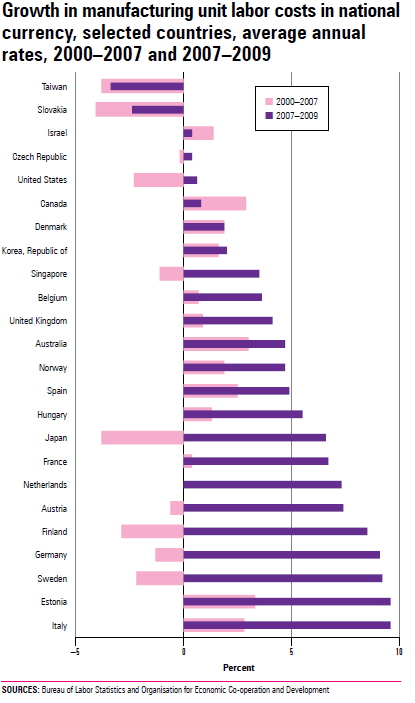
- Manufacturing unit labor costs (compensation per unit of output) in national currency grew between 2007 and 2009 in all countries except Taiwan and Slovakia. Italy, Estonia, and Sweden experienced the largest growth.
- Only Canada and Israel had faster unit labor cost growth during 2000 to 2007 than during 2007 to 2009.
Back to Top
Chart 3.11
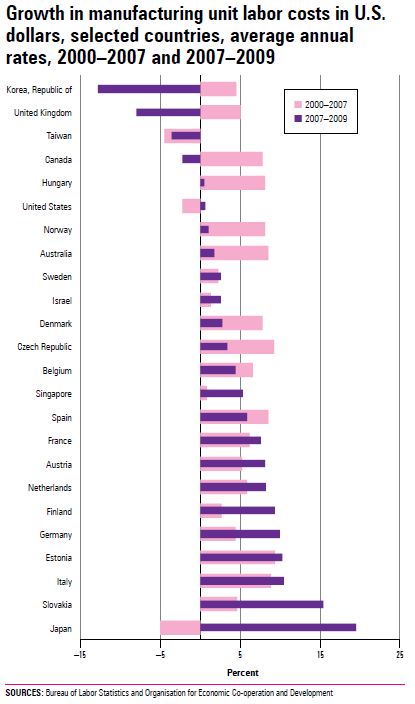
- To gauge international competitiveness, unit labor costs (compensation per unit of output) can be converted to U.S. dollars. Competitiveness increases as unit labor costs decrease.
- Growth in manufacturing unit labor costs converted to U.S. dollars was faster from 2007 to 2009 than the growth between 2000 and 2007 in most countries. Japan and Slovakia had the sharpest increases in unit labor costs.
Back to Top
Chart 3.12
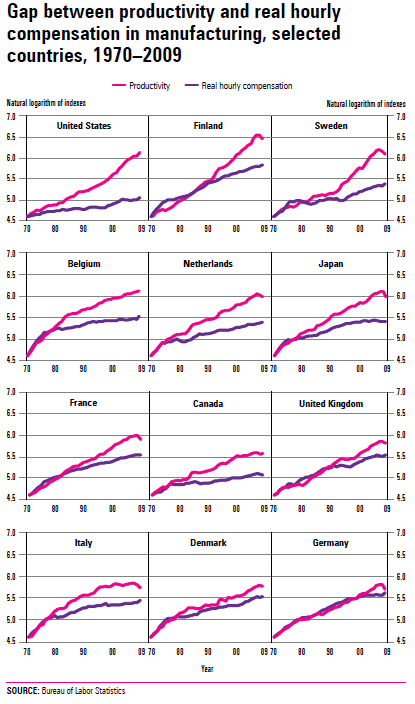
- In most countries, the growth of productivity outpaced the growth of real hourly compensation in manufacturing throughout much of the period from 1970 to 2009, creating a compensation-productivity gap.
- By 2009, the gap was largest in the United States, Finland, and Sweden. The gap was smallest in Germany, Denmark, and Italy.
Back to Top
Notes
Sources
Hourly compensation costs measure employers’ average hourly labor costs in the manufacturing sector. Average costs refer to all employees, are based on national establishment surveys, and are prepared for level comparisons. To permit meaningful level comparisons of employer labor costs across countries, earnings data from national surveys are adjusted to the BLS concept of hourly compensation. Data for all countries are based on the BLS news release International Comparisons of Hourly Compensation Costs in Manufacturing, 2009 and the related time series tables. Also, see the technical notes and country notes associated with this release.
Due to various data gaps and methodological issues, compensation costs for China and India are not directly comparable with each other or with data for other countries.
Average compensation costs for selected regions are calculated by weighting each country’s compensation cost value by its relative importance to U.S. trade. The weights are calculated using the dollar value of U.S. trade (exports plus imports) in manufactured commodities with each country in 2007. Latin America refers to Argentina, Brazil, and Mexico; Western Europe to Austria, Belgium, France, Germany, Ireland, the Netherlands, Switzerland, and the United Kingdom; Northern Europe to Denmark, Finland, Norway, and Sweden; Southern Europe to Greece, Italy, Portugal, and Spain; Eastern Europe to the Czech Republic, Estonia, Hungary, Poland, and Slovakia; and Asia to Japan, the Republic of Korea, the Philippines, Singapore, and Taiwan.
Data on productivity, output, hours, and unit labor costs refer to all employed persons in the manufacturing sector, are based on national accounts, and are prepared for trend (rather than level) comparisons. Data for most countries are based on the BLS news release International Comparisons of Manufacturing Productivity and Unit Labor Cost Trends and the related time series tables. Also, see the technical notes associated with the news release.
Data for the remaining countries are based on data from the Organisation for Economic Co-operation and Development (OECD) database OECD.Stat.
Definitions
Hourly compensation (labor cost) is the average cost to employers of using one hour of labor in the manufacturing sector. Compensation includes (1) pay for time worked, (2) directly paid benefits, and (3) employer social insurance expenditures and labor-related taxes. Pay for time worked refers to wages and salaries for time actually worked, including basic wages, overtime pay, shift and holiday premiums, and regular bonuses. Directly paid benefits primarily include pay for vacations and other leave, irregular bonuses, and pay in kind. Social insurance expenditures are employer contributions to social benefit funds on behalf of workers, such as for unemployment insurance, workers’ compensation, health insurance, and pension funds. Labor-related taxes are taxes on payrolls or employment, net of subsidies. Total hourly direct pay includes all payments made directly to the worker consisting of pay for time worked and directly paid benefits.
Productivity is real output per hour worked. Output is defined as real value added. Hours refer to the hours worked by all persons engaged in the manufacturing process. Unit labor costs are nominal compensation costs divided by real value-added output. Unit labor cost can be expressed in national currency and in U.S. dollars.
Go to:
Last Modified Date: August 2, 2011
